| United States | Canada | |||
| Quarter | Year | Quarter | Year | |
| Aluminum Conduit | 14.4% | 30.1% | 3.5% | 10.5% |
| Asphalt Shingles | 3.5% | 5.5% | 4.5% | 5.5% |
| Concrete Block | 2.5% | 3.5% | 2.0% | 3.7% |
| Drywall | 2.2% | 4.3% | 2.2% | 3.1% |
| Felt Paper | 3.5% | 5.1% | 3.8% | 5.8% |
| Galvanized Pipe | 20.6% | 26.5% | 20.1% | 28.1% |
| Lumber | -16.1% | 83.9% | -16.9% | 101.5% |
| Plywood | -8.3% | 132.4% | -4.0% | 109.4% |
| Ready Mix | 2.7% | 6.9% | 1.6% | 9.1% |
| Rebar | 18.3% | 26.6% | 17.2% | 22.0% |
| Steel Deck | 28.8% | 37.6% | 10.4% | 17.6% |
| Steel Stud | 12.4% | 23.4% | 6.8% | 11.3% |
| Structural Steel | 18.0% | 29.7% | 11.3% | 17.8% |
| 1/2″ Copper Pipe | 25.2% | 50.4% | 23.2% | 26.2% |
| Quarterly Variance | |
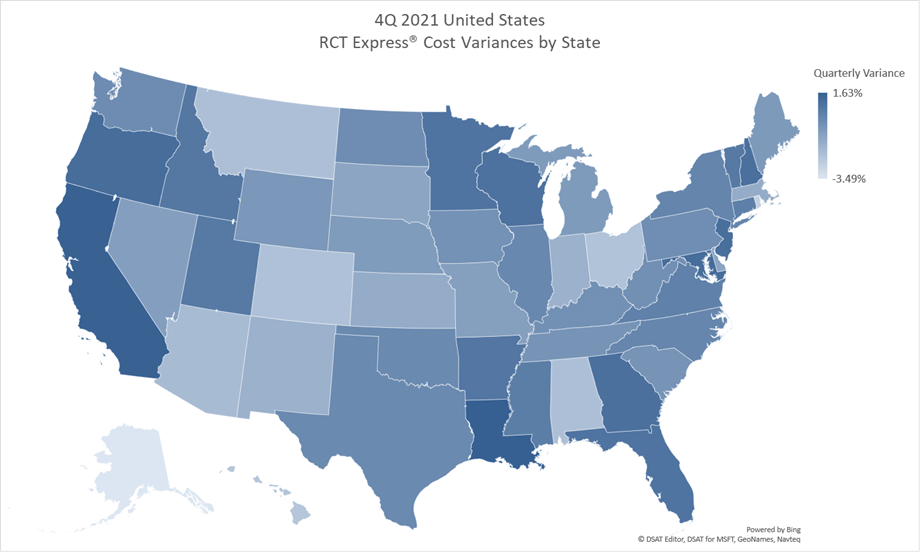
| United States | -0.34% |
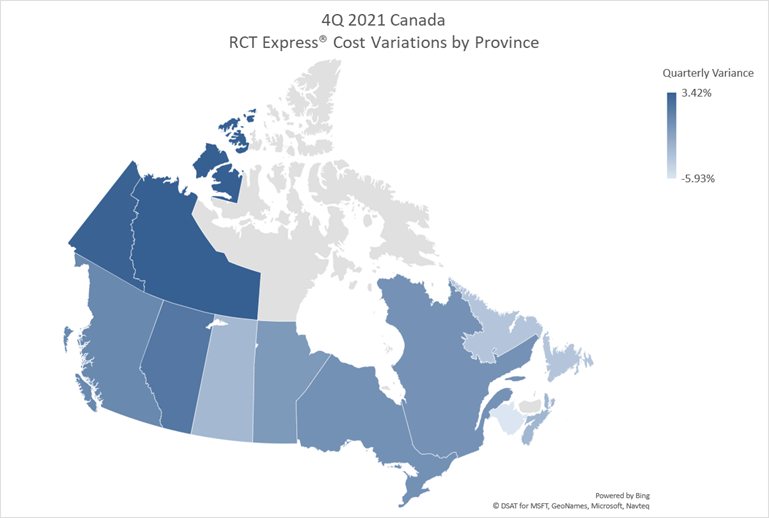
| Canada | -0.61% |
To ensure that our clients receive the most current building material and labor costs, the CoreLogic data team continuously researches hard costs such as labor, material and equipment, including mark-ups. Our research also covers soft costs such as taxes and fringes for reconstruction work performed for the insurance industry in the United States and Canada. We monitor demographics and econometric statistics, government indicators, and localization requirements, including market trends from nearly 3,000 unique economies in the United States, and over 100 in Canada.
Other factors in this process include the following:
In addition, we validate cost data by analyzing field inspection records, contractor estimates, phone surveys and partial and full loss claim information. For more information, or for further explanation, please contact your sales consultant or account manager.
NOTE: The cost information in this bulletin is only intended to give you a general sense of reconstruction cost trends in North America. You should NOT advocate using these factors when adjusting renewal values for specific locations or across your book of business. Please note that the building material and labor cost trends presented in this bulletin are broad averages derived from our research of construction trades and building materials.
The tables below provide a snapshot of the changes in reconstruction costs for residential buildings in the 3rd quarter.
From Q2 2021 to Q3 2021, the average for U.S. building materials increased by 6.2%. For labor, the average wage rate increased 0.9%, based on construction trade contracts that were renewed during the quarter.
CoreLogic monitors a wide variety of construction materials for the residential building industry. A snapshot of some of the most common material elements is listed below:
| United States | 4Q19 | 1Q20 | 2Q20 | 3Q20 | 4Q20 | 1Q21 | 2Q21 | 3Q21 |
| 1/2″ Drywall | 0.4% | -0.6% | 0.0% | 0.5% | 0.2% | 0.1% | 1.8% | 2.2% |
| Asphalt Shingles | 0.4% | 0.7% | 0.5% | 0.5% | 0.4% | 0.6% | 0.9% | 3.5% |
| Romex Wire | -3.0% | -1.1% | -0.8% | 1.2% | 2.4% | 5.6% | 51.9% | 53.7% |
| 1/2″ Plywood | -3.0% | -1.9% | 1.4% | 4.7% | 27.1% | 5.6% | 88.8% | -8.3% |
| 2×4 Lumber | -1.0% | 1.2% | 3.3% | 4.6% | 35.4% | 5.3% | 53.9% | -16.1% |
| R-13 Fiber Batt Insulation | 1.7% | 1.7% | 2.6% | 1.8% | 1.7% | 1.7% | 7.5% | 0.6% |
| 1/2″ Copper Pipe | -1.2% | -0.1% | -0.7% | 0.0% | 1.0% | 3.0% | 15.6% | 25.2% |
| Ready Mix | 0.7% | 0.6% | 0.9% | 0.5% | 1.8% | 0.6% | 1.7% | 2.7% |
| Felt Paper | 0.4% | 0.1% | 0.2% | 0.3% | 0.1% | 0.5% | 0.9% | 3.5% |
| State | Quarterly Variance |
| Alabama | -2.06% |
| Alaska | -3.49% |
| Arizona | -1.85% |
| Arkansas | 0.77% |
| California | 1.57% |
| Colorado | -2.10% |
| Connecticut | 0.44% |
| Delaware | -0.98% |
| Florida | 0.87% |
| Georgia | 1.01% |
| Hawaii | -2.26% |
| Idaho | 0.71% |
| Illinois | 0.09% |
| Indiana | -1.46% |
| Iowa | -0.27% |
| Kansas | -1.29% |
| Kentucky | -0.23% |
| Louisiana | 1.63% |
| Maine | -0.57% |
| Maryland | 1.16% |
| Massachusetts | -1.33% |
| Michigan | -0.63% |
| Minnesota | 0.86% |
| Mississippi | .50% |
| Missouri | -0.78% |
| Montana | -2.05% |
| Nebraska | -0.64% |
| Nevada | -0.76% |
| New Hampshire | 1.01% |
| New Jersey | 1.08% |
| New Mexico | -1.46% |
| New York | 0.21% |
| North Carolina | 0.18% |
| North Dakota | -0.11% |
| Ohio | -2.13% |
| Oklahoma | 0.01% |
| Oregon | 1.13% |
| Pennsylvania | -0.13% |
| Rhode Island | -2.69% |
| South Carolina | -0.33% |
| South Dakota | -1.00% |
| Tennessee | -0.37% |
| Texas | 0.04% |
| Utah | 0.65% |
| Vermont | 0.65% |
| Virginia | 0.38% |
| Washington | -0.06% |
| West Virginia | -0.20% |
| Wisconsin | 0.94% |
| Wyoming | -0.47% |
The tables below provide a snapshot of the changes in reconstruction costs for residential buildings in the 3rd quarter.
From Q2 2021 to Q3 2021, the average change for Canadian building materials was an increase of 4.8% over the quarter. For labor, the average wage rate increased 0.2% based on the construction trade contracts that were renewed during the quarter.
CoreLogic monitors a wide variety of construction materials for the residential building industry. A snapshot of some of the most common material elements is listed below:
| Canada | 4Q19 | 1Q20 | 2Q20 | 3Q20 | 4Q20 | 1Q21 | 2Q21 | 3Q21 |
| 1/2″ Drywall | 0.4% | 0.2% | 0.3% | 0.2% | 0.4% | 0.2% | 0.3% | 2.2% |
| Asphalt Shingles | 1.9% | 0.9% | 0.2% | 0.1% | 0.1% | 0.3% | 0.5% | 4.5% |
| Romex Wire | -0.6% | 0.0% | 0.4% | 0.6% | 0.5% | 3.6% | 45.8% | 35.2% |
| 1/2″ Plywood | -2.1% | -1.4% | -1.3% | 1.3% | 30.8% | 2.4% | 62.9% | -4.0% |
| 2×4 Lumber | -2.4% | 0.3% | 2.0% | 3.8% | 62.7% | 1.2% | 47.3% | -16.9% |
| R-13 Fiber Batt Insulation | 2.3% | 2.3% | 1.7% | 2.6% | 1.9% | 1.6% | 4.5% | 4.0% |
| 1/2″ Copper Pipe | 1.4% | 1.7% | 1.2% | 0.4% | 0.4% | 1.1% | 0.9% | 23.2% |
| Ready Mix | 0.8% | 0.7% | 2.1% | 1.5% | 3.0% | 1.7% | 2.5% | 1.6% |
| Felt Paper | 1.5% | 1.2% | 1.1% | 0.6% | 0.4% | 0.6% | 0.8% | 3.8% |
| Province | Quarterly Variance |
| Alberta | 1.77% |
| British Columbia | 0.58% |
| Manitoba | -0.60% |
| New Brunswick | -5.93% |
| Newfoundland | -3.65% |
| Northwest Territory | 3.42% |
| Nova Scotia | -2.60% |
| Ontario | -0.01% |
| Prince Edward Is. | -2.78% |
| Quebec | -0.09% |
| Saskatchewan | -2.74% |
| Yukon Territory | 3.23% |
Note: CoreLogic recommends a full program install whenever possible to ensure use of latest data and program enhancements.
The 4th quarter 2021 cost data update reflects reconstruction cost changes in both labor and material. Standardized costs in this release reflect localized, updated costs representing the impact of emerging markets and economic trends on construction costs.


