| United States | Canada | |||
| Quarter | Year | Quarter | Year | |
| Aluminum Conduit | 2.1% | 4.2% | 0.0% | 1.7% |
| Asphalt Shingles | 0.1% | 1.9% | -0.2% | 0.4% |
| Concrete Block | -0.4% | 1.5% | 0.1% | 1.8% |
| Drywall | -0.1% | 0.4% | 0.4% | 1.1% |
| Felt Paper | 0.1% | 0.9% | 0.4% | 3.0% |
| Galvanized Pipe | 0.0% | 1.4% | 1.5% | 6.3% |
| Lumber | 5.2% | 46.7% | 11.7% | 70.0% |
| Plywood | 5.3% | 35.0% | 11.2% | 32.2% |
| Ready Mix | 0.6% | 3.5% | 2.0% | 8.4% |
| Rebar | 0.6% | 1.0% | 0.2% | -1.2% |
| Steel Deck | 0.6% | 2.1% | 0.4% | 3.7% |
| Steel Stud | 0.4% | 2.5% | 0.4% | 3.0% |
| Structural Steel | 0.6% | 0.0% | 0.3% | 1.4% |
| 1/2″ Copper Pipe | 1.0% | 0.7% | 0.2% | 2.6% |
| National Average | Commercial | Agricultural |
| United States | 1.6% | 1.4% |
| Canada | 1.2% | 1.1% |
| US Quarterly Material Cost Changes | ||||||||||
| 4Q18 | 1Q19 | 2Q19 | 3Q19 | 4Q19 | 1Q20 | 2Q20 | 3Q20 | 4Q20 | 1Q21 | |
| Aluminum Conduit | 1.0 | 1.7 | 1.4 | 0.1 | 0.6 | 0.6 | 1.0 | -1.0 | 2.0 | 2.1 |
| Concrete Block | 0.2 | 0.8 | 1.1 | 0.4 | 0.8 | 1.0 | 0.7 | 0.6 | 0.7 | -0.4 |
| Drywall | 1.2 | -0.3 | -0.1 | 0.3 | 0.7 | -0.5 | -0.1 | 0.0 | 0.7 | -0.1 |
| Galvanized Pipe | 1.9 | 1.9 | 1.1 | 0.8 | 0.5 | 0.5 | 0.5 | 0.6 | 0.3 | 0.0 |
| Ready Mix | 0.1 | 0.3 | 1.6 | 1.5 | 0.9 | 0.7 | 1.0 | 0.2 | 1.7 | 0.6 |
| Rebar | 1.4 | 0.6 | -0.4 | 0.5 | -0.1 | 0.8 | -0.1 | 0.4 | 0.1 | 0.6 |
| Steel Deck | 1.7 | 1.0 | 0.5 | -0.3 | 0.0 | 0.4 | 0.6 | 0.1 | 0.8 | 0.6 |
| Steel Stud | 2.4 | 1.0 | -0.6 | 0.1 | 1.5 | 0.2 | 0.6 | 0.6 | 0.8 | 0.4 |
| Structural Steel | 1.1 | -0.1 | -0.5 | -1.3 | -0.8 | -0.3 | -0.8 | -0.1 | 0.3 | 0.6 |
| ½” Cooper Pipe | -1.1 | -1.0 | 0.1 | -0.3 | -1.4 | -0.4 | -0.4 | -0.3 | 0.3 | 1.0 |
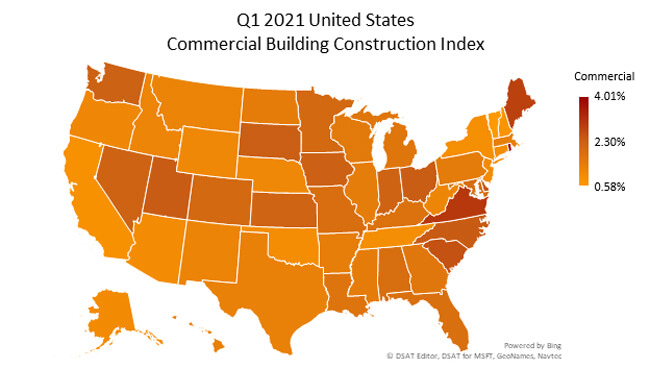
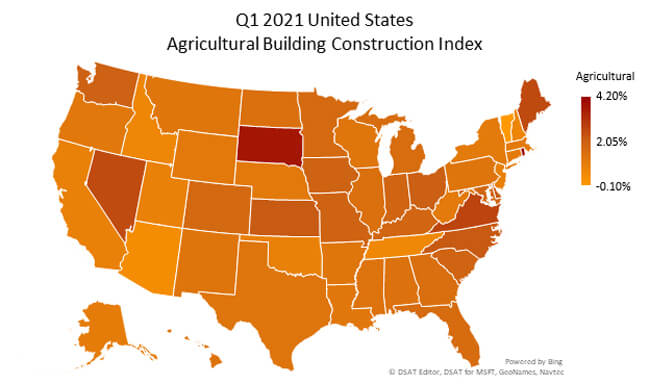
| State | Commercial | Agricultural |
| Alabama | 1.87% | 1.34% |
| Arizona | 0.97% | 0.35% |
| Arkansas | 1.38% | 1.19% |
| California | 0.82% | 0.79% |
| Colorado | 2.01% | 1.69% |
| Connecticut | 0.93% | 1.05% |
| Delaware | 2.46% | 2.10% |
| District Of Columbia | 0.62% | 1.20% |
| Florida | 1.81% | 1.57% |
| Georgia | 1.59% | 1.48% |
| Idaho | 1.17% | 0.60% |
| Illinois | 1.42% | 1.42% |
| Indiana | 2.18% | 1.86% |
| Iowa | 2.24% | 1.93% |
| Kansas | 2.16% | 2.15% |
| Kentucky | 1.75% | 1.80% |
| Louisiana | 1.67% | 1.15% |
| Maine | 2.84% | 2.53% |
| Maryland | 1.90% | 1.82% |
| Massachusetts | 1.34% | 1.05% |
| Michigan | 1.63% | 1.53% |
| Minnesota | 2.00% | 1.67% |
| Mississippi | 1.43% | 1.30% |
| Missouri | 1.86% | 1.90% |
| Montana | 1.21% | 1.19% |
| Nebraska | 1.08% | 1.07% |
| Nevada | 2.20% | 2.51% |
| New Hampshire | 0.73% | 0.63% |
| New Jersey | 1.00% | 0.81% |
| New Mexico | 1.19% | 1.23% |
| New York | 0.88% | 1.03% |
| North Carolina | 2.38% | 2.18% |
| North Dakota | 1.43% | 1.42% |
| Ohio | 2.34% | 2.02% |
| Oklahoma | 0.93% | 0.78% |
| Oregon | 1.10% | 1.12% |
| Pennsylvania | 1.44% | 1.23% |
| Rhode Island | 4.01% | 4.20% |
| South Carolina | 2.53% | 1.87% |
| South Dakota | 2.30% | 3.69% |
| Tennessee | 0.91% | 0.54% |
| Texas | 1.30% | 1.25% |
| Utah | 2.35% | 0.80% |
| Vermont | 0.58% | -0.10% |
| Virginia | 3.00% | 2.67% |
| Washington | 2.23% | 1.96% |
| West Virginia | 1.15% | 1.05% |
| Wisconsin | 1.51% | 1.20% |
| Wyoming | 1.08% | 1.09% |
| Alaska | 0.98% | 0.97% |
| Hawaii | 1.31% | 1.30% |
| Canada Quarterly Material Cost Changes | ||||||||||
| 4Q18 | 1Q19 | 2Q19 | 3Q19 | 4Q19 | 1Q20 | 2Q20 | 3Q20 | 4Q20 | 1Q21 | |
| Aluminum Conduit | -0.5 | 1.6 | 1.8 | 1.9 | 1.5 | 0.8 | 1.1 | 0.1 | 0.6 | 0.0 |
| Concrete Block | 0.7 | 0.3 | 2.1 | 1.1 | 0.7 | 0.7 | 0.4 | 0.1 | 1.1 | 0.1 |
| Drywall | 1.1 | 2.1 | 2.0 | 1.2 | 0.8 | 0.3 | 0.1 | 0.2 | 0.4 | 0.4 |
| Galvanized Pipe | -0.3 | 0.5 | 1.9 | 1.2 | 1.9 | 1.6 | 1.6 | 1.3 | 1.7 | 1.5 |
| Ready Mix | -0.1 | 0.7 | 2.4 | 0.8 | 1.1 | 0.0 | 2.2 | 1.5 | 2.5 | 2.0 |
| Rebar | 1.2 | 0.1 | -0.7 | -1.6 | -1.6 | -0.6 | -1.1 | 0.2 | -0.5 | 0.2 |
| Steel Deck | 0.3 | 0.1 | 1.1 | 0.9 | 0.8 | 1.7 | 0.8 | 1.1 | 1.4 | 0.2 |
| Steel Stud | 2.0 | 2.4 | 2.0 | 1.1 | 0.7 | 0.9 | 0.9 | 1.0 | 0.8 | 0.4 |
| Structural Steel | 0.9 | 0.8 | -0.6 | 0.8 | 0.3 | 0.5 | 0.6 | 0.3 | 0.2 | 0.4 |
| ½” Cooper Pipe | 0.0 | 1.8 | 2.2 | 0.4 | 1.0 | 1.8 | 1.5 | 0.4 | 0.5 | 0.2 |
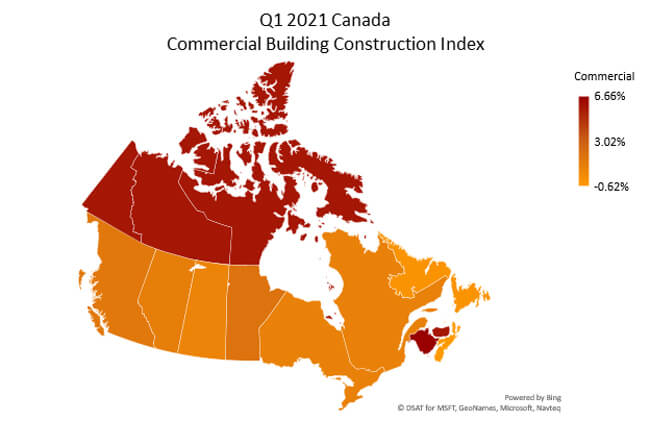
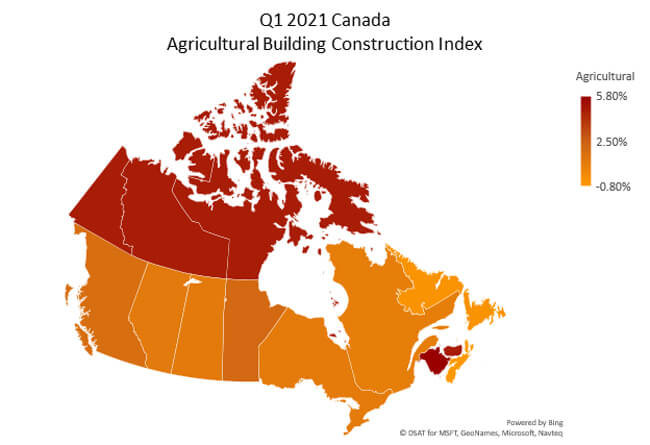
| Province | Commercial | Agriculture |
| Alberta | 1.13% | 1.02% |
| British Columbia | 1.49% | 1.71% |
| Manitoba | 1.81% | 1.98% |
| New Brunswick | 6.66% | 5.80% |
| Nova Scotia | -0.62% | -0.80% |
| Ontario | 0.94% | 0.91% |
| Quebec | 0.94% | 0.76% |
| Saskatchewan | 0.72% | 1.00% |
| Newfoundland & Labrador | 0.25% | -0.46% |
| Prince Edward Island | 5.78% | 4.80% |