Debt-to-Income ratio has risen over the last few years
Whether you are a first-time or seasoned homebuyer, with the joy and excitement of buying a home also generally comes the task of obtaining mortgage finance. However, every year, the dream of becoming a first-time homeowner or trading up may not come true for some buyer wannabees when their mortgage applications are denied. And the burden is often on the borrower to demonstrate adequate financial capacity for affording the new mortgage debt, as well as a good track record of making timely payment on household bills and debt obligations. A good housing market coupled with economic growth will certainly work to the advantage of homebuyers, as stronger household balance sheets, rising income and the likelihood of further home value gains means lower risk in mortgage lending, all else being the same.
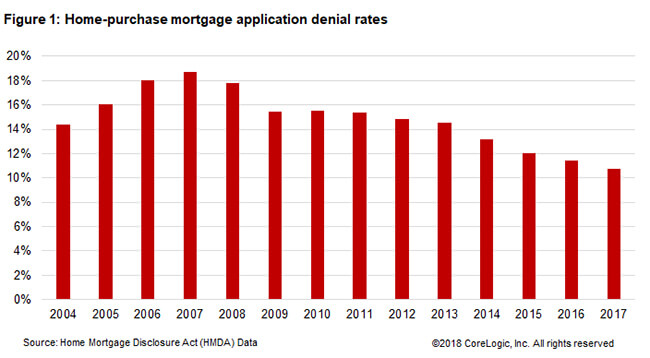
The latest Home Mortgage Disclosure Act (HMDA) data suggests exactly that. The HMDA requires mortgage lenders to disclose the disposition of each mortgage application, along with other information on the loan, property and applicant. Figure 1 shows the percentage of home-purchase first-lien loan applications on one-to-four family units that were denied each year. Denial rates have steadily declined through the housing recovery and a growing economy – and were lower in 2017 than in 2004. In 2017, only about 1-in-10 applications were turned down.
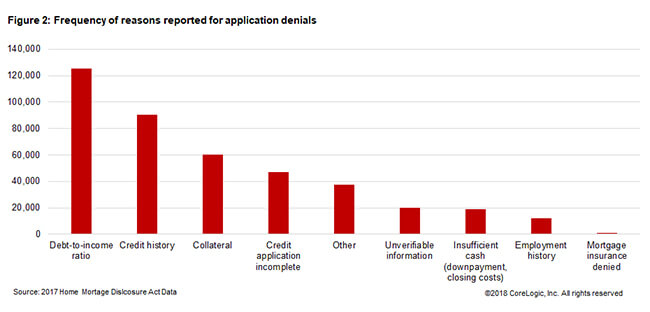
However, the current housing cycle has experienced a constrained supply of starter and lower-end homes, adding to price growth for lower-priced homes with the impact on affordability likely more concentrated on first-time homebuyers and the less affluent.[1] According to the 2017 HMDA data, 30.3% of denied applications attributed “debt-to-income ratio” as the primary reason for mortgage loan denial, up from 28.8% in 2016 and 28.2% in 2015.[2] In fact, since 2015 it has become the number one reason that lenders have turned down purchase-mortgage applications. (In the earlier years of the housing recovery, a poor “credit history” was the number one reason for turning down loan applications.)
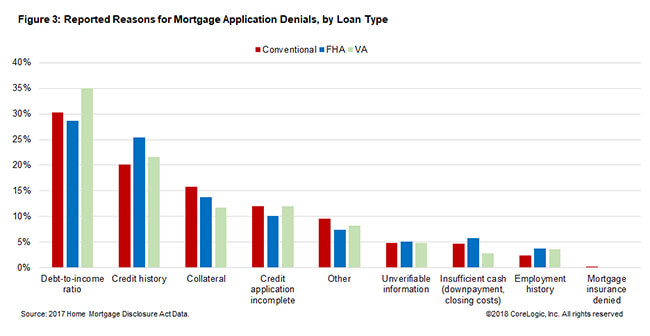
The frequency distribution of denial reasons is reported in Figure 2 for more than 412,000 first-lien purchase-loan applications denied during 2017. When broken down by the loan type (conventional, FHA, and VA), debt-to-income was responsible for 30.2% of the conventional loan denials, 28.6% of the FHA, and 35.0% of the VA. See Figure 3.
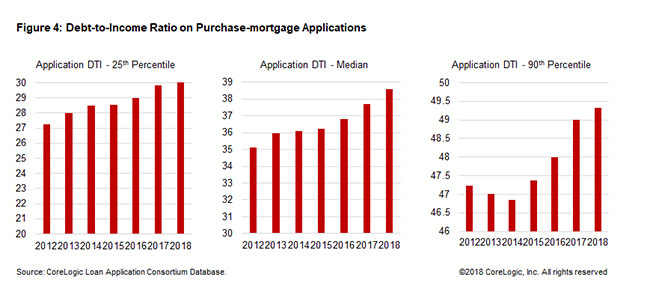
Using CoreLogic’s loan application consortium data, Figure 4 shows the 25th percentile, median, and 90th percentile of purchase applications’ DTI. There has been a gradual, yet steady, rise in DTI, up from 35.1 in 2012 to 37.7 in 2017 and 38.6 in 2018 year-to-date. In 2017, about 25% of applications had a DTI at 30 or lower, while 10% of applications had a DTI of at least 49. Although the final disposition of an application was unknown, a steady DTI uptrend is consistent with rising HMDA loan denials related to the debt-to-income ratio.
Rising application DTI is likely a reflection of the erosion of affordability as home prices have risen much faster relative to wage growth. A typical household’s mortgage payment (principal and interest only), for example, have climbed quickly due to fast-rising home prices and a higher interest rate.[3] In the event of a negative income shock, higher DTI loans are at a greater risk of default.
HMDA data provides the most comprehensive application-level information and visibility into the demand (i.e., mortgage applications) and supply (i.e., loans approved and originated) of the residential mortgage market. Application denial rates are useful in understanding the existing gap between the demand and supply of housing credit, and for policy deliberations on homeownership affordability and housing credit access.
[1] For more insights on housing affordability and its outlook, please visit CoreLogic Insights Blog: “Peering Into 2018: The Outlook for U.S. Housing Market – Erosion of Housing Affordability Likely to Spread to More Markets.”
[2] The HMDA data used for the analysis is based on the dynamic loan application register (LAR) files, accessed on September 17, 2018. Applications include those on 1-4 unit single family (excluding manufactured homes), first-lien, and owner-occupied.
[3] The latest analysis by CoreLogic shows the principal-and-interest payment on the median home has risen by 14% over a year ago.
© 2018 CoreLogic, Inc. All rights reserved