Chat
Chat with Sales Hours: Monday-Friday 8:30 a.m. - 4:30 p.m. (CST)
Contact Sales
Call Sales Toll-Free 1-(866) 774-3282 Hours: Monday-Friday 7 a.m. - 5 p.m. (CST)
Product Login
Product Log-in
Product Support
Product Support
Email Sales
Contact Sales
After Hours
  • Support
  • Sign In Sign In
  • AUS NZ UK
CoreLogic - Home
  • Solutions
    view solutions by:

    Data Solutions

    • Lead Generation
    • Property Data
    • Location Intelligence

    Real Estate

    • Multiple Listing Enterprise
    • Agent & Broker

    Mortgage

    • Origination
    • Servicing
    • Appraisal
    • Commercial Property Tax

    Insurance

    • Hazard Risk
    • Catastrophe Risk Management
    • Risk Evaluation
    • Underwriting Automation
    • Weather
    • Claims Automation
    • Restoration
    • INTRCONNECT

    Mortgage Lenders

    • Origination

    Mortgage Servicers

    • Residential Property Tax
    • Default & Loss Mitigation
    • Portfolio Insight & Monitoring

    Mortgage Appraisers

    • Appraisal

    Real Estate Agents & Brokers

    • Agents & Brokers

    Real Estate MLS

    • Multiple Listing Enterprises

    Commercial Real Estate Owners

    • Commercial Property Tax

    Marketing Departments

    • Property Data

    Insurance Underwriters

    • Risk Evaluation
    • Underwriting Automation
    • Hazard Risk
    • Catastrophe Risk Management

    Insurance Risk Managers

    • Risk Evaluation
    • Hazard Risk
    • Catastrophe Risk Management

    Insurance Claims

    • Claims Automation
    • Restoration Contractors
    • Weather Verification

    Construction Contractors

    • Restoration Contractors

    General

    • Location Intelligence
    • Lead Generation
    • Data Solutions
  • Resources

    Reports

    • Climate Change
    • Construction Cost Update
    • Construction Insights
    • Home Price Insights
    • Homeowner Equity Insights
    • Loan Performance Insight
    • Mortgage Fraud
    • Property Tax Delinquency
    • Single-Family Rent Index

    Insight Blogs

    • Hazard HQ
    • Office of Chief Economist
    • Affordable Housing
    • Homebuying
    • Insurance
    • Other Articles

    More Resources

    • Events
    • Case Studies
    • White Papers
    • Podcasts
    • Quick Takes
  • Company
    • About
    • Leadership
    • Newsroom
    • Contact
    • Careers
  • Search
CoreLogic - Home
  • Solutions
  • Resources
  • Company

    • About
    • Leadership
    • Newsroom
    • Contact
    • Careers
  • Accounts

    • Products Sign-in
  • Contact

    • Sales Contact
    • Product Support
  • Regions

    • Australia
    • New Zealand
    • United Kingdom
  • Social

    • Facebook
    • Instagram
    • Linkedin
    • Twitter
    • Youtube
Solutions
VIEW BY:
  • Data Solutions

    • Lead Generation
    • Property Data
    • Location Intelligence
  • Real Estate

    • Multiple Listing Enterprise
    • Agent & Broker
  • Mortgage

    • Origination
    • Servicing
    • Appraisal
    • Commercial Property Tax
  • Insurance

    • Hazard Risk
    • Catastrophe Risk Management
    • Risk Evaluation
    • Underwriting Automation
    • Weather
    • Claims Automation
    • Restoration
    • INTRCONNECT
  • Mortgage Lenders

    • Origination
  • Mortgage Servicers

    • Residential Property Tax
    • Default & Loss Mitigation
    • Portfolio Insight & Monitoring
  • Mortgage Appraisers

    • Appraisal
  • Real Estate Agents & Brokers

    • Agents & Brokers
  • Real Estate MLS

    • Multiple Listing Enterprises
  • Commercial Real Estate Owners

    • Commercial Property Tax
  • Marketing Departments

    • Property Data
  • Insurance Underwriters

    • Risk Evaluation
    • Underwriting Automation
    • Hazard Risk
    • Catastrophe Risk Management
  • Insurance Risk Managers

    • Risk Evaluation
    • Hazard Risk
    • Catastrophe Risk Management
  • Insurance Claims

    • Claims Automation
    • Restoration Contractors
    • Weather Verification
  • Construction Contractors

    • Restoration Contractors
  • General

    • Location Intelligence
    • Lead Generation
    • Data Solutions
Resources
  • Reports

    • Climate Change
    • Construction Cost Update
    • Construction Insights
    • Home Price Insights
    • Homeowner Equity Insights
    • Loan Performance Insight
    • Mortgage Fraud
    • Property Tax Delinquency
    • Single-Family Rent Index
  • Insight Blogs

    • Hazard HQ
    • Office of Chief Economist
    • Affordable Housing
    • Homebuying
    • Insurance
    • Other Articles
  • More Resources

    • Events
    • Case Studies
    • White Papers
    • Podcasts
    • Quick Takes

Home / Intelligence / Did Investors Try to Cash in on Amazon’s HQ2 Announcement?

ABOUT THE AUTHOR
Thomas Malone
Thomas Malone
Professional, Economist
View Profile
  • May 25, 2021

Did Investors Try to Cash in on Amazon’s HQ2 Announcement?

In November 2018, Amazon surprisingly announced that it would be developing its second headquarters in not one but two locations: Crystal City, Virginia, and Long Island City, New York. However, in February 2019, Amazon pulled back from its plans in New York and pushed ahead with locating HQ2 solely in Virginia. It is currently in the early stages, having broken ground last year, with plans to complete construction in 2025.

CoreLogic previously covered how this has affected home prices in the Washington, D.C., area and found some preliminary evidence that HQ2 had driven up prices in the surrounding area. An interesting corollary is whether investors have tried to take advantage of the forthcoming influx of workers and increase their activity in the area.

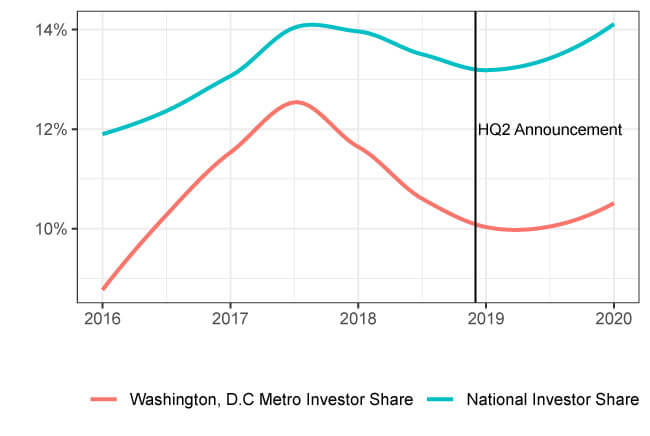
Washington, D.C., as a whole experienced no notable uptick in prices or investor activity around the time of the Amazon announcement in November. Figure 1 shows the trends for national investor shares of purchases compared to just the Washington, D.C., metropolitan area.[1] The vertical black line shows the timing of the HQ2 announcement. Both lines show a downturn at the time of the announcement of the headquarters. The district’s metro series may seem exaggerated compared with the national trend, but this is not notably different from average metro to metro variation around the national trend.

Figure 1: Share of Single-family Purchases Made by Investors Nationwide and in Washington, D.C. (2016-2020)

However, Washington, D.C., is a big metropolitan area. It is possible that Amazon’s effect was more localized to areas nearby Crystal City. Figure 2 investigates this by looking at the trend in investor activity in 2-mile rings surrounding the HQ2 site. The vertical black line indicates when Amazon made the HQ2 announcement. There is clear evidence of a rise in investor activity at the time of the decision.

Figure 2: Share of Single-family Purchases Made by Investors by Distance from HQ2 Site (2016-2020)

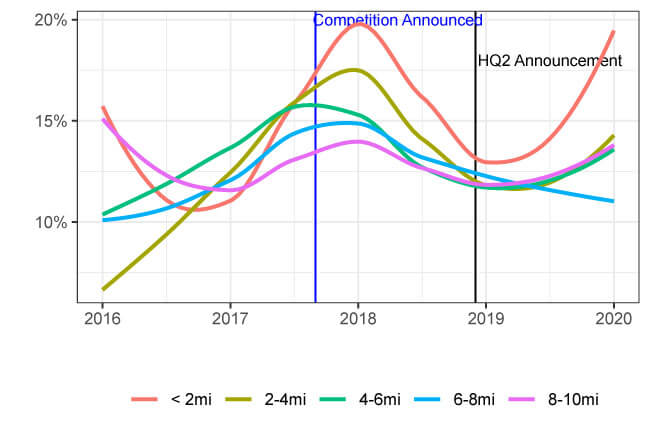
Looking to the right of the black line, the red curve increases sharply, indicating that investor purchases in the area closest to HQ2 (within 2 miles) shot up after the announcement while the other areas lagged. This is notably different from the earlier uptick in the figure, shown around September 2017, when Amazon announced that cities could place bids (as shown by the vertical blue line), in that the gold curve (homes located 2 to 4 miles from the HQ2 site) had a similar increase.  

The spike around the blue line could be taken as evidence against the effect of Amazon, but this is unclear. Investors, after all, are forward looking. They invest not necessarily where there is rental growth currently, but where they anticipate there will be growth in the future. The Northern Virginia section of the Washington, D.C., metro was highly touted as a potential destination even prior to being placed on the shortlist, so some of this investment activity could have been speculative. This may explain why near the competition announcement, the uptick is noticeable in the area within four miles, but after the announcement it is restricted to the area within two miles. The second time around, investors had more precise information with which to act.

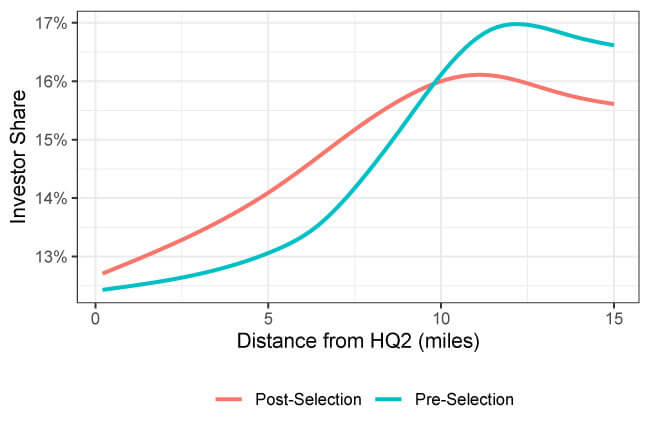
An alternative way to look at this is to see how the investor rate changes as we move away from the HQ2 at different dates. Figure 3 examines the connection between a home sales’ proximity to the HQ2 site and the probability that it was an investor purchase in the 12 months before the announcement (the blue curve) and 12 months after (the red curve).[2] Note that the slope of the post-selection curve is flatter and above the pre-selection curve within 10 miles from HQ2.  Figure 3, in conjunction with Figure 2, displays a reorientation of investor activity in the Washington, D.C., metro area towards Crystal City because of the new headquarters.

Figure 3: Probability That Single-family Purchase was by an Investor by Distance from HQ2 Location

Of course, none of this indicates a causal connection. Movements in the real estate markets are determined by powerful macroeconomic and demographic movements that express themselves differently across time and space depending on local conditions.

We can’t conclusively say the HQ2 announcement is behind any of these trends. Still, the movements in investor activity around HQ2 are suggestive. It appears the announcement may have been followed by an uptick that is only perceptible close to the location. The evidence at the metropolitan level is less compelling, and if Amazon has had an effect, it’s likely that it was to redirect investor purchases within Washington, D.C., rather than raise them overall.

Interestingly, this activity started not at the time of the announcement, but instead around the time that the HQ2 competition was announced. Regardless of whether Amazon was what brought them there, those investors who were a part of the bump in activity around Crystal City prior to the final announcement seem to have made a gamble that paid off.

©2021 CoreLogic, Inc. All rights reserved.

[1] Investor share is defined as the number of single-family purchases by investors in an area divided by the total number of single-family purchases. Investors are defined as any owner retaining three or more properties at the same time during an interval over a 10-year period, whether an individual or a company.

[2] Probability is calculated by running a local-linear regression of a variable that takes the value 1 if a purchase by an investor and 0 otherwise on the distance that purchase was from HQ2.

  • Category: Blogs, Intelligence, Office of the Chief Economist
  • Tags: Affordability, Real Estate
ABOUT THE AUTHOR
Thomas Malone
Thomas Malone
Professional, Economist
View Profile

Related Posts

Tornado footprints in Southern California captured by CoreLogic's weather verification technology as viewed in CoreLogic Reactor™.
Blogs

A Rare Los Angeles Tornado and Near Hurricane-Force Winds in San Francisco

CoreLogic Weather Verification Services captured wind and tornado footprints from the severe weather system in California.

March 24, 2023
atmospheric rivers california
Core Conversations

What Was it Really Like to Live Through the California Floods? Our Team Spills

A Conversation With Kent David and Tom Larsen Since the beginning of the year, California has been drenched by atmospheric rivers. The flooding in California

March 22, 2023
Ecuador earthquake
Blogs

M6.8 Earthquake Near the Coast of Ecuador

CoreLogic estimates that insurable losses from the Ecuador earthquake will be up to $600 million.

March 21, 2023

About Corelogic

  • Newsroom
  • Leadership
  • Careers
  • Ethics & Compliance

Accounts

  • Products Sign-in

Contact

  • Sales Contact
  • Product Support

Regions

  • CoreLogic Australia
  • CoreLogic New Zealand
  • CoreLogic UK

Follow & Connect

  • Facebook
  • Instagram
  • Linkedin
  • Twitter
  • YouTube
© 2023 CoreLogic. All rights reserved.
  • Legal
  • Privacy Policy
  • CCPA
  • Cookie Preferences
  • Security
  • Sitemap
  • Accessibility
  • Legal
  • Privacy Policy
  • CCPA
  • Cookie Preferences
  • Security
  • Sitemap
  • Accessibility