Evidence from Mortgage Loans originated during 2018-2020
Since March 2020, the COVID relief program under the CARES Act allowed millions of homeowners to temporarily pause or reduce their mortgage payments.[1] However, for many of these homeowners, the forbearance plans already expired or are expiring soon. The maximum forbearance period was 18 months for most of the programs. Thus, a loan that entered forbearance during April 2020 would have had to exit forbearance no later than October 2021. According to the Mortgage Bankers Association (MBA), the share of mortgage loans in forbearance decreased to 1.41% in December 2021, a drop of 26 basis points from 1.67% in the prior month.
The CoreLogic data shows that the forbearance rates were higher for higher-priced loans.[2] In this blog, we examine the forbearance rate by APR (Annual Percentage Rate) and Average Prime Offer Rate (APOR) spread for all conventional loans. APOR is a weekly market index of the average loan APRs offered by a selection of lenders across several mortgage products offered to highly qualified borrowers.[3] The difference between a loan’s APR and the APOR is referred to as the “rate spread.” In general, loans with a rate spread of 1.5 percentage points or more are considered higher-priced loans.
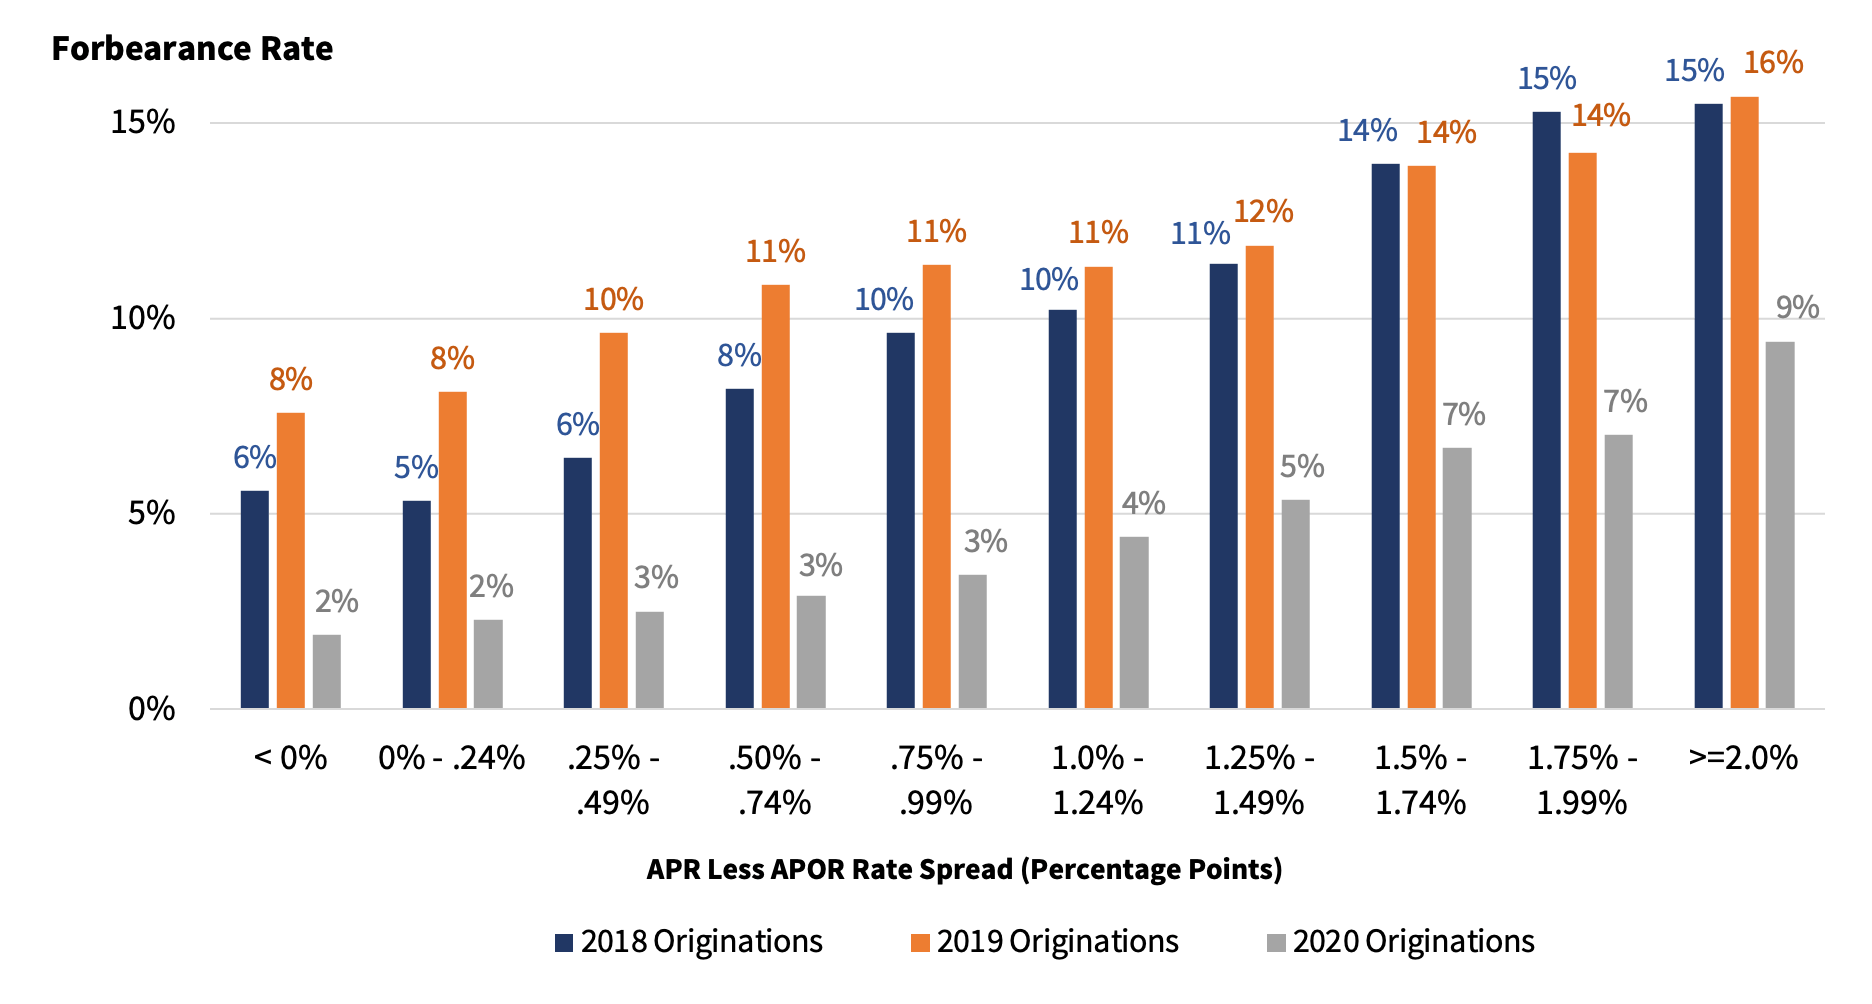
As forbearance and delinquency are highly correlated, the finding is consistent with our prior analysis. Our previous analysis had shown that loan delinquency increased as rate spread increased. Figure 1 displays forbearance rates for conventional loans for vintage years 2018-2020.[4] The forbearance rates in the figure are displayed by rate spread category, in increments of 0.25 percentage points. The figure shows that the forbearance rate was lowest for loans with a rate spread of 0% – 0.25% and highest for the loans with rate spreads above 2%, based on servicing data through November 2021. There were notable increases in forbearance as rate spreads increased. Especially, the variation in forbearance rates is depicted between the loans with 1.25% – 1.49% and 1.50% – 1.74% rate spread categories. The forbearance rate for loans with 1.50% – 1.74% rate spread is higher by 2 to 3 percentage points than the loans with 1.25% – 1.49% rate spread.
Figure 1: Forbearance Rate by Spread Above APOR and Vintage: Conventional Loans Active as of November 31, 2021
Cumulative forbearance rates of 9%, 8%, and 2% for vintage year 2018, 2019 and 2020, respectively[5]

Higher-priced loans were more likely to experience forbearance than lower rate spread loans in this analysis. However, not all forbearance loans are in some form of delinquency. About 54% of the homeowners with conventional loans in active forbearance plans in November 2021 were current on their mortgage payments. Some homeowners may have applied for forbearance in case their financial hardship worsened even though they were able to remain current in their payments.
A surge in foreclosures as the forbearance plan ends is unlikely. As reported by CoreLogic, the foreclosure inventory rate was at a 22-and-a-half-year low of 0.2% in October 2021, down from 0.3% in October 2020.[6] The very rapid home price appreciation in 2020 – 2021 has boosted home equity. Record levels of home equity will help limit the number of homeowners that experience foreclosure.
[1] The Coronavirus Aid, Relief, and Economic Security (CARES) Act was signed into law March 27, 2020, and its forbearance provisions cover the federally backed mortgage lending programs (Fannie Mae, Freddie Mac, FHA, VA, RHS). A borrower with a federally backed mortgage loan experiencing a financial hardship due to the COVID–19 emergency may request forbearance; forbearance shall be granted for up to 180 days and shall be extended for an additional period of up to 180 days at the request of the borrower. Homeowner’s credit score will not be impacted during the forbearance period despite the missed/late payments. Federal regulators extended the forbearance period to a maximum of 18 months.
[2] CoreLogic Loan-Level Market Analytics (LLMA) data was merged with 2018-2020 HMDA data by employing a unique matching technique that linked LLMA loan performance data to HMDA origination data. The match was based on loan characteristics, such as the loan amount, the loan purpose, the loan type, census tract, origination year, and the lender identity key. The overall match rate was about 50% of the LLMA data. Forbearance status of loans were tracked up to the month of November 2021. We include both purchase and refinance loans in our analysis to provide a comprehensive review. Rate spread below 1.5% was not provided in HMDA data prior to 2018. Thus, we just include loans originated in 2018-2020.
[3] See CFPB website What is a “higher-priced mortgage loan?” | Consumer Financial Protection Bureau (consumerfinance.gov)
[4] Forbearance rate is the percent of active loans in November 2021 that had been in forbearance at some point (even if current in November 2021), out of the total number of loans originated for that vintage year, including those that had been paid off.
[5] Cumulative forbearance rate is the forbearance rate for all conventional loans by vintage year. The forbearance rates were much lower for the 2020 vintage as the loan applicants who were approved for a mortgage loan after March 2020 had not lost their job or business because of the pandemic. They still had a stable job and sufficient income to be approved.
[6] The foreclosure inventory rate is the share of mortgages in some stage of the foreclosure process.


