An analysis of CoreLogic data finds an extra 2.2% per year in neighborhood price appreciation
It has been more than three years since the Tax Cuts and Jobs Act of 2017 created a provision, known as qualified opportunity zones, to focus on the rejuvenation of economically distressed communities across the U.S. and its territories. The place-based community development program was created to help economically disadvantaged communities by encouraging private capital investment and job creations through the use of tax incentives. An August 2020 progress report from the White House Council of Economic Advisors (CEA) highlighted that opportunity zones investment has created at least 500,000 new jobs and attracted $75 billion capital investment as of the end of 2019.
The CEA report also indicates that nearly one half of the opportunity zones investments are focused on real estate projects and development. How has the influx of capital affected real estate prices, especially residential home prices, as neighborhoods in opportunity zones become more attractive to investors and residents alike? Using the extensive public records database from CoreLogic, a new study has shed light on the impact of the community development program on local home prices.
A quick rundown on opportunity zones
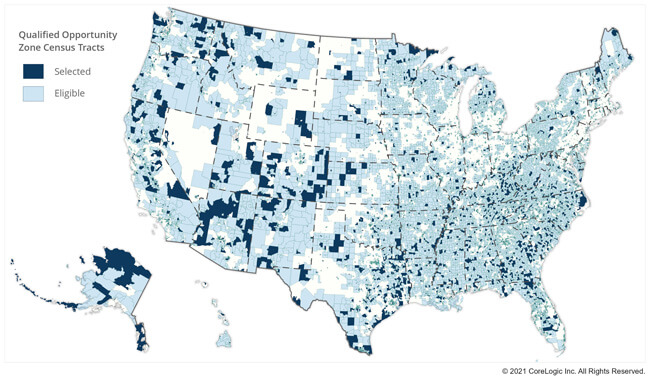
The opportunity zones provision of the 2017 Tax Cuts and Jobs Act, signed into law on December 27, 2017, by President Trump, was created to incentivize capital influx into distressed, low-income communities that could lead to new development, jobs and economic opportunities for the residents in the community. Under the program, low-income communities with a household poverty rate greater than 20%, or median family income below 80% of metropolitan area median family income (or below 80% of the state median family if in non-metropolitan areas) were eligible for consideration as opportunity zones. Between April and June 2018, of more than 42,170 census tracts that were eligible for the program, 8,762 communities (representing 12% of all census tracts across the U.S. and its territories) were designated as opportunity zones by the Department of Treasury, as shown in Figure 1. These tracts are generally low-income communities (LICs).
Figure 1: Opportunity Zone Areas
For investors, opportunity zones provide increasing tax benefits for capital gains invested into qualified opportunity funds if held for longer investment horizons. As a start, investors can defer the taxes on initial invested capital gains until 2026 or when the investment is sold, whichever is earlier. To encourage long-term community ownership, there is step-up in basis of 10% on the original investment if held for five years and an additional 15% if held for seven years. For investment of 10 or more years, investment capital gains are not subject to any capital gains tax.
Sizing the impact on property prices
Nearly one half of qualified opportunity funds are focused on real estate projects and development.[1] With a substantial amount of capital pursuing real estate, it is expected that this significant demand can lead to rising property prices. Assessments of the impact on commercial property sales (including apartments, office, industrial, and retail) found that these transactions have capitalized on potential tax benefits by carrying a 14%-20% price premium.[2]
The impact on single-family home prices, however, remains less accurately quantified. A prior analysis by researchers at Harvard University concluded that by the end of 2019 the opportunity zones impact on neighborhood home prices has been mostly nonexistent, although when the data was later expanded through the first half of 2020 by the White House CEA, the estimation was revised upward to an annual price impact of 0.53% through 2019.[3] Arguably, despite the rigor in the methodology employed by the Harvard researchers, the study did not directly measure actual sales prices or their changes at the property level but used aggregate home price index instead to proxy home price growth.
A new study: opportunity zones led to an extra 2.2% per year in neighborhood home price appreciation
Utilizing the CoreLogic extensive public records database on property transactions across the entire U.S., a study conducted by researchers at CoreLogic and San Diego State University concluded that the community development program has had a much larger impact on neighborhood home prices than previously reported.
The study uses public-record property transactions across all opportunity zones encompassing a six-year period from 2015 through 2020 to conduct a more comprehensive evaluation of changing prices surrounding the policy initiative. And to better isolate home price appreciation rates accruing exclusively to the designation of opportunity zones, the study employs extensive controls of other confounding factors such as observable property characteristics (property age, gross living areas, lot size and the number of bedrooms and bathrooms) and general market spillovers from broader metropolitan statistical areas or statewide— which can influence home prices.
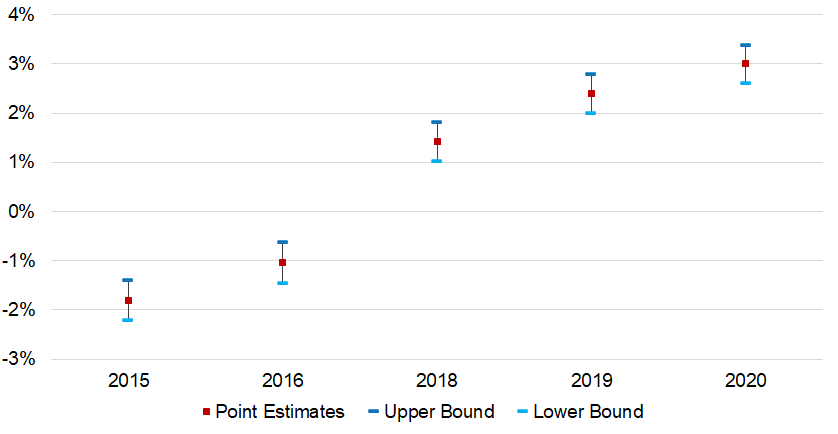
Figure 2: Before and After the Tax Cuts and Jobs Act of 2017 – Differences in Home Price Growth Between Opportunity Zones and Eligible-but-not-Selected Tracts
on Single-Family House Prices Y.G. Mayer
and E.F. Pierzak, working paper, May 2021.
Prior to becoming opportunity zones, the home price growth in the low-income communities trailed behind their counterparts that were eligible but not selected (a.k.a., the control group) by approximately 1.8% in 2015 and 1.0% in 2016. Following the designation, opportunity zones outperformed the control group and led in additional home price appreciation by 1.4% in 2018, 2.4% in 2019, and 3.0% in 2020.
With 2017 being treated as year zero or the base year, another way to interpret these findings is that home prices in opportunity zones out-strengthened their counterparts by 1.4% in one year after the passage of the 2017 Tax Cuts and Jobs Act, by 3.8% in two years at the end of 2019, and by 6.8% in three years at the end of 2020. So cumulatively, opportunity zones have experienced a total of 6.8% excess home price appreciation in the three years after the designation, averaging 2.2% annually — while the range of the impact is likely between 1.8%-2.5% per year. The modest “discounts” before the opportunity zones provision, and moderate “premiums” after the provision suggest that the policy has had an economically meaningful impact on opportunity zones’ single-family house prices.
Contributors: Yanling Mayer, Denise Moore
©2021 CoreLogic, Inc., All right reserved.
[1] “The Impact of Opportunity Zones: An Initial Assessment,” The Council of Economic Advisors, August 2020.
[2]. “Where is the Opportunity in Opportunity Zones? Early Indicators of Opportunity Zone Program’s Impact on Commercial Property Prices,” A. Sage, M. Langen, and A. van de Minne, Real Estate eJournal, June 7, 2019.
“Who Gains from Place-Based Tax Incentives? Exploring Apartment Sales Prices in Qualified Opportunity Zones,” E.F. Pierzak, Journal of Portfolio Management, In press.
[3] “The (Non-)Effect of Opportunity Zones on Housing Prices,” by J. Chen, E.L. Glaeser, and D. Wessel, July 2020.
“The Impact of Opportunity Zones: An Initial Assessment,” The Council of Economic Advisors, August 2020