Chat
Chat with Sales Hours: Monday-Friday 8:30 a.m. - 4:30 p.m. (CST)
Contact Sales
Call Sales Toll-Free 1-(866) 774-3282 Hours: Monday-Friday 7 a.m. - 5 p.m. (CST)
Product Login
Product Log-in
Product Support
Product Support
Email Sales
Contact Sales
After Hours
  • Support
  • Sign In Sign In
  • AUS NZ UK
CoreLogic - Home
  • Solutions
    view solutions by:

    Data Solutions

    • Lead Generation
    • Property Data
    • Location Intelligence

    Real Estate

    • Multiple Listing Enterprise
    • Agent & Broker

    Mortgage

    • Origination
    • Servicing
    • Appraisal
    • Commercial Property Tax

    Insurance

    • Hazard Risk
    • Catastrophe Risk Management
    • Risk Evaluation
    • Underwriting Automation
    • Weather
    • Claims Automation
    • Restoration
    • INTRCONNECT

    Mortgage Lenders

    • Origination

    Mortgage Servicers

    • Residential Property Tax
    • Default & Loss Mitigation
    • Portfolio Insight & Monitoring

    Mortgage Appraisers

    • Appraisal

    Real Estate Agents & Brokers

    • Agents & Brokers

    Real Estate MLS

    • Multiple Listing Enterprises

    Commercial Real Estate Owners

    • Commercial Property Tax

    Marketing Departments

    • Property Data

    Insurance Underwriters

    • Risk Evaluation
    • Underwriting Automation
    • Hazard Risk
    • Catastrophe Risk Management

    Insurance Risk Managers

    • Risk Evaluation
    • Hazard Risk
    • Catastrophe Risk Management

    Insurance Claims

    • Claims Automation
    • Restoration Contractors
    • Weather Verification

    Construction Contractors

    • Restoration Contractors

    General

    • Location Intelligence
    • Lead Generation
    • Data Solutions
  • Resources

    Reports

    • Climate Change
    • Construction Cost Update
    • Construction Insights
    • Home Price Insights
    • Homeowner Equity Insights
    • Loan Performance Insight
    • Mortgage Fraud
    • Property Tax Delinquency
    • Single-Family Rent Index

    Insight Blogs

    • Hazard HQ
    • Office of Chief Economist
    • Affordable Housing
    • Homebuying
    • Insurance
    • Other Articles

    More Resources

    • Events
    • Case Studies
    • White Papers
    • Podcasts
    • Quick Takes
  • Company
    • About
    • Leadership
    • Newsroom
    • Contact
    • Careers
  • Search
CoreLogic - Home
  • Solutions
  • Resources
  • Company

    • About
    • Leadership
    • Newsroom
    • Contact
    • Careers
  • Accounts

    • Products Sign-in
  • Contact

    • Sales Contact
    • Product Support
  • Regions

    • Australia
    • New Zealand
    • United Kingdom
  • Social

    • Facebook
    • Instagram
    • Linkedin
    • Twitter
    • Youtube
Solutions
VIEW BY:
  • Data Solutions

    • Lead Generation
    • Property Data
    • Location Intelligence
  • Real Estate

    • Multiple Listing Enterprise
    • Agent & Broker
  • Mortgage

    • Origination
    • Servicing
    • Appraisal
    • Commercial Property Tax
  • Insurance

    • Hazard Risk
    • Catastrophe Risk Management
    • Risk Evaluation
    • Underwriting Automation
    • Weather
    • Claims Automation
    • Restoration
    • INTRCONNECT
  • Mortgage Lenders

    • Origination
  • Mortgage Servicers

    • Residential Property Tax
    • Default & Loss Mitigation
    • Portfolio Insight & Monitoring
  • Mortgage Appraisers

    • Appraisal
  • Real Estate Agents & Brokers

    • Agents & Brokers
  • Real Estate MLS

    • Multiple Listing Enterprises
  • Commercial Real Estate Owners

    • Commercial Property Tax
  • Marketing Departments

    • Property Data
  • Insurance Underwriters

    • Risk Evaluation
    • Underwriting Automation
    • Hazard Risk
    • Catastrophe Risk Management
  • Insurance Risk Managers

    • Risk Evaluation
    • Hazard Risk
    • Catastrophe Risk Management
  • Insurance Claims

    • Claims Automation
    • Restoration Contractors
    • Weather Verification
  • Construction Contractors

    • Restoration Contractors
  • General

    • Location Intelligence
    • Lead Generation
    • Data Solutions
Resources
  • Reports

    • Climate Change
    • Construction Cost Update
    • Construction Insights
    • Home Price Insights
    • Homeowner Equity Insights
    • Loan Performance Insight
    • Mortgage Fraud
    • Property Tax Delinquency
    • Single-Family Rent Index
  • Insight Blogs

    • Hazard HQ
    • Office of Chief Economist
    • Affordable Housing
    • Homebuying
    • Insurance
    • Other Articles
  • More Resources

    • Events
    • Case Studies
    • White Papers
    • Podcasts
    • Quick Takes

Home / Intelligence / The Housing Price Gap Is Converging for the First Time in a Decade

ABOUT THE AUTHOR
Thomas Malone
Thomas Malone
Professional, Economist
View Profile
  • February 16, 2023

The Housing Price Gap Is Converging for the First Time in a Decade

Housing price declines are concentrated in higher-priced areas and are causing U.S. price levels to move closer together

Quick Takes:

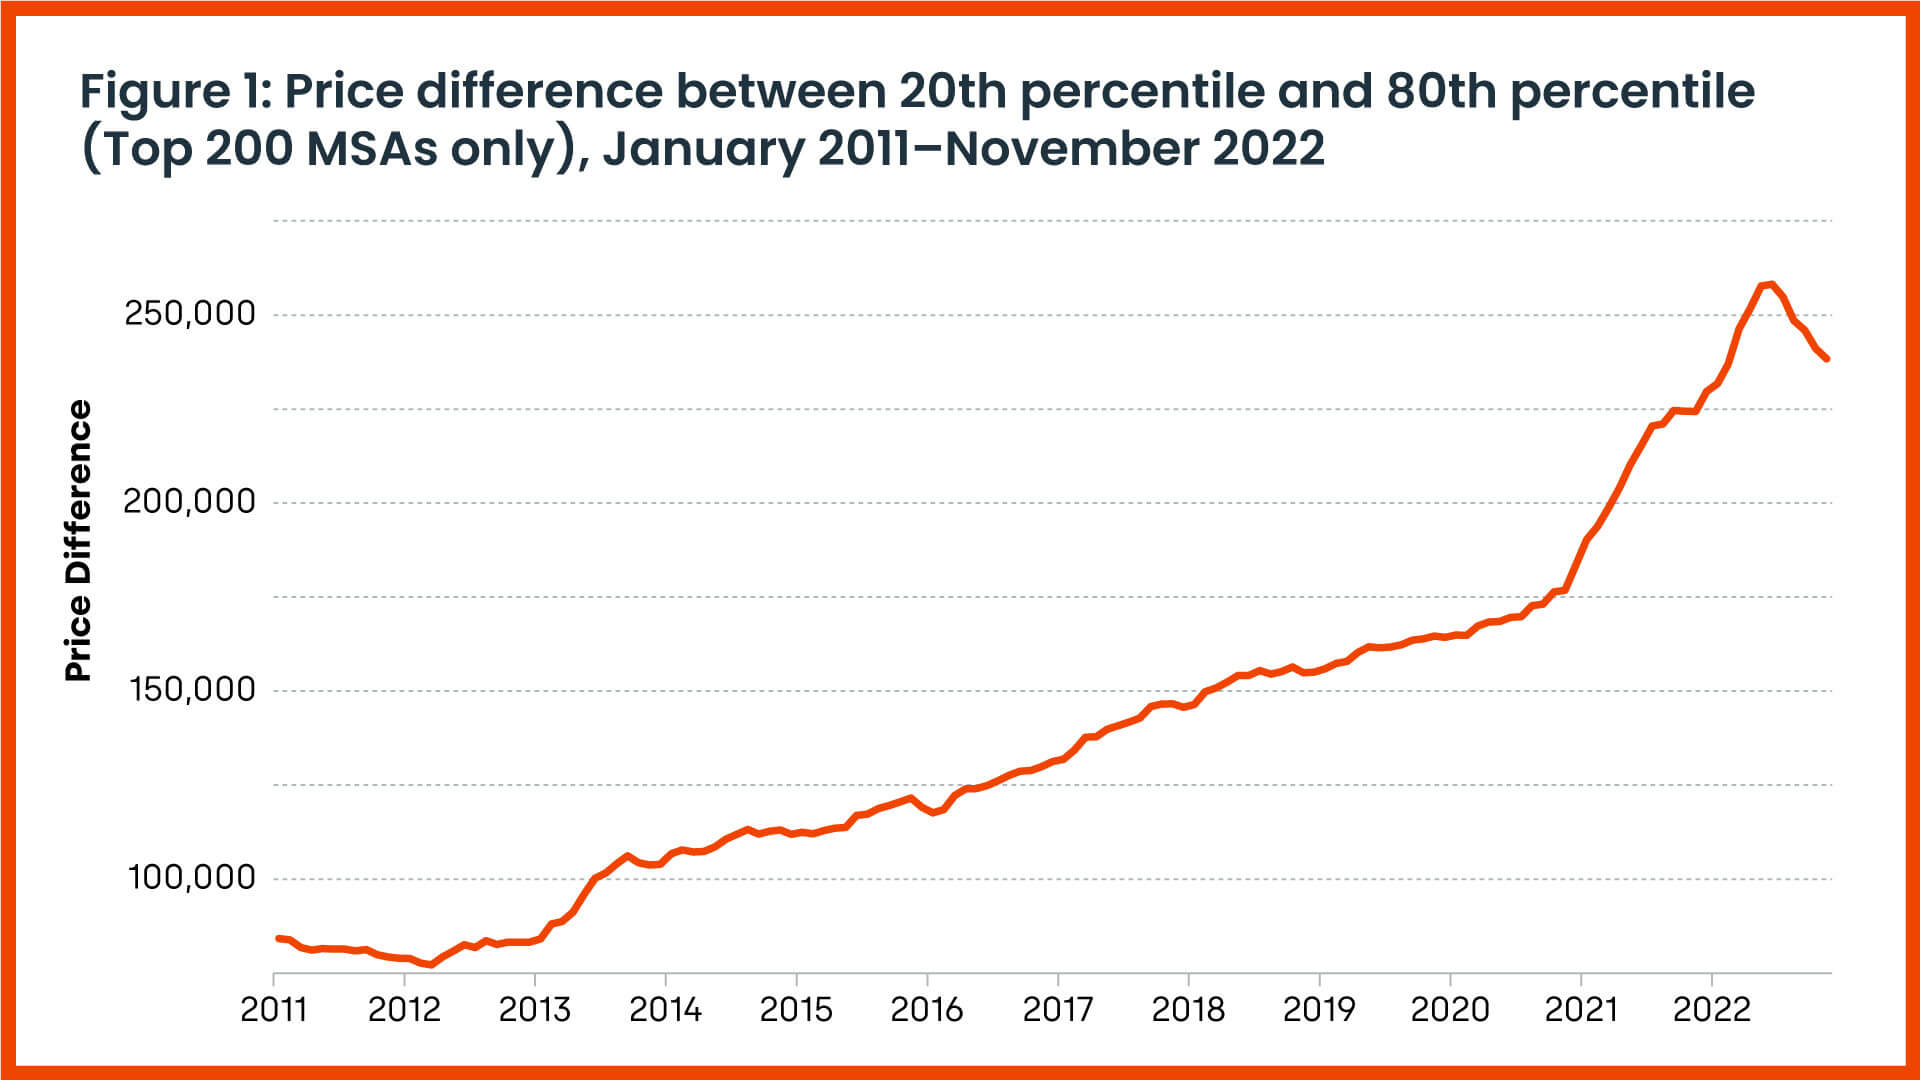
  • In November 2022, the regional price differences between median housing prices[1] in the 20th and 80th percentile shrunk by 11.2% from the peak in July 2022.
  • This is the first time the price spread has converged since the housing crisis ended in July 2012.
  • Midpriced metro areas saw the largest home price increases since 2020, but in real dollar terms, several California metropolitan statistical areas (MSA) entered the top 10 most-expensive areas in the country.

Housing prices have increased for over a decade. Following the fallout from the 2000s housing crisis, which ended in July 2012, home prices have posted year-over-year increases every month. As prices appreciated, the spread in housing costs across the country grew further apart.

This level of dispersion hit an all-time high in July 2022, when the difference between the 40th most-expensive MSA and the 160th most-expensive MSA was $268,000. Since then, the home price spread between these two cities has shrunk to $238,000[2]. Figure 1 shows the path of this price range and makes it clear that the housing price spread rises when home prices appreciate and falls when they depreciate.

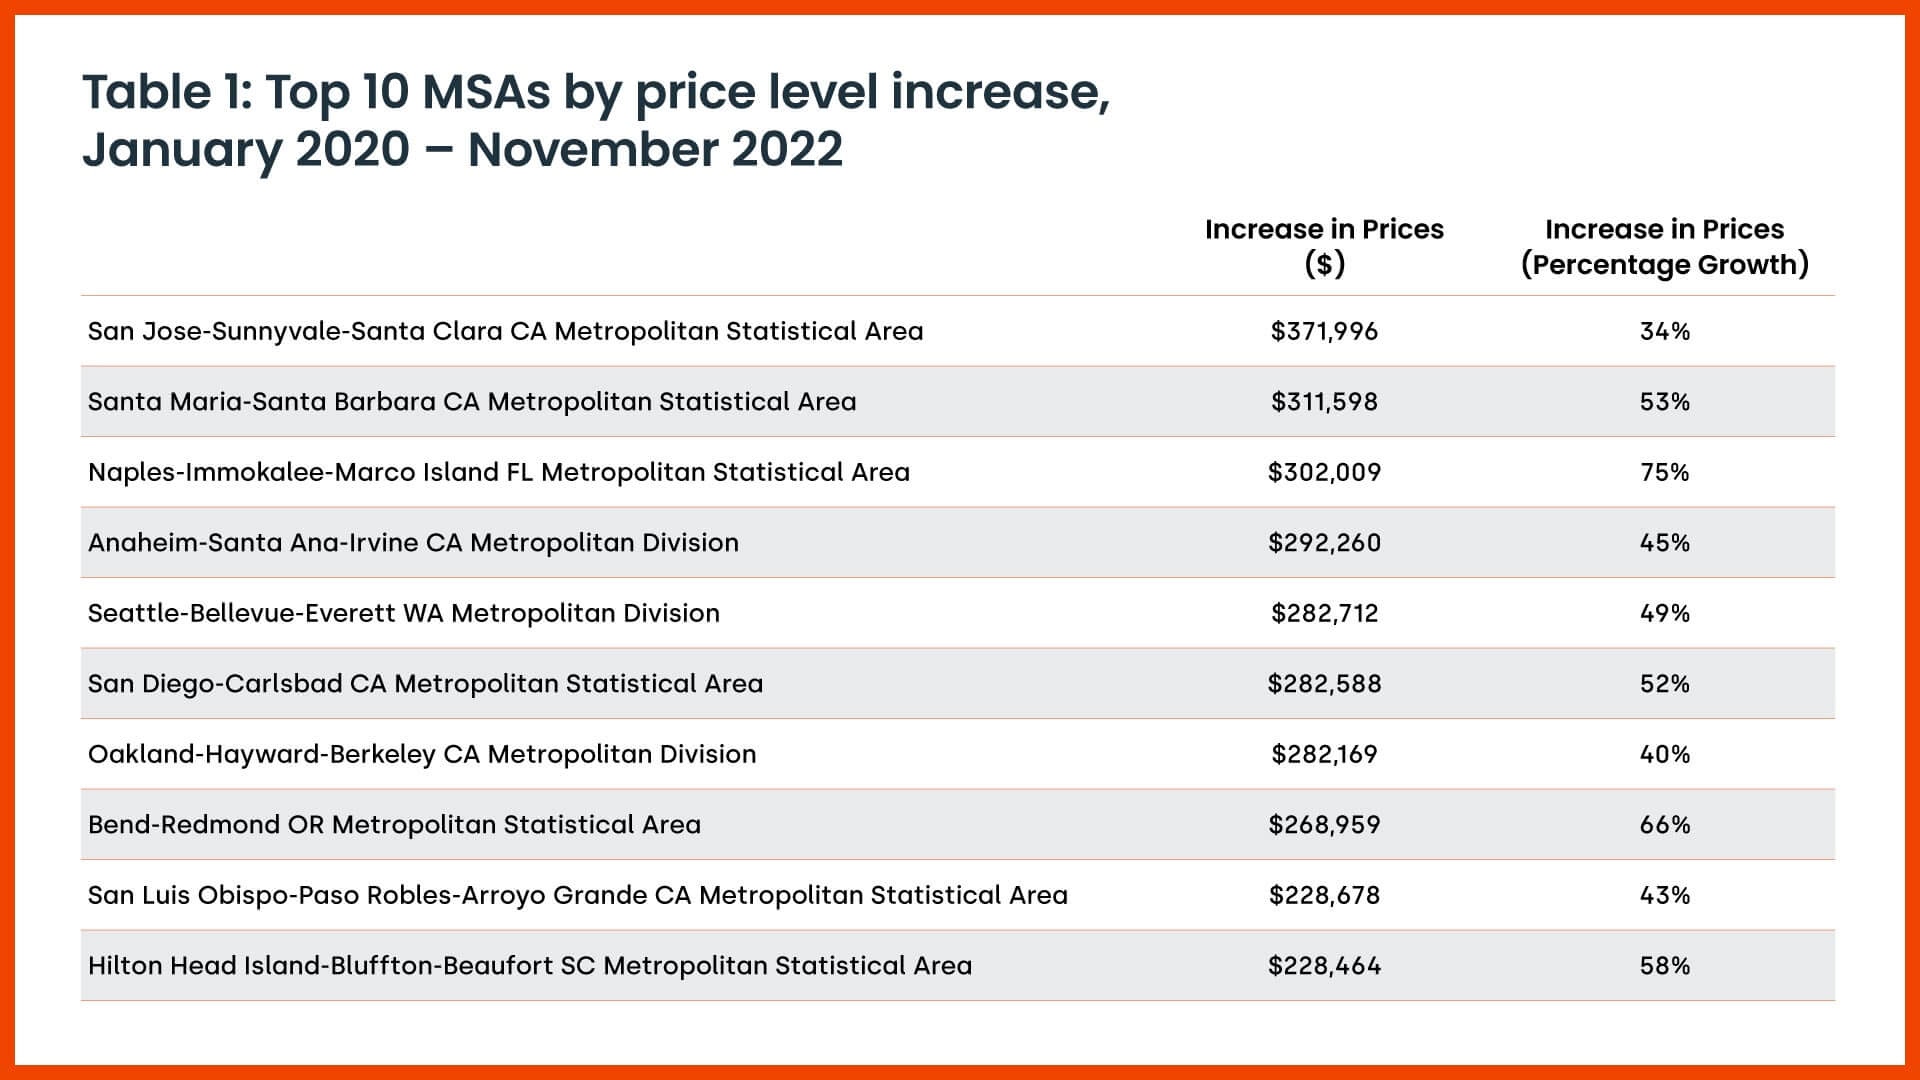
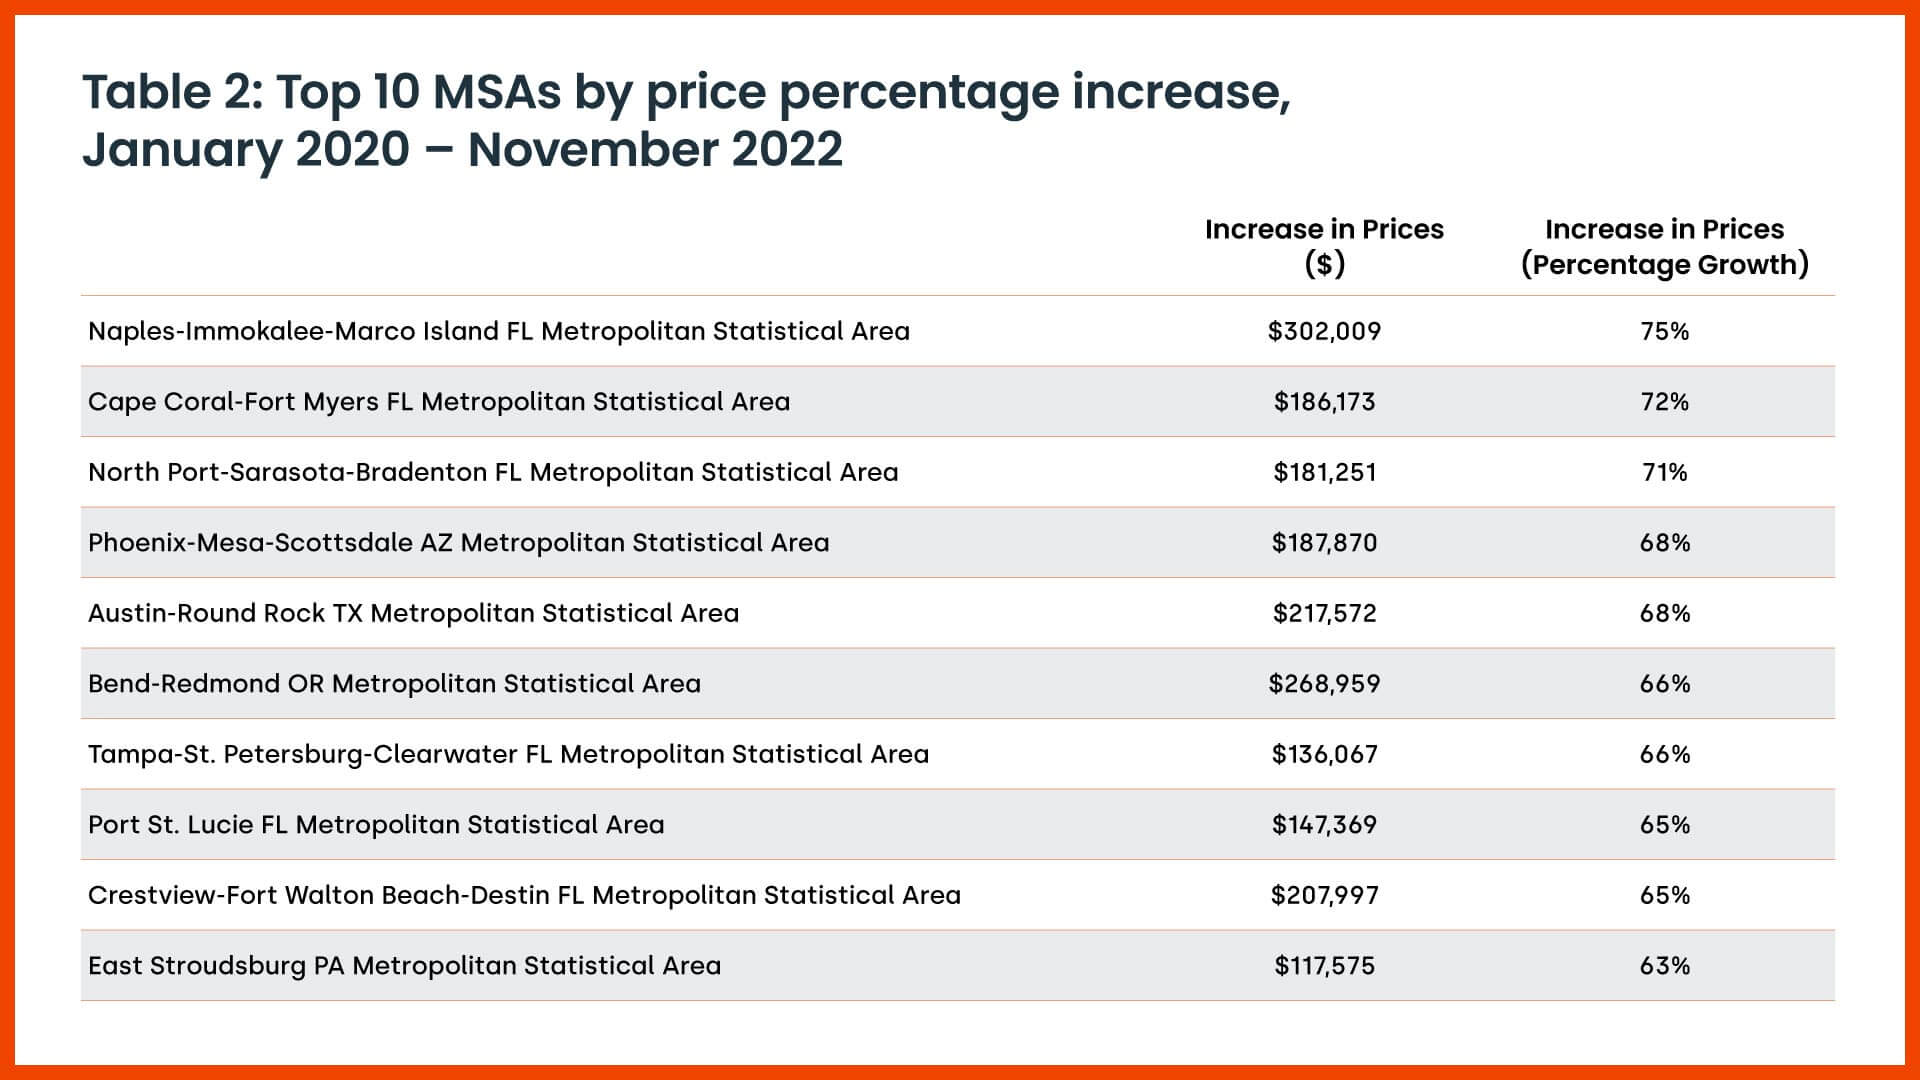
Tables 1 and 2 show why home prices stretched further apart. It is well documented that housing prices appreciated the most in many midpriced metros, such as Austin, Texas; Tampa, Florida; and Phoenix. This increase in home prices is attributable to an influx of homebuyers who migrated to less-dense locations with lower prices to take advantage of their new ability to work remotely.

However, price appreciation is typically reported in percentage terms rather than dollar terms. If we consider price appreciation from a dollar standpoint, the top markets for home price appreciation are somewhat different — and high-priced — areas in California like San Jose and Santa Barbara, which enter the top 10 rankings thanks to base prices that were already at a higher level than most other areas of the country. At the same time, these cities had lower growth in home prices on a percentage basis[3]. Thus, the geography of the pandemic-era boom was not so different from the home price appreciation trend that has been ongoing since 2012, in that the most-expensive places in the country were stretching further from the cheaper areas.

The data clearly suggests that when home prices go up, the dispersion of prices across the country increases, and when home prices decline, dispersion shrinks. As prices begin to drop, the most notable declines are concentrated in some of the most-expensive areas of the country, bringing housing prices across the country closer together. This means that if the current pattern holds, we can expect to see more severe price drops in the most-expensive areas of the country.


[1] Prices were measured by taking the median price in a base period and then rescaling using the CoreLogic Home Price Index.

[2] “Lower” is a relative term. Prices in San Jose and Santa Barbara still increased by 34% and 53%, respectively.

[3] The divergence and convergence are consistent regardless of which part of the distribution is selected. Though the figure only considers the top 100 metros, this trend also holds when expanded to all the country’s statistical areas.

  • Category: Blogs, Intelligence, Quick Takes
  • Tags: Home Value, Housing Gap, Housing Market
ABOUT THE AUTHOR
Thomas Malone
Thomas Malone
Professional, Economist
View Profile

Related Posts

Tornado footprints in Southern California captured by CoreLogic's weather verification technology as viewed in CoreLogic Reactor™.
Blogs

A Rare Los Angeles Tornado and Near Hurricane-Force Winds in San Francisco

CoreLogic Weather Verification Services captured wind and tornado footprints from the severe weather system in California.

March 24, 2023
atmospheric rivers california
Core Conversations

What Was it Really Like to Live Through the California Floods? Our Team Spills

A Conversation With Kent David and Tom Larsen Since the beginning of the year, California has been drenched by atmospheric rivers. The flooding in California

March 22, 2023
Ecuador earthquake
Blogs

M6.8 Earthquake Near the Coast of Ecuador

CoreLogic estimates that insurable losses from the Ecuador earthquake will be up to $600 million.

March 21, 2023

About Corelogic

  • Newsroom
  • Leadership
  • Careers
  • Ethics & Compliance

Accounts

  • Products Sign-in

Contact

  • Sales Contact
  • Product Support

Regions

  • CoreLogic Australia
  • CoreLogic New Zealand
  • CoreLogic UK

Follow & Connect

  • Facebook
  • Instagram
  • Linkedin
  • Twitter
  • YouTube
© 2023 CoreLogic. All rights reserved.
  • Legal
  • Privacy Policy
  • CCPA
  • Cookie Preferences
  • Security
  • Sitemap
  • Accessibility
  • Legal
  • Privacy Policy
  • CCPA
  • Cookie Preferences
  • Security
  • Sitemap
  • Accessibility