Chat
Chat with Sales Hours: Monday-Friday 8:30 a.m. - 4:30 p.m. (CST)
Contact Sales
Call Sales Toll-Free 1-(866) 774-3282 Hours: Monday-Friday 7 a.m. - 5 p.m. (CST)
Product Login
Product Log-in
Product Support
Product Support
Email Sales
Contact Sales
After Hours
  • Support
  • Sign In Sign In
  • AUS NZ UK
CoreLogic - Home
  • Solutions
    view solutions by:

    Data Solutions

    • Lead Generation
    • Property Data
    • Location Intelligence

    Real Estate

    • Multiple Listing Enterprise
    • Agent & Broker

    Mortgage

    • Point of Sale
    • Origination
    • Servicing
    • Appraisal
    • Commercial Property Tax

    Insurance

    • Hazard Risk
    • Catastrophe Risk Management
    • Risk Evaluation
    • Underwriting Automation
    • Weather
    • Claims Automation
    • Restoration

    Mortgage Lenders

    • Point of Sale
    • Origination

    Mortgage Servicers

    • Residential Property Tax
    • Default & Loss Mitigation
    • Portfolio Insight & Monitoring

    Mortgage Appraisers

    • Appraisal

    Real Estate Agents & Brokers

    • Agents & Brokers

    Real Estate MLS

    • Multiple Listing Enterprises

    Commercial Real Estate Owners

    • Commercial Property Tax

    Marketing Departments

    • Property Data

    Insurance Underwriters

    • Risk Evaluation
    • Underwriting Automation
    • Hazard Risk
    • Catastrophe Risk Management

    Insurance Risk Managers

    • Risk Evaluation
    • Hazard Risk
    • Catastrophe Risk Management

    Insurance Claims

    • Claims Automation
    • Restoration Contractors
    • Weather Verification

    Construction Contractors

    • Restoration Contractors

    General

    • Location Intelligence
    • Lead Generation
    • Data Solutions
  • Resources

    Reports

    • Climate Change
    • Construction Claims Bulletin
    • Construction Cost Update
    • Construction Insights
    • Home Price Insights
    • Homeowner Equity Insights
    • Loan Performance Insight
    • Mortgage Fraud
    • Property Tax Delinquency
    • Single-Family Rent Index

    Insight Blogs

    • Hazard HQ
    • Office of Chief Economist
    • Affordable Housing
    • Homebuying
    • Insurance
    • Other Articles

    More Resources

    • Events
    • Case Studies
    • White Papers
    • Podcasts
    • Quick Takes
  • Company
    • About
    • Leadership
    • Newsroom
    • Contact
    • Careers
  • Search
CoreLogic - Home
  • Solutions
  • Resources
  • Company

    • About
    • Leadership
    • Newsroom
    • Contact
    • Careers
  • Accounts

    • Products Sign-in
  • Contact

    • Sales Contact
    • Product Support
  • Regions

    • Australia
    • New Zealand
    • United Kingdom
  • Social

    • Facebook
    • Instagram
    • Linkedin
    • Twitter
    • Youtube
Solutions
VIEW BY:
  • Data Solutions

    • Lead Generation
    • Property Data
    • Location Intelligence
  • Real Estate

    • Multiple Listing Enterprise
    • Agent & Broker
  • Mortgage

    • Point of Sale
    • Origination
    • Servicing
    • Appraisal
    • Commercial Property Tax
  • Insurance

    • Hazard Risk
    • Catastrophe Risk Management
    • Risk Evaluation
    • Underwriting Automation
    • Weather
    • Claims Automation
    • Restoration
  • Mortgage Lenders

    • Point of Sale
    • Origination
  • Mortgage Servicers

    • Residential Property Tax
    • Default & Loss Mitigation
    • Portfolio Insight & Monitoring
  • Mortgage Appraisers

    • Appraisal
  • Real Estate Agents & Brokers

    • Agents & Brokers
  • Real Estate MLS

    • Multiple Listing Enterprises
  • Commercial Real Estate Owners

    • Commercial Property Tax
  • Marketing Departments

    • Property Data
  • Insurance Underwriters

    • Risk Evaluation
    • Underwriting Automation
    • Hazard Risk
    • Catastrophe Risk Management
  • Insurance Risk Managers

    • Risk Evaluation
    • Hazard Risk
    • Catastrophe Risk Management
  • Insurance Claims

    • Claims Automation
    • Restoration Contractors
    • Weather Verification
  • Construction Contractors

    • Restoration Contractors
  • General

    • Location Intelligence
    • Lead Generation
    • Data Solutions
Resources
  • Reports

    • Climate Change
    • Construction Claims Bulletin
    • Construction Cost Update
    • Construction Insights
    • Home Price Insights
    • Homeowner Equity Insights
    • Loan Performance Insight
    • Mortgage Fraud
    • Property Tax Delinquency
    • Single-Family Rent Index
  • Insight Blogs

    • Hazard HQ
    • Office of Chief Economist
    • Affordable Housing
    • Homebuying
    • Insurance
    • Other Articles
  • More Resources

    • Events
    • Case Studies
    • White Papers
    • Podcasts
    • Quick Takes

Home / Intelligence / Nearly 60% of US Homes Sold Below List Price

ABOUT THE AUTHOR
Shu Chen
Shu Chen
Senior Professional, Statistical Analysis, Office of the Chief Economist
View Profile
  • April 26, 2023

Nearly 60% of US Homes Sold Below List Price

Buyer competition fell in early 2023, and home sales prices returned to pre-pandemic rates

Rising home prices and climbing mortgage rates continue to challenge property market affordability in early 2023.

The 30-year, fixed-rate mortgage hovers at one of the highest levels seen over the past 15 years, and home prices remain elevated despite the national CoreLogic Home Price Index (HPI®) softening from double-digit to single-digit annual growth over the past few months. This environment has led many potential homebuyers and investors to hit the pause button on their purchase plans, resulting in 59% of homes selling below list price in March 2023.

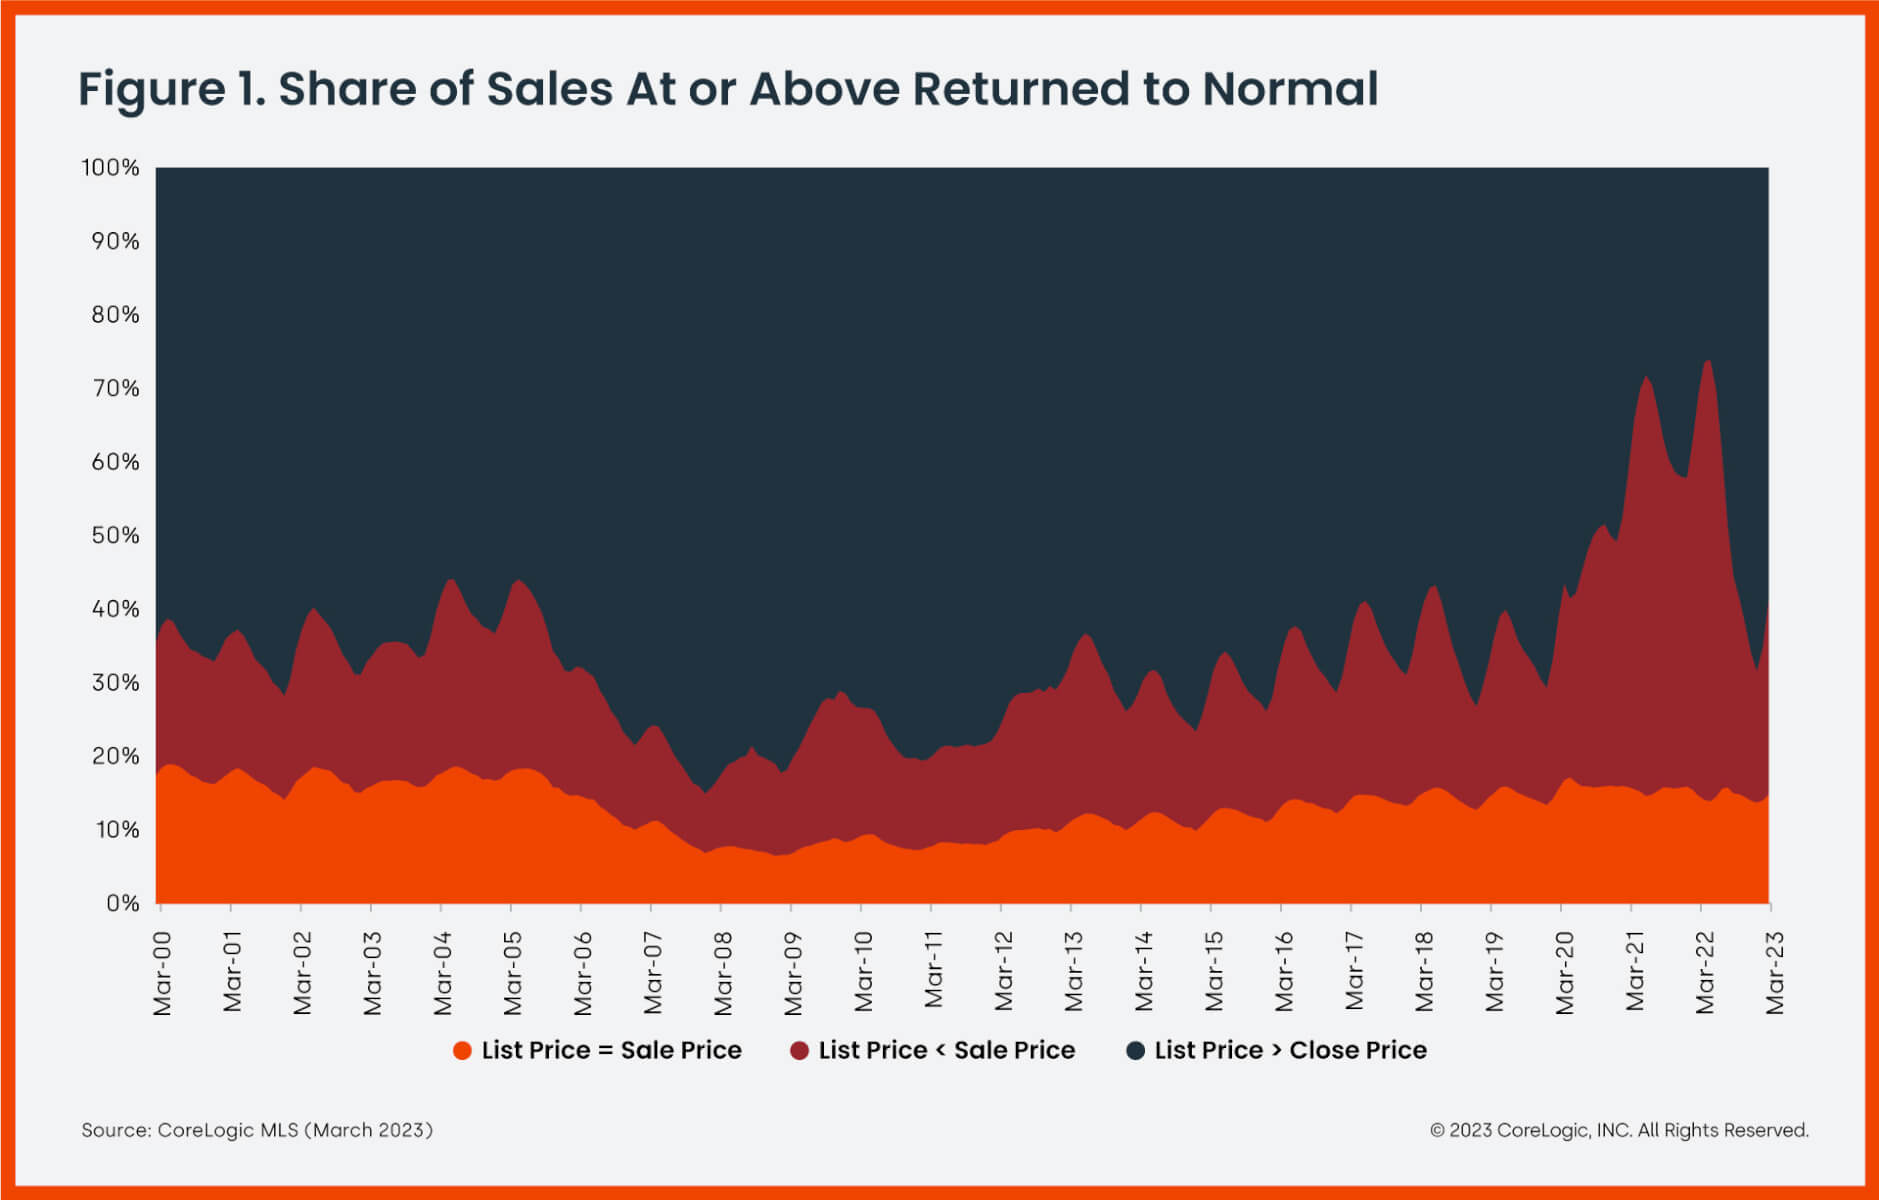
Figure 1[1] shows the share of homes sold at levels above or below list price. Starting in July 2020, the share of homes selling at or above the list price, which is denoted by the orange and blue areas in Figure 1, exceeded the previous peak seen in May 2005. By May 2022, that share reached a new high of 74% of total sales – almost five times the level recorded in January 2008.

But with mortgage rates near a 15-year high in March 2023, the share of homes sold at or above list price decreased to 41%, only 2 percentage points higher than in March 2020 when the pandemic began.

property market share of sales

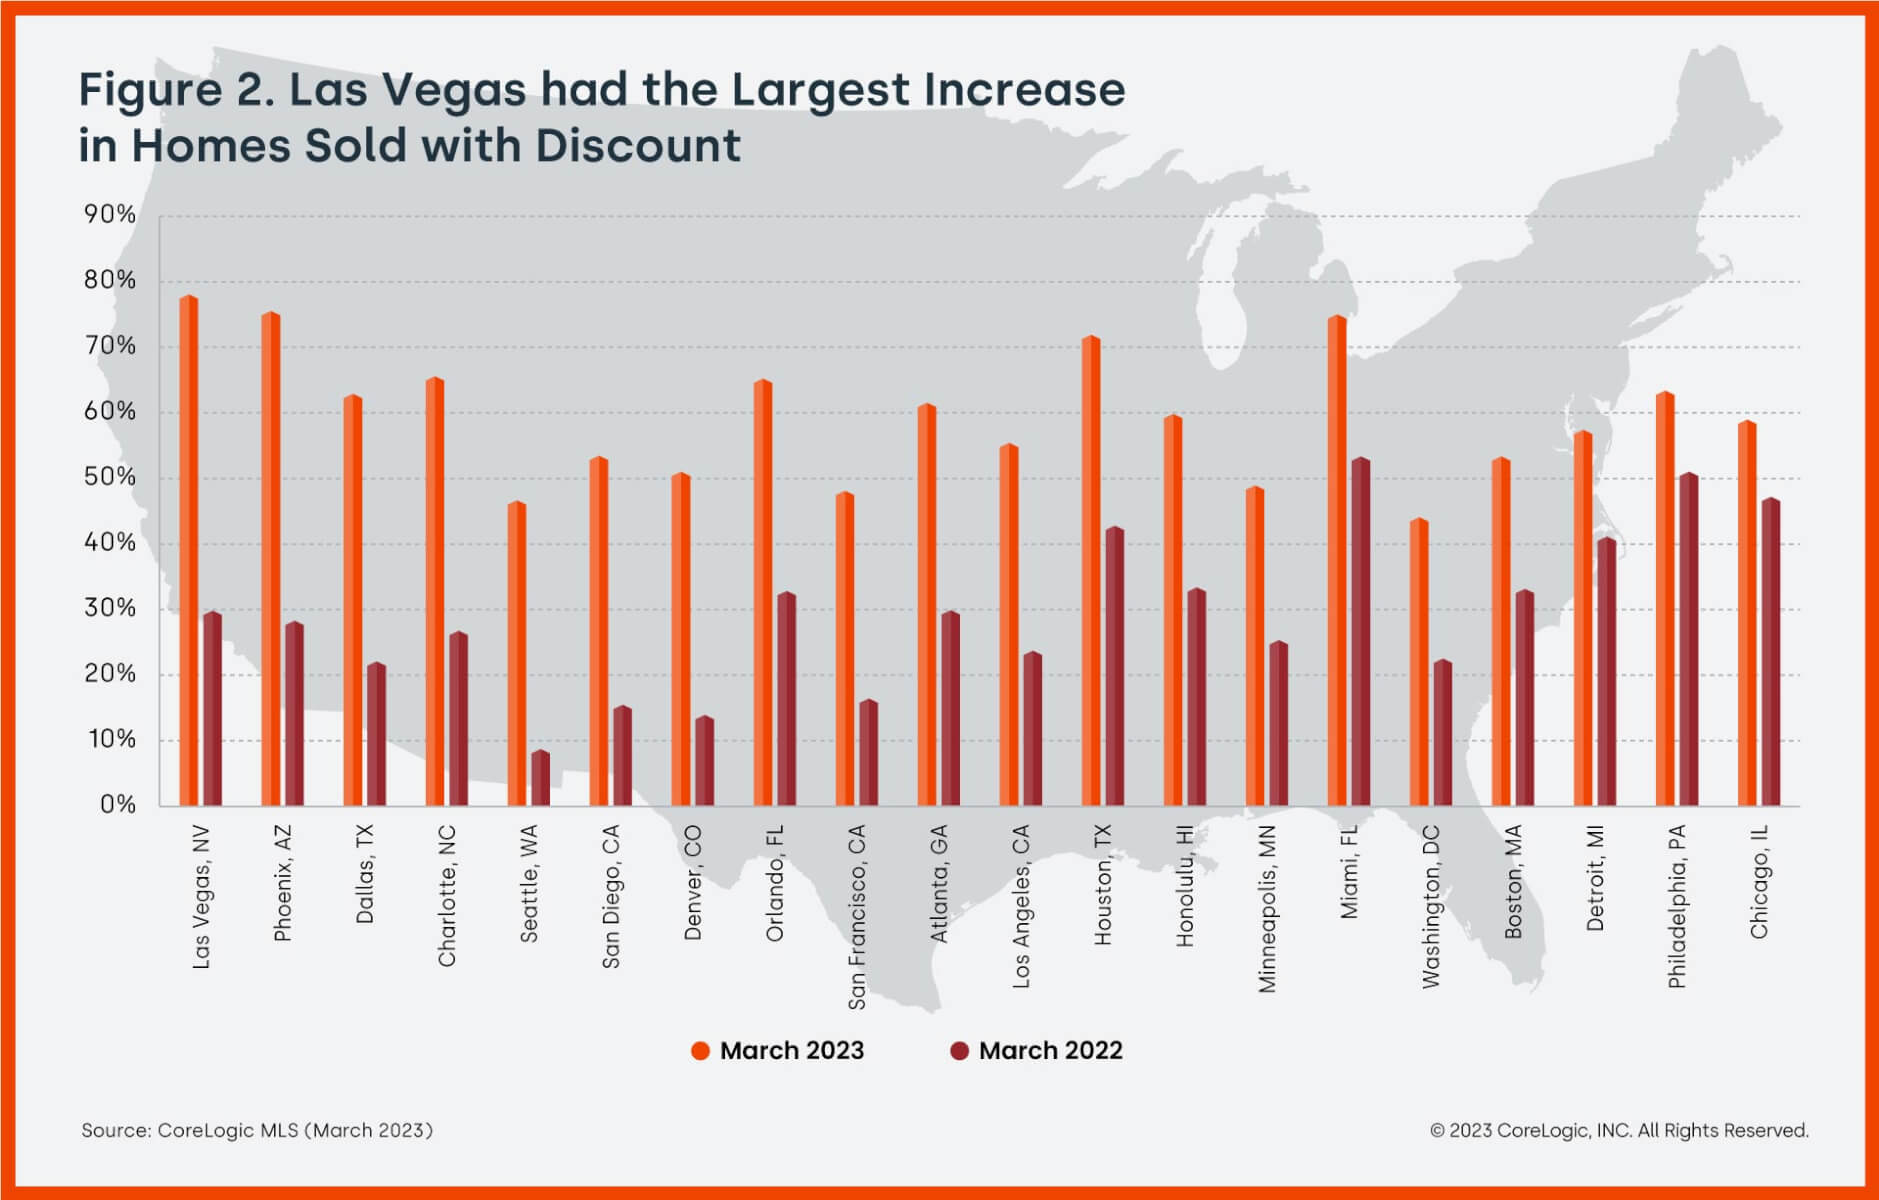
This trend of softening competition in the property market is more pronounced in popular migration destinations. Figure 2 compares the share of homes sold below their list prices in 20 metropolitan areas in March 2023 with the previous year. Las Vegas had the largest increase in the share of homes that sold below list price. In March 2023, 78% of homes in Las Vegas sold at a discount, which is an increase of 4 percentage points from a year prior. Phoenix sales followed a similar pattern where the market saw 47 percentage point increases in the share of homes sold for less than the asking price.

property market las vegas home sales

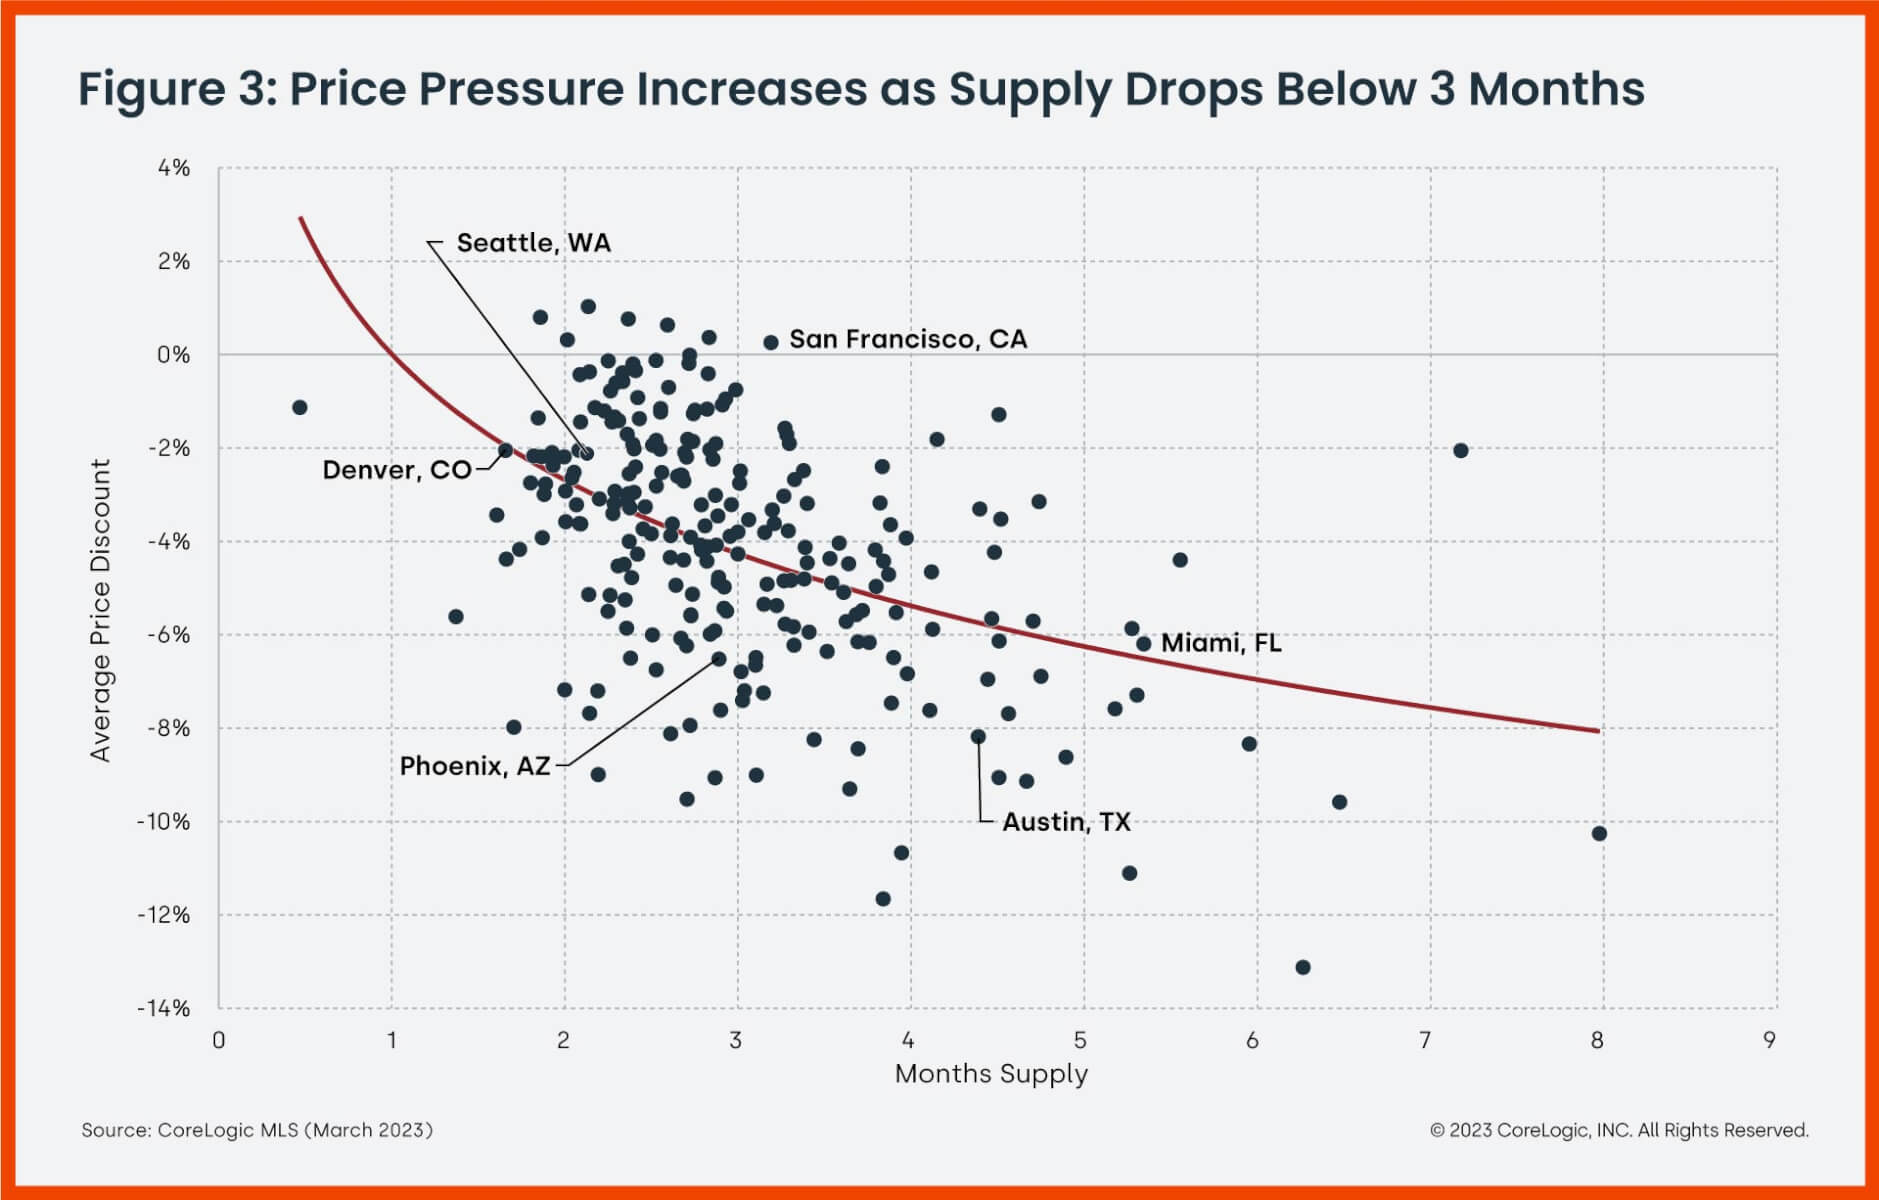
With fewer buyers in the property market, the overall active for-sale inventory increased across all U.S. markets. Figure 3 shows the price discount and months’ supply[2] for more than 200 metropolitan areas. In Miami, where supply increased by two months to 5.3 months in March 2023 compared to a year prior, homebuyers were able to negotiate below the asking price and save an average of 6.2%. In Phoenix, the months’ supply increased from 1.7 to 2.9 months between Mach 2022 and Mach 2023, and homes sold at an average price discount of 6.5%. Similarly, in Austin, Texas, buyers gained an average discount of 8.4%, and the market maintained a 4.4-month supply in March 2023.

price pressures property market

Property market trends are shifting in favor of buyers, and this dynamic could continue, as CoreLogic projects that prices will continue to cool in 2023. To stay up to date with the latest data, regularly check the Home Price Index, which is released on the first Tuesday of each month.


[1] The U.S. statistics are based on data from 68 metropolitan areas. Each of these metros has had at least 50% coverage since 2000. CoreLogic MLS data coverage usually increases over time, which might also contribute to inventory increases.

[2] The months’ supply is calculated as the ratio of the for-sale inventory at the end of the month compared to the number of homes sold during the same month. It represents the number of months it would take to sell the inventory at that month’s sales pace.

  • Category: Blogs, Homebuying, Intelligence, Mortgage, Office of the Chief Economist, Real Estate
  • Tags: Affordability, Home Value, Market Trends
ABOUT THE AUTHOR
Shu Chen
Shu Chen
Senior Professional, Statistical Analysis, Office of the Chief Economist
View Profile

Related Posts

Construction Claims Bulletin

Construction Claims – December 2023

December 2023 bulletin of regional construction cost insights reflecting the CoreLogic Claims Pricing Database.

December 6, 2023
Aerial view of homes in cul de sac
Core Conversations

What Is the 2024 Economic Outlook for the Property Industry?  

Host Maiclaire Bolton Smith and CoreLogic Chief Economist Selma Hepp discuss the 2024 economic outlook in the season finale.

December 6, 2023
Blogs

US Home Price Insights – December 2023

U.S. home price growth moved up again in October on an annual basis, with Northeastern states again posting the highest appreciation.

December 5, 2023

About Corelogic

  • Newsroom
  • Leadership
  • Careers
  • Ethics & Compliance

Accounts

  • Products Sign-in

Contact

  • Sales Contact
  • Product Support

Regions

  • CoreLogic Australia
  • CoreLogic New Zealand
  • CoreLogic UK

Follow & Connect

  • Facebook
  • Instagram
  • Linkedin
  • X (Formerly Twitter)
  • YouTube
© 2023 CoreLogic. All rights reserved.
  • Legal
  • Privacy Policy
  • CCPA
  • Cookie Preferences
  • Security
  • Sitemap
  • Accessibility
  • Legal
  • Privacy Policy
  • CCPA
  • Cookie Preferences
  • Security
  • Sitemap
  • Accessibility