70% of Damage from Flooding is Uninsured
Every one of the approximately 125 million occupied homes in the U.S. has some degree of risk of flooding. While over 7 million U.S. homes have the potential to flood from hurricane storm surge, over 10 million additional homes are exposed to flood risk caused by overflow flooding of rivers and flash floods. Unfortunately, many homeowners at high flood risk are not aware of this.
Flood damage to the average home can easily exceed $50,000.[1] After a flood event, damaged homes are often not suitable for habitation, displacing the homeowner and requiring additional expenses for housing.
And to add to that, the flood damage is often uninsured. This is partly because the U.S. National Flood Insurance Program (NFIP) only covers properties identified as having most extreme risk.
But low risk doesn’t mean no risk. As a result, over 70% of the damage that occurs from floods is uninsured. Flood insurance policies need to be tailored to fit the unique complexities of flood risk.
Floods: A Complex Risk to Housing
There are many sources of flooding: surface water flow, overflowing rivers, and coastal storm surge can all be responsible. As rain falls to the ground, the accumulated water flows across the ground and finds its way to rivers and other drainage pathways, resulting in the flooding of rivers downstream. During a hurricane, the storm can push water from the ocean, or storm surge, up the coast, causing significant flooding upstream of drainage pathways.
One common misconception about flood risk is that it revolves entirely around a property’s elevation, but the reality is not necessarily so simple.
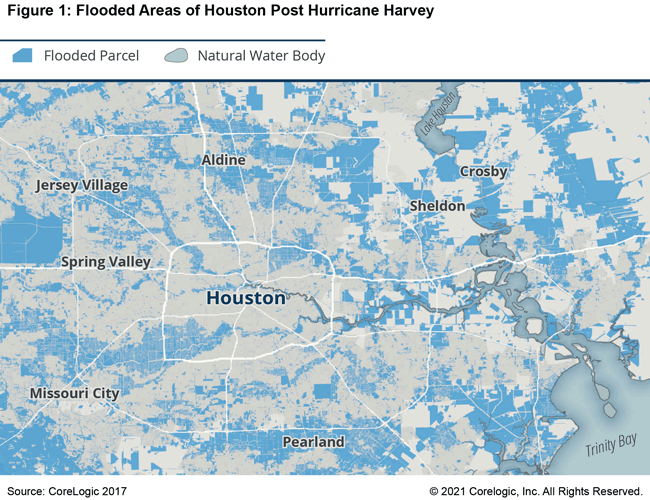
In 2017, Hurricane Harvey devastated the Houston area, causing an estimated $25 billion to $37 billion in damages. Figure 1 shows the neighborhoods in Houston that flooded during Hurricane Harvey. There were 100,000 people with properties impacted by flooding that were shocked to find out that their home was at risk.
The NFIP classifies homes with the highest flood risk as those falling within a Special Flood Hazard Area (SFHA). This area is defined as the area where the annual risk of flooding is 1% each year, often called the 100-year flood zone.
However, many homes outside of the SFHA are still exposed to high flood risk, especially those homes immediately outside of the boundary. For example, during Hurricane Harvey, 70% of the homes damaged by flooding were outside of the SFHA.
Using the SFHA as an indicator for flood risk assumes that homes outside the SFHA do not have risk. A more nuanced way to do this would be to create a gradient of the risk, where areas outside the SFHA have slightly lower risk and areas within the SFHA have slightly higher risk. We can, thus, include the 50-year flood zone and the 500-year flood zone in our models to make them more closely resemble the nature of risk.
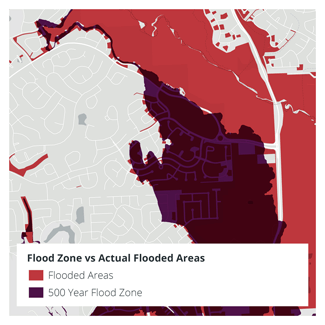
Indeed, during Hurricane Harvey, many homes that flooded were within the 500-year flood zone—and classified as moderate to low risk.
Additionally, the SFHA is largely focused on riverine flooding, rather than surficial runoff and urban flooding.
And even when damage occurred within the SFHA, many homeowners had damage that exceeded the NFIP coverage amount, leaving the rest of the cost to the homeowner. When looking at NFIP claims data for 500,000 recently paid structure claims, almost a third of them exceeded 30% of the insured limit. The insured limit is the maximum amount of money an insurer will pay toward a covered claim. Exceeding this limit means that homeowners are left with the rest of the bill.
Most insurance claims, such as a broken window or a water leak, are usually nowhere near this 30% limit, but in major flooding situations, this upper limit can present a problem of underinsurance. It is critical to make sure homeowners have sufficient funds available when disaster strikes so that they can fully recover.
As the insurance environment migrates away from group-based pricing and towards risk-based pricing, it is critical to (1) granularly identify flood risk and (2) accurately quantify and maintain the reconstruction cost value.[2] These two components are paramount to properly distributing risk, understanding potential underinsurance exposure, and ensuring policyholders can fully recover if faced with flood loss.
There are two significant opportunities for us to better insure flood risk. The first is storm surge on the Atlantic and Gulf Coast, and the second is inland flooding along the Mississippi River.
Opportunity 1: Storm Surge on the Atlantic and Gulf Coast
We can quantify risk by evaluating the reconstruction cost value exposure. In the case of storm surge along the Atlantic and Gulf coast, there is $726 billion of reconstruction cost exposure outside of the SFHA at high or extreme risk of storm surge, and assuming there is 30% damage caused by an event, $218 billion of this risk is uninsured.
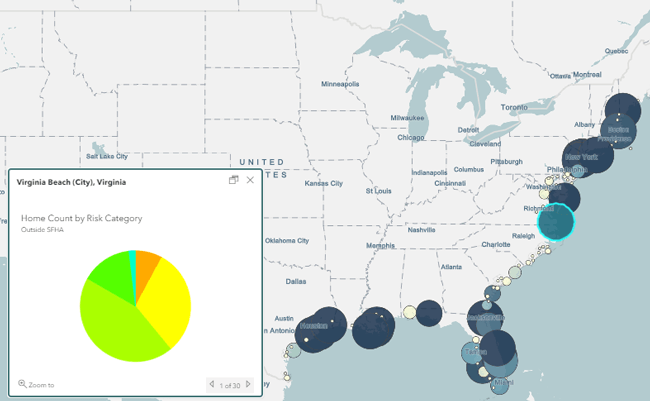
Moreover, inside the SFHA, there is $544 billion of reconstruction cost exposure at high to extreme risk of storm surge. When considering the 30% damage assumption and NFIP coverage, there is $5.2 billion in reconstruction cost that is uninsured after NFIP coverage. This presents a significant opportunity for insurers to fill the gap and make sure that communities can recover after disaster.
Opportunity 2: Inland Flooding Along the Mississippi River
Along the Mississippi River, there is $104 billion in reconstruction cost at high to extreme risk of inland flooding outside of the SFHA, and when considering the 30% damage assumption, $31 billion of that reconstruction cost is uninsured.
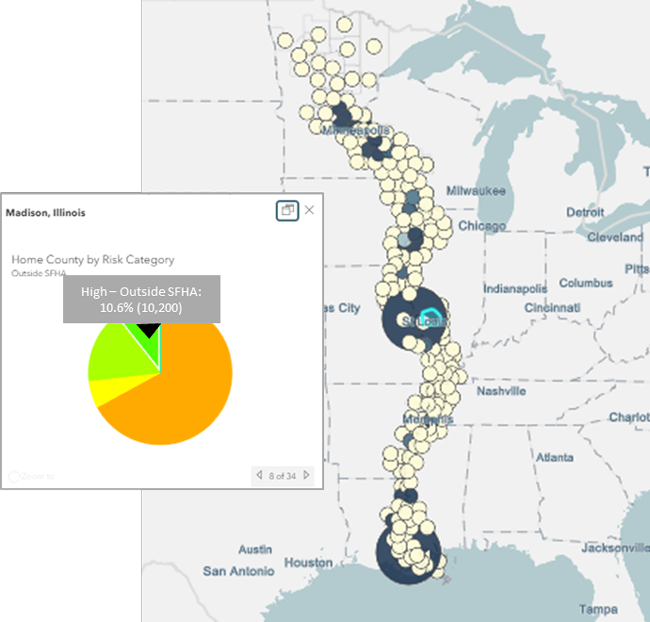
Moreover, there is $45 billion in reconstruction cost inside the SFHA. With the 30% damage assumption and including NFIP coverage, this means there is about $70 million in uninsured reconstruction cost. This also represents a significant opportunity.
Closing the Protection Gap with Data and Analytics
Flooding poses a unique threat to our communities. We need to ensure that our policies and solutions are properly tailored to the unique complexities that come with flood risk. By using the latest technology, we can develop a comprehensive understanding of risk and engineer a more resilient future.
For more about these opportunities to insure flood, see our recent report Finding Opportunities in Insuring Flood. To learn more about the impacts of climate change on flooding, register for our upcoming webinar on April 20 here.
© 2021 CoreLogic,Inc. , All rights reserved.
[1] This is a conservative estimate. The average reconstruction value (RCV) for a home in our dataset is around $250,000. Throughout our study, we assumed that 30% of a home would be damaged if a flood event occurred. This means that the average amount of damage for a $250,000 home would be $75,000. Given that many homes have an RCV below $250,000, we decided to keep our numbers conservative and go with 30% of $150,000 which is $50,000 of damage.
[2] Reconstruction cost value is based on the cost of materials and labor to reconstruct a property. It factors in the pricing variations due to different geographic locations. Estimated values are based on total destruction of the structure.