Chat
Chat with Sales Hours: Monday-Friday 8:30 a.m. - 4:30 p.m. (CST)
Contact Sales
Call Sales Toll-Free 1-(866) 774-3282 Hours: Monday-Friday 7 a.m. - 5 p.m. (CST)
Product Login
Product Log-in
Product Support
Product Support
Email Sales
Contact Sales
After Hours
  • Support
  • Sign In Sign In
  • AUS NZ UK
CoreLogic - Home
  • Solutions
    view solutions by:

    Data Solutions

    • Lead Generation
    • Property Data
    • Location Intelligence

    Real Estate

    • Multiple Listing Enterprise
    • Agent & Broker

    Mortgage

    • Origination
    • Servicing
    • Appraisal
    • Commercial Property Tax

    Insurance

    • Hazard Risk
    • Catastrophe Risk Management
    • Risk Evaluation
    • Underwriting Automation
    • Weather Verification
    • Claims Automation
    • Restoration
    • INTRCONNECT

    Mortgage Lenders

    • Origination

    Mortgage Servicers

    • Residential Property Tax
    • Default & Loss Mitigation
    • Portfolio Insight & Monitoring

    Mortgage Appraisers

    • Appraisal

    Real Estate Agents & Brokers

    • Agents & Brokers

    Real Estate MLS

    • Multiple Listing Enterprises

    Commercial Real Estate Owners

    • Commercial Property Tax

    Marketing Departments

    • Property Data

    Insurance Underwriters

    • Risk Evaluation
    • Underwriting Automation
    • Hazard Risk
    • Catastrophe Risk Management

    Insurance Risk Managers

    • Risk Evaluation
    • Hazard Risk
    • Catastrophe Risk Management

    Insurance Claims

    • Claims Automation
    • Restoration Contractors
    • Weather Verification

    Construction Contractors

    • Restoration Contractors

    General

    • Location Intelligence
    • Lead Generation
    • Data Solutions
  • Resources

    Reports

    • Climate Change
    • Construction Cost Update
    • Construction Insights
    • Home Price Insights
    • Homeowner Equity Insights
    • Loan Performance Insight
    • Mortgage Fraud
    • Property Tax Delinquency
    • Single-Family Rent Index

    Insight Blogs

    • Hazard HQ
    • Office of Chief Economist
    • Affordable Housing
    • Homebuying
    • Insurance
    • Other Articles

    More Resources

    • Case Studies
    • White Papers
    • Podcasts
    • Quick Takes
  • Company
    • About
    • Leadership
    • Newsroom
    • Contact
    • Careers
  • Search
CoreLogic - Home
  • Solutions
  • Resources
  • Company

    • About
    • Leadership
    • Newsroom
    • Contact
    • Careers
  • Accounts

    • Products Sign-in
  • Contact

    • Sales Contact
    • Product Support
  • Regions

    • Australia
    • New Zealand
    • United Kingdom
  • Social

    • Facebook
    • Instagram
    • Linkedin
    • Twitter
    • Youtube
Solutions
VIEW BY:
  • Data Solutions

    • Lead Generation
    • Property Data
    • Location Intelligence
  • Real Estate

    • Multiple Listing Enterprise
    • Agent & Broker
  • Mortgage

    • Origination
    • Servicing
    • Appraisal
    • Commercial Property Tax
  • Insurance

    • Hazard Risk
    • Catastrophe Risk Management
    • Risk Evaluation
    • Underwriting Automation
    • Weather Verification
    • Claims Automation
    • Restoration
    • INTRCONNECT
  • Mortgage Lenders

    • Origination
  • Mortgage Servicers

    • Residential Property Tax
    • Default & Loss Mitigation
    • Portfolio Insight & Monitoring
  • Mortgage Appraisers

    • Appraisal
  • Real Estate Agents & Brokers

    • Agents & Brokers
  • Real Estate MLS

    • Multiple Listing Enterprises
  • Commercial Real Estate Owners

    • Commercial Property Tax
  • Marketing Departments

    • Property Data
  • Insurance Underwriters

    • Risk Evaluation
    • Underwriting Automation
    • Hazard Risk
    • Catastrophe Risk Management
  • Insurance Risk Managers

    • Risk Evaluation
    • Hazard Risk
    • Catastrophe Risk Management
  • Insurance Claims

    • Claims Automation
    • Restoration Contractors
    • Weather Verification
  • Construction Contractors

    • Restoration Contractors
  • General

    • Location Intelligence
    • Lead Generation
    • Data Solutions
Resources
  • Reports

    • Climate Change
    • Construction Cost Update
    • Construction Insights
    • Home Price Insights
    • Homeowner Equity Insights
    • Loan Performance Insight
    • Mortgage Fraud
    • Property Tax Delinquency
    • Single-Family Rent Index
  • Insight Blogs

    • Hazard HQ
    • Office of Chief Economist
    • Affordable Housing
    • Homebuying
    • Insurance
    • Other Articles
  • More Resources

    • Case Studies
    • White Papers
    • Podcasts
    • Quick Takes

Home / Intelligence / Blogs / Hazard HQ / Top 15 Metro Areas with Wildfire Risk

ABOUT THE AUTHOR
Thomas Jeffrey
Thomas Jeffrey
Principal, Science & Analytics
View Profile
  • November 4, 2019

Top 15 Metro Areas with Wildfire Risk

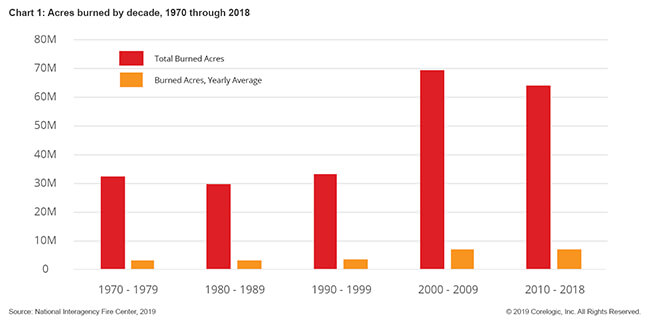
Over the past several years, the United States has experienced record-breaking wildfires. In 2018 alone, a total of 8,767,492 acres burned – an area roughly equivalent to 74 of the 75 largest cities in the United States combined. This is the sixth-highest total since modern historical records began in the mid-1900s.

In 2004, over 8 million acres burned in one year – this happened another eight times in the following 14 years. A decadal comparison of burned acreage shows that there has been a shift towards increased burned acreage over the last 20 years. Within this same timeframe, larger and more devastating wildfire events have occurred, particularly in areas with increased wildfire risk.

CoreLogic compiled a list of the top 15 metropolitan areas with homes at elevated risk to better understand the landscape of risk outside of what is typically considered a wildfire hot spots, e.g. large swaths of unoccupied forest. All 15 are within the  Western U.S. based on combined high- and extreme-risk properties along with the Reconstruction Cost Value (RCV) for each. The rank is based on the RCV.

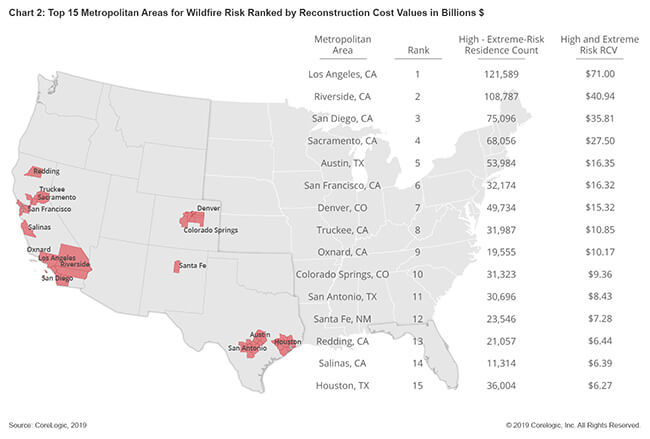
Risk in metro areas is interesting, as wildfires in the Western U.S. have always been a part of the ecosystems and landscapes. For example, in areas without human habitation, lightning strikes were often the source of natural ignitions. However, the population of this area of the country now tops 100 million and thus the potential impacts of wildfires on humans, and vice versa, are inextricably linked. People are more likely to cause wildfire ignitions by a factor of 4-to-1 compared to natural causes. While some human-caused ignitions are the result of arson, many are caused by accidental or unintentional ignitions from normal human activity such as lit cigarettes and campfires.

As demand for housing grows and development expands outward from large cities, the wildland urban-interface, a transition zone between unoccupied land and human development, is often the only location with space to expand. Very frequently, that edge of development will border wildfire-prone vegetation.

To illustrate wildfire risk in the United States, the snapshot below highlights Santa Fe, New Mexico – ranked 12 out of the top 15 metro areas with elevated risk.

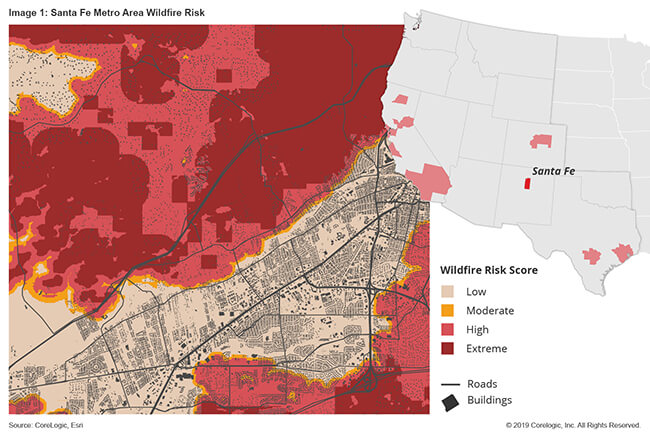
In analyzing the Santa Fe metro area, it’s easy to see how low risk doesn’t necessarily mean no risk. The border between low-risk and extreme-risk areas is slender, and major highways snake in and out of extreme-risk areas, which means that if a fire broke out, the community may have a more difficult time evacuating, Additionally, the bottom-right side of the image shows the Santa Fe Regional Airport lays against three different risk areas: moderate, high and extreme. In more extreme circumstances, embers from fires in extreme risk areas can be blown a mile or farther and ignite structures. Many homes are destroyed each year due to ember-related ignitions.

Last year, the Camp Fire devastated the city of Paradise, California. The fast-moving fire and limited road network in and out of Paradise prevented residents from leaving quickly, leading to the largest loss of life due to a wildfire in California’s history. In addition, the Camp Fire destroyed 18,804 structures – more than the 10 most destructive California wildfires combined. CoreLogic estimates the total losses from the Camp Fire at $9.3 billion.

When considering the future of wildfire risk in the Western U.S., it will likely expand to more homes and result in greater property losses than we have seen in the past.

Wildfire is a unique peril because the level of damage is often binary – meaning, a home is either left untouched by the fire, or a total loss occurs. A patchwork of devastation occurs as fires pass by some properties indiscriminately while surrounding homes are reduced to ash. Unlike flooding or hail, wildfires can and often do result in a 100% loss of the structure. Post-event studies have shown that structural hardening, or the process of mitigating a home against wildfire (e.g., using fire-resistant building materials for roofs, siding, etc.) can increase a home’s resistance to fire. However, all too often luck seems to play a part, too.

It only requires less than perfect weather conditions and an errant spark to create the next unwanted record for wildfire damage or loss of life.

For an in-depth look back at major wildfire events in 2017 and 2019, or for more information about regional, state or national wildfire risk in the United States, read the CoreLogic 2019 Wildfire Risk Report.

© 2019 CoreLogic, Inc. All rights reserved

  • Category: Blogs, Hazard HQ, Intelligence
  • Tags: Hazard HQ, Insurance, Natural Hazard, Wildfire Risk
ABOUT THE AUTHOR
Thomas Jeffrey
Thomas Jeffrey
Principal, Science & Analytics
View Profile

Related Posts

Turkey Syria Earthquake
Hazard HQ

M7.5 – 7.8 Earthquake Sequence Near Turkey-Syria Border

A sequence of powerful earthquakes struck near the Turkey-Syria border, with three of the earthquakes registering magnitudes exceeding 6.5.

February 7, 2023
Dec2022HPIPromo
Blogs

U.S. Home Price Insights – February 2023

U.S. home prices continued to slow on a year-over-year basis in December 2022, moving down to 6.9%.

February 7, 2023
Jan23CSIPromo
Home Price Insights

US CoreLogic S&P Case-Shiller Index Growth Rate Cools Further in November, Up by 7.7%

Annual U.S. home price growth continued to relax in November for the seventh straight month.

January 31, 2023

About Corelogic

  • Newsroom
  • Leadership
  • Careers
  • Ethics & Compliance

Accounts

  • Products Sign-in

Contact

  • Sales Contact
  • Product Support

Regions

  • CoreLogic Australia
  • CoreLogic New Zealand
  • CoreLogic UK

Follow & Connect

  • Facebook
  • Instagram
  • Linkedin
  • Twitter
  • YouTube
© 2023 CoreLogic. All rights reserved.
  • Legal
  • Privacy Policy
  • CCPA
  • Security
  • Sitemap
  • Accessibility
  • Legal
  • Privacy Policy
  • CCPA
  • Security
  • Sitemap
  • Accessibility