Through June 2021 with Forecasts from June 2022
Introduction
The CoreLogic Home Price Insights report features an interactive view of our Home Price Index product with analysis through June 2021 with forecasts from June 2022.
CoreLogic HPI™ is designed to provide an early indication of home price trends. The indexes are fully revised with each release and employ techniques to signal turning points sooner. CoreLogic HPI Forecasts™ (with a 30-year forecast horizon), project CoreLogic HPI levels for two tiers—Single-Family Combined (both Attached and Detached) and Single-Family Combined excluding distressed sales.
The report is published monthly with coverage at the national, state and Core Based Statistical Area (CBSA)/Metro level and includes home price indices (including distressed sale); home price forecast and market condition indicators. The data incorporates more than 40 years of repeat-sales transactions for analyzing home price trends.
HPI National Change
June 2021 National Home Prices
Home prices nationwide, including distressed sales, increased year over year by 17.2% in June 2021 compared with June 2020 and increased month over month by 2.3% in June 2021 compared with May 2021 (revisions with public records data are standard, and to ensure accuracy, CoreLogic incorporates the newly released public data to provide updated results).
Forecast Prices Nationally
The CoreLogic HPI Forecast indicates that home prices will increase on a month-over-month basis by 0.7% from June 2021 to July 2021, and on a year-over-year basis by 3.2% from June 2021 to June 2022.

“Home prices have been rising in the mid-single digits for some years now. The recent surge to double-digit price jumps reflect the convergence of exceptional demand and persistent low supply. With plenty of cash on the sidelines, along with very low mortgage rates, prices are heading up and affordability will become a more acute issue for the foreseeable future.”
-Frank Martell
President and CEO of CoreLogic
HPI & Case-Shiller Trends
This graph shows a comparison of the national year-over-year percent change for the CoreLogic HPI and CoreLogic Case-Shiller Index from 2000 to present month with forecasts one year into the future. We note that both the CoreLogic HPI Single Family Combined tier and the CoreLogic Case-Shiller Index are posting positive, but moderating year-over-year percent changes, and forecasting gains for the next year.

COVID-19 Impact on Home Prices
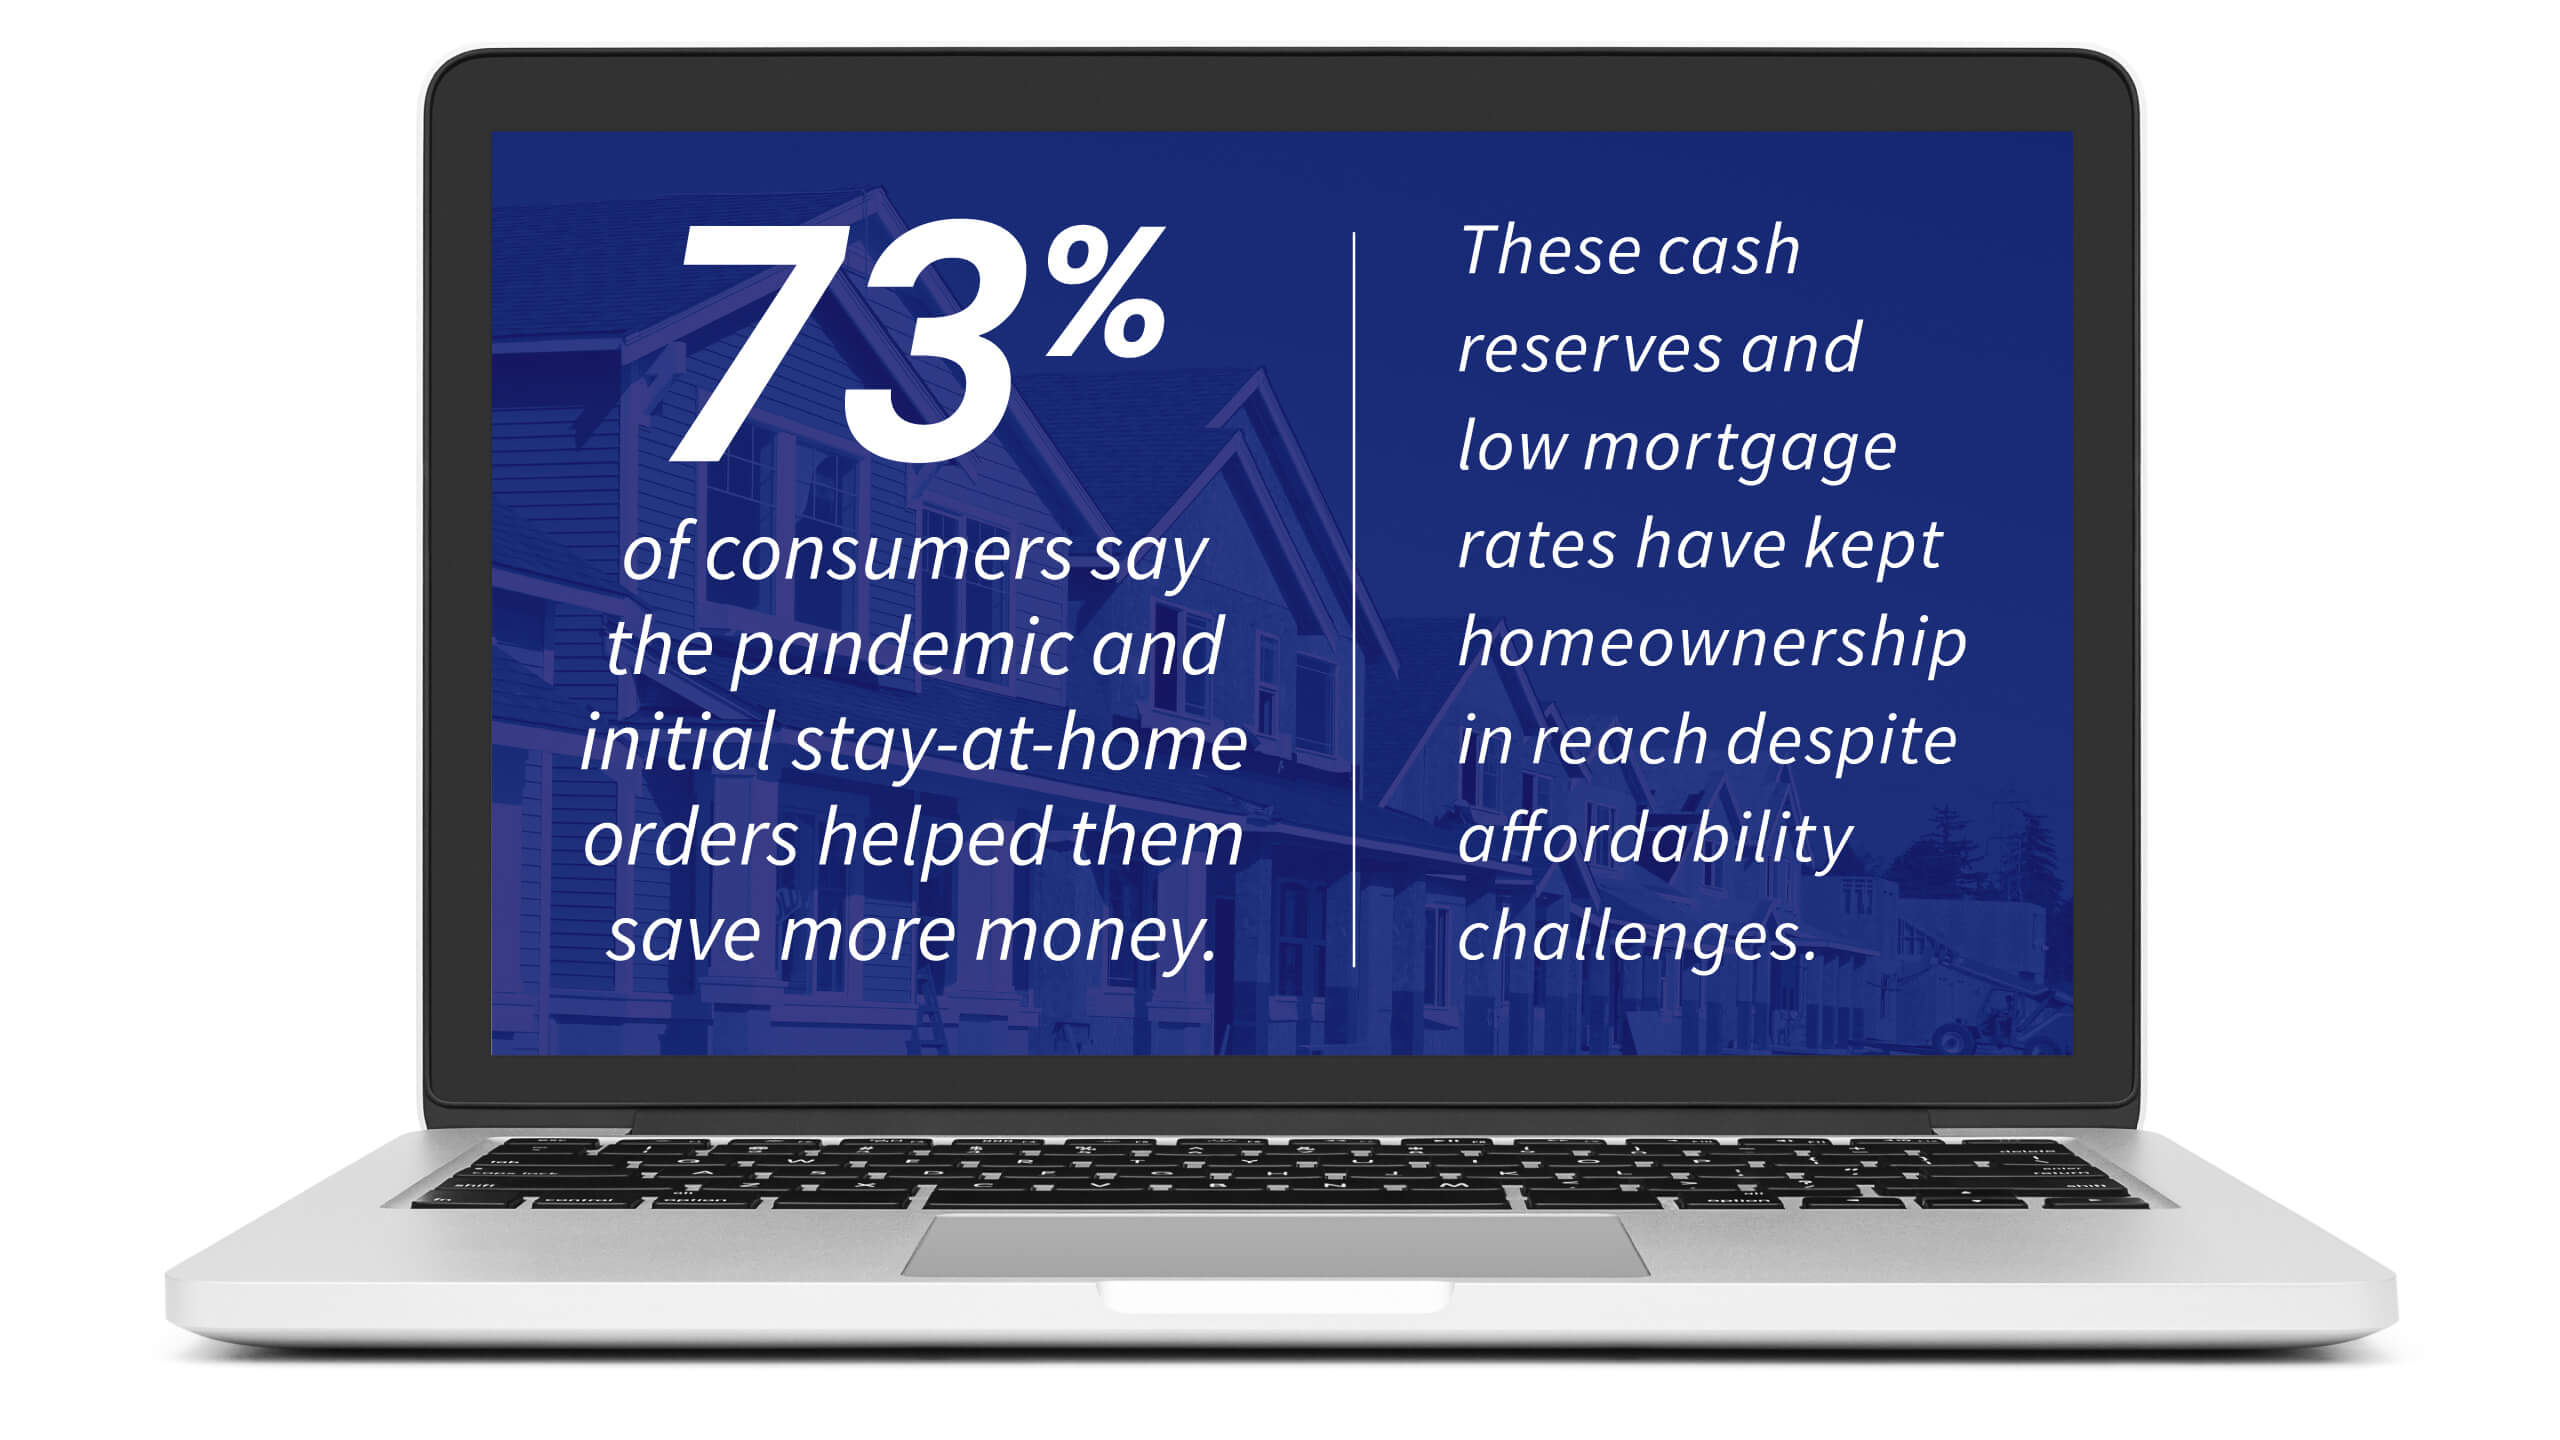
Despite the economic ups and downs brought on by the pandemic, the housing market is still going strong. As supply and demand pressures endure and construction costs spike, in June, home price gains reached the highest annual growth since 1979. While affordability challenges intensify, low mortgage rates, rising savings and an improving labor market are helping to keep homeownership within reach for many prospective buyers. However, CoreLogic projects home price gains may slow over the next 12 months as demand moderates and for-sale inventory rises
“The pandemic sparked an increase in buyer desire for lower density neighborhoods and more living space — both inside and outside their home. Communities with single-family detached houses fill this need. Detached homes had the highest annual growth in June since the inception of the CoreLogic Home Price Index in 1976.”
– Dr. Frank Nothaft
Chief Economist for CoreLogic
HPI National and State Maps – June 2021
The CoreLogic HPI provides measures for multiple market segments, referred to as tiers, based on property type, price, time between sales, loan type (conforming vs. non-conforming) and distressed sales. Broad national coverage is available from the national level down to ZIP Code, including non-disclosure states.
Nationally, home prices increases 17.2% year over year in June. No states posted an annual decline in home prices. The states with the highest increases year-over-year were Idaho (34.2%), Arizona (26.1%), and Montana (24.3%).


HPI Top 10 Metros Change
The CoreLogic HPI provides measures for multiple market segments, referred to as tiers, based on property type, price, time between sales, loan type (conforming vs. non-conforming) and distressed sales. Broad national coverage is available from the national level down to ZIP Code, including non-disclosure states.
These large cities continue to experience price increases in June, with Phoenix leading the way at 26.9% year over year.

Markets to Watch: Top Markets at Risk of Home Price Decline
While home price changes on the local level vary, June gains across all of the top 10 metros surpassed their 2020 levels. However, metro areas where affordability constraints are prevalent continue to persist as prices rise. For instance, in June, home prices in San Diego increased 22.4% year over year and are forecasted to increase an additional 11.5% over the next 12 months.
Conversely, The HPI Forecast also reveals the continued disparity in home price growth across metros. In markets like Houston, which was hit hard by the collapse of the oil industry and the recent hurricane season, home prices are expected to decline 0.9% by June 2022.
The CoreLogic Market Risk Indicator (MRI), a monthly update of the overall health of housing markets across the country, predicts that metros such Springfield, Massachusetts is at the greatest risk 25-50%) of a decline in home prices over the next 12 months. Worchester, Massachusetts; Chico, California; Oxnard-Thousand Oaks Ventura, California; and Norwich-New London, Connecticut, are also at low risk (less than 25%) or a decline over the next 12 months.

Summary
CoreLogic HPI features deep, broad coverage, including non-disclosure state data. The index is built from industry-leading real-estate public record, servicing, and securities databases—including more than 40 years of repeat-sales transaction data—and all undergo strict pre-boarding assessment and normalization processes.
CoreLogic HPI and HPI Forecasts both provide multi-tier market evaluations based on price, time between sales, property type, loan type (conforming vs. non-conforming) and distressed sales, helping clients hone in on price movements in specific market segments.
Updated monthly, the index is the fastest home-price valuation information in the industry—complete home-price index datasets five weeks after month’s end. The Index is completely refreshed each month—all pricing history from 1976 to the current month—to provide the most up-to-date, accurate indication of home-price movements available.
Methodology
The CoreLogic HPI™ is built on industry-leading public record, servicing and securities real-estate databases and incorporates more than 40 years of repeat-sales transactions for analyzing home price trends. Generally released on the first Tuesday of each month with an average five-week lag, the CoreLogic HPI is designed to provide an early indication of home price trends by market segment and for the “Single-Family Combined” tier, representing the most comprehensive set of properties, including all sales for single-family attached and single-family detached properties. The indices are fully revised with each release and employ techniques to signal turning points sooner. The CoreLogic HPI provides measures for multiple market segments, referred to as tiers, based on property type, price, time between sales, loan type (conforming vs. non-conforming) and distressed sales. Broad national coverage is available from the national level down to ZIP Code, including non-disclosure states.
CoreLogic HPI Forecasts™ are based on a two-stage, error-correction econometric model that combines the equilibrium home price—as a function of real disposable income per capita—with short-run fluctuations caused by market momentum, mean-reversion, and exogenous economic shocks like changes in the unemployment rate. With a 30-year forecast horizon, CoreLogic HPI Forecasts project CoreLogic HPI levels for two tiers — “Single-Family Combined” (both attached and detached) and “Single-Family Combined Excluding Distressed Sales.” As a companion to the CoreLogic HPI Forecasts, Stress-Testing Scenarios align with Comprehensive Capital Analysis and Review (CCAR) national scenarios to project five years of home prices under baseline, adverse and severely adverse scenarios at state, metropolitan areas and ZIP Code levels. The forecast accuracy represents a 95% statistical confidence interval with a +/- 2% margin of error for the index.
About Market Risk Indicator
Market Risk Indicators are a subscription-based analytics solution that provide monthly updates on the overall “health” of housing markets across the country. CoreLogic data scientists combine world-class analytics with detailed economic and housing data to help determine the likelihood of a housing bubble burst in 392 major metros and all 50 states. Market Risk Indicators is a multi-phase regression model that provides a probability score (from 1 to 100) on the likelihood of two scenarios per metro: a >10% price reduction and a ≤ 10% price reduction. The higher the score, the higher the risk of a price reduction.
About the CoreLogic Consumer Housing Sentiment Study
3,000+ consumers were surveyed by CoreLogic via Qualtrics. The study is an annual pulse of U.S. housing market dynamics concentrated on consumers looking to purchase a home, consumers not looking to purchase a home, and current mortgage holder. The survey was conducted in April 2021 and hosted on Qualtrics.
The survey has a sampling error of ~3% at the total respondent level with a 95% confidence level.
Source: CoreLogic
The data provided are for use only by the primary recipient or the primary recipient’s publication or broadcast. This data may not be resold, republished or licensed to any other source, including publications and sources owned by the primary recipient’s parent company without prior written permission from CoreLogic. Any CoreLogic data used for publication or broadcast, in whole or in part, must be sourced as coming from CoreLogic, a data and analytics company. For use with broadcast or web content, the citation must directly accompany first reference of the data. If the data are illustrated with maps, charts, graphs or other visual elements, the CoreLogic logo must be included on screen or website.
For questions, analysis or interpretation of the data, contact Amy Brennan at [email protected]. Data provided may not be modified without the prior written permission of CoreLogic. Do not use the data in any unlawful manner. The data are compiled from public records, contributory databases and proprietary analytics, and its accuracy is dependent upon these sources.
Illustrated Report Highlights
As a courtesy you can download the national historic HPI data here. (Note: this link is a national historical trend report and not the current month CoreLogic Home Price Insights report).
About CoreLogic
CoreLogic (NYSE: CLGX), the leading provider of property insights and solutions, promotes a healthy housing market and thriving communities. Through its enhanced property data solutions, services and technologies, CoreLogic enables real estate professionals, financial institutions, insurance carriers, government agencies and other housing market participants to help millions of people find, buy and protect their homes. For more information, please visit www.corelogic.com.
CORELOGIC, the CoreLogic logo, CoreLogic HPI, CoreLogic HPI Forecast and HPI are trademarks of CoreLogic, Inc. and/or its subsidiaries.
For More Information
Please email [email protected].