Chat
Chat with Sales Hours: Monday-Friday 8:30 a.m. - 4:30 p.m. (CST)
Contact Sales
Call Sales Toll-Free 1-(866) 774-3282 Hours: Monday-Friday 7 a.m. - 5 p.m. (CST)
Product Login
Product Log-in
Product Support
Product Support
Email Sales
Contact Sales
After Hours
  • Support
  • Sign In Sign In
  • AUS NZ UK
CoreLogic - Home
  • Solutions
    view solutions by:

    Data Solutions

    • Lead Generation
    • Property Data
    • Location Intelligence

    Real Estate

    • Multiple Listing Enterprise
    • Agent & Broker

    Mortgage

    • Origination
    • Servicing
    • Appraisal
    • Commercial Property Tax

    Insurance

    • Hazard Risk
    • Catastrophe Risk Management
    • Risk Evaluation
    • Underwriting Automation
    • Weather Verification
    • Claims Automation
    • Restoration
    • INTRCONNECT

    Mortgage Lenders

    • Origination

    Mortgage Servicers

    • Residential Property Tax
    • Default & Loss Mitigation
    • Portfolio Insight & Monitoring

    Mortgage Appraisers

    • Appraisal

    Real Estate Agents & Brokers

    • Agents & Brokers

    Real Estate MLS

    • Multiple Listing Enterprises

    Commercial Real Estate Owners

    • Commercial Property Tax

    Marketing Departments

    • Property Data

    Insurance Underwriters

    • Risk Evaluation
    • Underwriting Automation
    • Hazard Risk
    • Catastrophe Risk Management

    Insurance Risk Managers

    • Risk Evaluation
    • Hazard Risk
    • Catastrophe Risk Management

    Insurance Claims

    • Claims Automation
    • Restoration Contractors
    • Weather Verification

    Construction Contractors

    • Restoration Contractors

    General

    • Location Intelligence
    • Lead Generation
    • Data Solutions
  • Resources

    Reports

    • Climate Change
    • Construction Cost Update
    • Construction Insights
    • Home Price Insights
    • Homeowner Equity Insights
    • Loan Performance Insight
    • Mortgage Fraud
    • Property Tax Delinquency
    • Single-Family Rent Index

    Insight Blogs

    • Hazard HQ
    • Office of Chief Economist
    • Affordable Housing
    • Homebuying
    • Insurance
    • Other Articles

    More Resources

    • Case Studies
    • White Papers
    • Podcasts
    • Quick Takes
  • Company
    • About
    • Leadership
    • Newsroom
    • Contact
    • Careers
  • Search
CoreLogic - Home
  • Solutions
  • Resources
  • Company

    • About
    • Leadership
    • Newsroom
    • Contact
    • Careers
  • Accounts

    • Products Sign-in
  • Contact

    • Sales Contact
    • Product Support
  • Regions

    • Australia
    • New Zealand
    • United Kingdom
  • Social

    • Facebook
    • Instagram
    • Linkedin
    • Twitter
    • Youtube
Solutions
VIEW BY:
  • Data Solutions

    • Lead Generation
    • Property Data
    • Location Intelligence
  • Real Estate

    • Multiple Listing Enterprise
    • Agent & Broker
  • Mortgage

    • Origination
    • Servicing
    • Appraisal
    • Commercial Property Tax
  • Insurance

    • Hazard Risk
    • Catastrophe Risk Management
    • Risk Evaluation
    • Underwriting Automation
    • Weather Verification
    • Claims Automation
    • Restoration
    • INTRCONNECT
  • Mortgage Lenders

    • Origination
  • Mortgage Servicers

    • Residential Property Tax
    • Default & Loss Mitigation
    • Portfolio Insight & Monitoring
  • Mortgage Appraisers

    • Appraisal
  • Real Estate Agents & Brokers

    • Agents & Brokers
  • Real Estate MLS

    • Multiple Listing Enterprises
  • Commercial Real Estate Owners

    • Commercial Property Tax
  • Marketing Departments

    • Property Data
  • Insurance Underwriters

    • Risk Evaluation
    • Underwriting Automation
    • Hazard Risk
    • Catastrophe Risk Management
  • Insurance Risk Managers

    • Risk Evaluation
    • Hazard Risk
    • Catastrophe Risk Management
  • Insurance Claims

    • Claims Automation
    • Restoration Contractors
    • Weather Verification
  • Construction Contractors

    • Restoration Contractors
  • General

    • Location Intelligence
    • Lead Generation
    • Data Solutions
Resources
  • Reports

    • Climate Change
    • Construction Cost Update
    • Construction Insights
    • Home Price Insights
    • Homeowner Equity Insights
    • Loan Performance Insight
    • Mortgage Fraud
    • Property Tax Delinquency
    • Single-Family Rent Index
  • Insight Blogs

    • Hazard HQ
    • Office of Chief Economist
    • Affordable Housing
    • Homebuying
    • Insurance
    • Other Articles
  • More Resources

    • Case Studies
    • White Papers
    • Podcasts
    • Quick Takes

Home / Intelligence / U.S. S&P CoreLogic Case-Shiller Home Price Momentum Carries into 2021

ABOUT THE AUTHOR
Selma Hepp
Selma Hepp
Chief Economist
View Profile
  • March 30, 2021

U.S. S&P CoreLogic Case-Shiller Home Price Momentum Carries into 2021

Home price momentum further picked up speed in January, up 11.2%

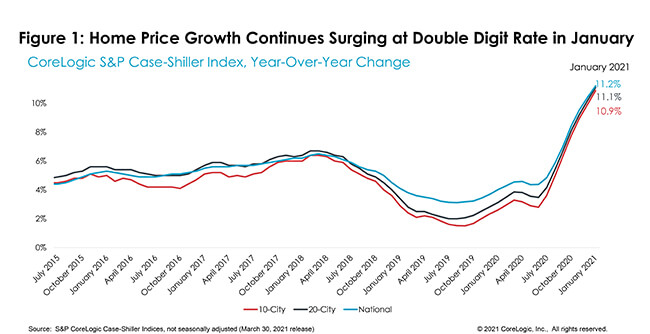
S&P CoreLogic Case-Shiller Index momentum, which picked up pace in the second half of 2020, carried over into 2021 with the index jumping at a double-digit rate for the second consecutive month at 11.2%.  The month-to-month index also increased 0.79%, making it the strongest December-to-January increase since 2005. 

The 2021 home-buying season started strong, upending the traditional slow season during winter months. Further declines in mortgage rates, which hit all-time lows at the end of December, helped carry home-purchase momentum, and also amplified demand from millennials and those seeking second homes. At the same time, inventories of for-sale homes have not shown any signs of improvement and continue to reach historical troughs. As a result, buyers have experienced one of the most competitive markets since pre-Great Recession. Additionally, January CoreLogic Case-Shiller home price increases reflect transactions that were signed in November and December when mortgage rates were continually reaching new record-lows, which may have created some urgency among buyers. Lower mortgage rates may have expanded budgets for buyers, allowing them to bid higher than they would have otherwise. As mortgage rates started creeping up in 2021 and home prices continue to increase more than 10% above last year’s levels, some buyers will face affordability constraints, which will likely slow down the price acceleration.

The 10- and 20-city composite indexes also reached double-digit growth in home prices, up 10.9% and 11.1% year over year, respectively. Both indices continue to surge at the fastest pace since early 2014, when home prices were experiencing a similar rate of quickness (Figure 1). Compared to the prior peak, the 10-city composite is now 13% higher, while the 20-city composite is 18% higher than the previous peak both indexes reached in 2006.

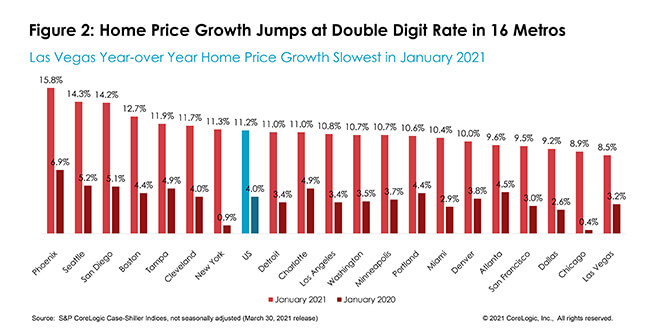
Ranking of metropolitan areas by price growth has remained consistent with previous months. For the 19th consecutive month, Phoenix continues to lead with the fastest home price growth among the 20 metro areas — logging a 15.8% jump in January, the fastest acceleration since November 2013. Seattle remained in second place, with an annual increase of 14.3%, followed by San Diego at a 14.2% increase.

Overall, 16 of the 20 cities with data available had double-digit home price growth in January. New York had the strongest acceleration in home price index compared to last January, jumping 11.3% year-over-year— a 10.3 percent points increase compared to January 2020 when the index showed a 1% annual increase.

Las Vegas, with an 8.5% annual increase, was the metro area with the slowest price growth in January. Chicago and Las Vegas have been ranking lowest in price appreciation in recent months’ releases, though Chicago’s recent price growth is also significantly 8.5 percentage points higher than a year ago. Detroit, which has been missing in recent reports, logged an 11% annual increase in home prices in January (Figure 2).

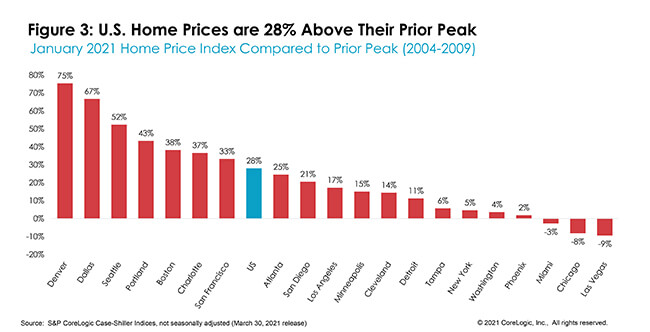
In January, the national home price index was 28% higher than the pre-Great Recession peak in July 2006.  But, after adjusting for prices of all other goods, the national index was 3% above this level.

Three cities remain below their previous peaks: Las Vegas, Chicago and Miami. Phoenix prices have now recovered above their prior peak and are now 2% higher. Las Vegas, with some recent slowdown in home price acceleration compared to other metro areas, is still 9% below its previous peak. By contrast, Denver’s prices have leapt 75% above its 2006 peak, followed by Dallas at 67% (Figure 3).

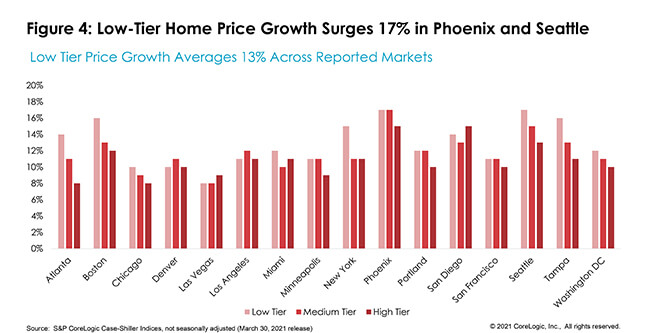
Prices of homes in the lower one-third of the price distribution jumped on average 12.8% in January, the strongest growth among the three tiers as diminishing inventories and demand from millennials and investors keep pressure on the prices. The largest home price increases in lower one-third were in Phoenix and Seattle, both up 17%, followed by 16% increases in Boston and Tampa, Florida.

The average growth among medium-tier priced homes was 11.6%, and prices in the highest-tier were up 10.8% on average. Medium- and high-tier homes have had faster pick-up in acceleration since the onset of the pandemic, when high-tier prices had the highest acceleration with 7.2 percentage points, compared to a 5.6 percentage point increase among low tiers. San Diego and Phoenix both had 15% increases in home prices in the high tier, while only Atlanta, Las Vegas and Minneapolis had single-digit increases in the high tier (Figure 4).

While double-digit home price growth has raised concerns about its sustainability, affordability crunch resulting from strong home price growth and higher mortgage rates will discourage some potential home buyers out of the market. As a result, slowing competition is likely to take some wind out of the market’s sails, slowing the home price growth rate by about a half by the end of the year. However, the mortgage rates are still low from the historical perspective and are about 10 basis points lower than March of last year, which will continue to be a boost for home buying activity. As COVID-19 restrictions ease and economic recovery picks up, the 2021 market will result in solid home-buying activity likely to outpace 2020.   

The larger concern remains around availability of for-sale homes. Even as sellers are likely to feel more comfortable listing their homes as vaccinations increase, they are still facing the dilemma of too-few homes on the market, while also facing higher home prices and mortgage rates. At the same time, with the overall higher cost of construction materials due to the pandemic, it has become increasingly difficult to build affordably priced homes. As a result, inventory of new homes for sale will constrain the full potential of home sales activity in 2021.

© 2021 CoreLogic, Inc., All rights reserved.

  • Category: Home Price Insights, Intelligence, Reports
  • Tags: Case Shiller Index, Home Value
ABOUT THE AUTHOR
Selma Hepp
Selma Hepp
Chief Economist
View Profile

Related Posts

Turkey Syria Earthquake
Hazard HQ

M7.5 – 7.8 Earthquake Sequence Near Turkey-Syria Border

A sequence of powerful earthquakes struck near the Turkey-Syria border, with three of the earthquakes registering magnitudes exceeding 6.5.

February 7, 2023
Dec2022HPIPromo
Blogs

U.S. Home Price Insights – February 2023

U.S. home prices continued to slow on a year-over-year basis in December 2022, moving down to 6.9%.

February 7, 2023
Jan23CSIPromo
Home Price Insights

US CoreLogic S&P Case-Shiller Index Growth Rate Cools Further in November, Up by 7.7%

Annual U.S. home price growth continued to relax in November for the seventh straight month.

January 31, 2023

About Corelogic

  • Newsroom
  • Leadership
  • Careers
  • Ethics & Compliance

Accounts

  • Products Sign-in

Contact

  • Sales Contact
  • Product Support

Regions

  • CoreLogic Australia
  • CoreLogic New Zealand
  • CoreLogic UK

Follow & Connect

  • Facebook
  • Instagram
  • Linkedin
  • Twitter
  • YouTube
© 2023 CoreLogic. All rights reserved.
  • Legal
  • Privacy Policy
  • CCPA
  • Security
  • Sitemap
  • Accessibility
  • Legal
  • Privacy Policy
  • CCPA
  • Security
  • Sitemap
  • Accessibility