Chat
Chat with Sales Hours: Monday-Friday 8:30 a.m. - 4:30 p.m. (CST)
Contact Sales
Call Sales Toll-Free 1-(866) 774-3282 Hours: Monday-Friday 7 a.m. - 5 p.m. (CST)
Product Login
Product Log-in
Product Support
Product Support
Email Sales
Contact Sales
After Hours
  • Support
  • Sign In Sign In
  • AUS NZ UK
CoreLogic - Home
  • Solutions
    view solutions by:

    Data Solutions

    • Lead Generation
    • Property Data
    • Location Intelligence

    Real Estate

    • Multiple Listing Enterprise
    • Agent & Broker

    Mortgage

    • Origination
    • Servicing
    • Appraisal
    • Commercial Property Tax

    Insurance

    • Hazard Risk
    • Catastrophe Risk Management
    • Risk Evaluation
    • Underwriting Automation
    • Weather
    • Claims Automation
    • Restoration
    • INTRCONNECT

    Mortgage Lenders

    • Origination

    Mortgage Servicers

    • Residential Property Tax
    • Default & Loss Mitigation
    • Portfolio Insight & Monitoring

    Mortgage Appraisers

    • Appraisal

    Real Estate Agents & Brokers

    • Agents & Brokers

    Real Estate MLS

    • Multiple Listing Enterprises

    Commercial Real Estate Owners

    • Commercial Property Tax

    Marketing Departments

    • Property Data

    Insurance Underwriters

    • Risk Evaluation
    • Underwriting Automation
    • Hazard Risk
    • Catastrophe Risk Management

    Insurance Risk Managers

    • Risk Evaluation
    • Hazard Risk
    • Catastrophe Risk Management

    Insurance Claims

    • Claims Automation
    • Restoration Contractors
    • Weather Verification

    Construction Contractors

    • Restoration Contractors

    General

    • Location Intelligence
    • Lead Generation
    • Data Solutions
  • Resources

    Reports

    • Climate Change
    • Construction Cost Update
    • Construction Insights
    • Home Price Insights
    • Homeowner Equity Insights
    • Loan Performance Insight
    • Mortgage Fraud
    • Property Tax Delinquency
    • Single-Family Rent Index

    Insight Blogs

    • Hazard HQ
    • Office of Chief Economist
    • Affordable Housing
    • Homebuying
    • Insurance
    • Other Articles

    More Resources

    • Events
    • Case Studies
    • White Papers
    • Podcasts
    • Quick Takes
  • Company
    • About
    • Leadership
    • Newsroom
    • Contact
    • Careers
  • Search
CoreLogic - Home
  • Solutions
  • Resources
  • Company

    • About
    • Leadership
    • Newsroom
    • Contact
    • Careers
  • Accounts

    • Products Sign-in
  • Contact

    • Sales Contact
    • Product Support
  • Regions

    • Australia
    • New Zealand
    • United Kingdom
  • Social

    • Facebook
    • Instagram
    • Linkedin
    • Twitter
    • Youtube
Solutions
VIEW BY:
  • Data Solutions

    • Lead Generation
    • Property Data
    • Location Intelligence
  • Real Estate

    • Multiple Listing Enterprise
    • Agent & Broker
  • Mortgage

    • Origination
    • Servicing
    • Appraisal
    • Commercial Property Tax
  • Insurance

    • Hazard Risk
    • Catastrophe Risk Management
    • Risk Evaluation
    • Underwriting Automation
    • Weather
    • Claims Automation
    • Restoration
    • INTRCONNECT
  • Mortgage Lenders

    • Origination
  • Mortgage Servicers

    • Residential Property Tax
    • Default & Loss Mitigation
    • Portfolio Insight & Monitoring
  • Mortgage Appraisers

    • Appraisal
  • Real Estate Agents & Brokers

    • Agents & Brokers
  • Real Estate MLS

    • Multiple Listing Enterprises
  • Commercial Real Estate Owners

    • Commercial Property Tax
  • Marketing Departments

    • Property Data
  • Insurance Underwriters

    • Risk Evaluation
    • Underwriting Automation
    • Hazard Risk
    • Catastrophe Risk Management
  • Insurance Risk Managers

    • Risk Evaluation
    • Hazard Risk
    • Catastrophe Risk Management
  • Insurance Claims

    • Claims Automation
    • Restoration Contractors
    • Weather Verification
  • Construction Contractors

    • Restoration Contractors
  • General

    • Location Intelligence
    • Lead Generation
    • Data Solutions
Resources
  • Reports

    • Climate Change
    • Construction Cost Update
    • Construction Insights
    • Home Price Insights
    • Homeowner Equity Insights
    • Loan Performance Insight
    • Mortgage Fraud
    • Property Tax Delinquency
    • Single-Family Rent Index
  • Insight Blogs

    • Hazard HQ
    • Office of Chief Economist
    • Affordable Housing
    • Homebuying
    • Insurance
    • Other Articles
  • More Resources

    • Events
    • Case Studies
    • White Papers
    • Podcasts
    • Quick Takes

Home / Intelligence / U.S. S&P CoreLogic Case-Shiller Index Momentum Continues, up 19.7%

ABOUT THE AUTHOR
Selma Hepp
Selma Hepp
Chief Economist
View Profile
  • September 28, 2021

U.S. S&P CoreLogic Case-Shiller Index Momentum Continues, up 19.7%

Migration of coastal residents with larger budgets to affordable metros keeps pushing home price growth higher

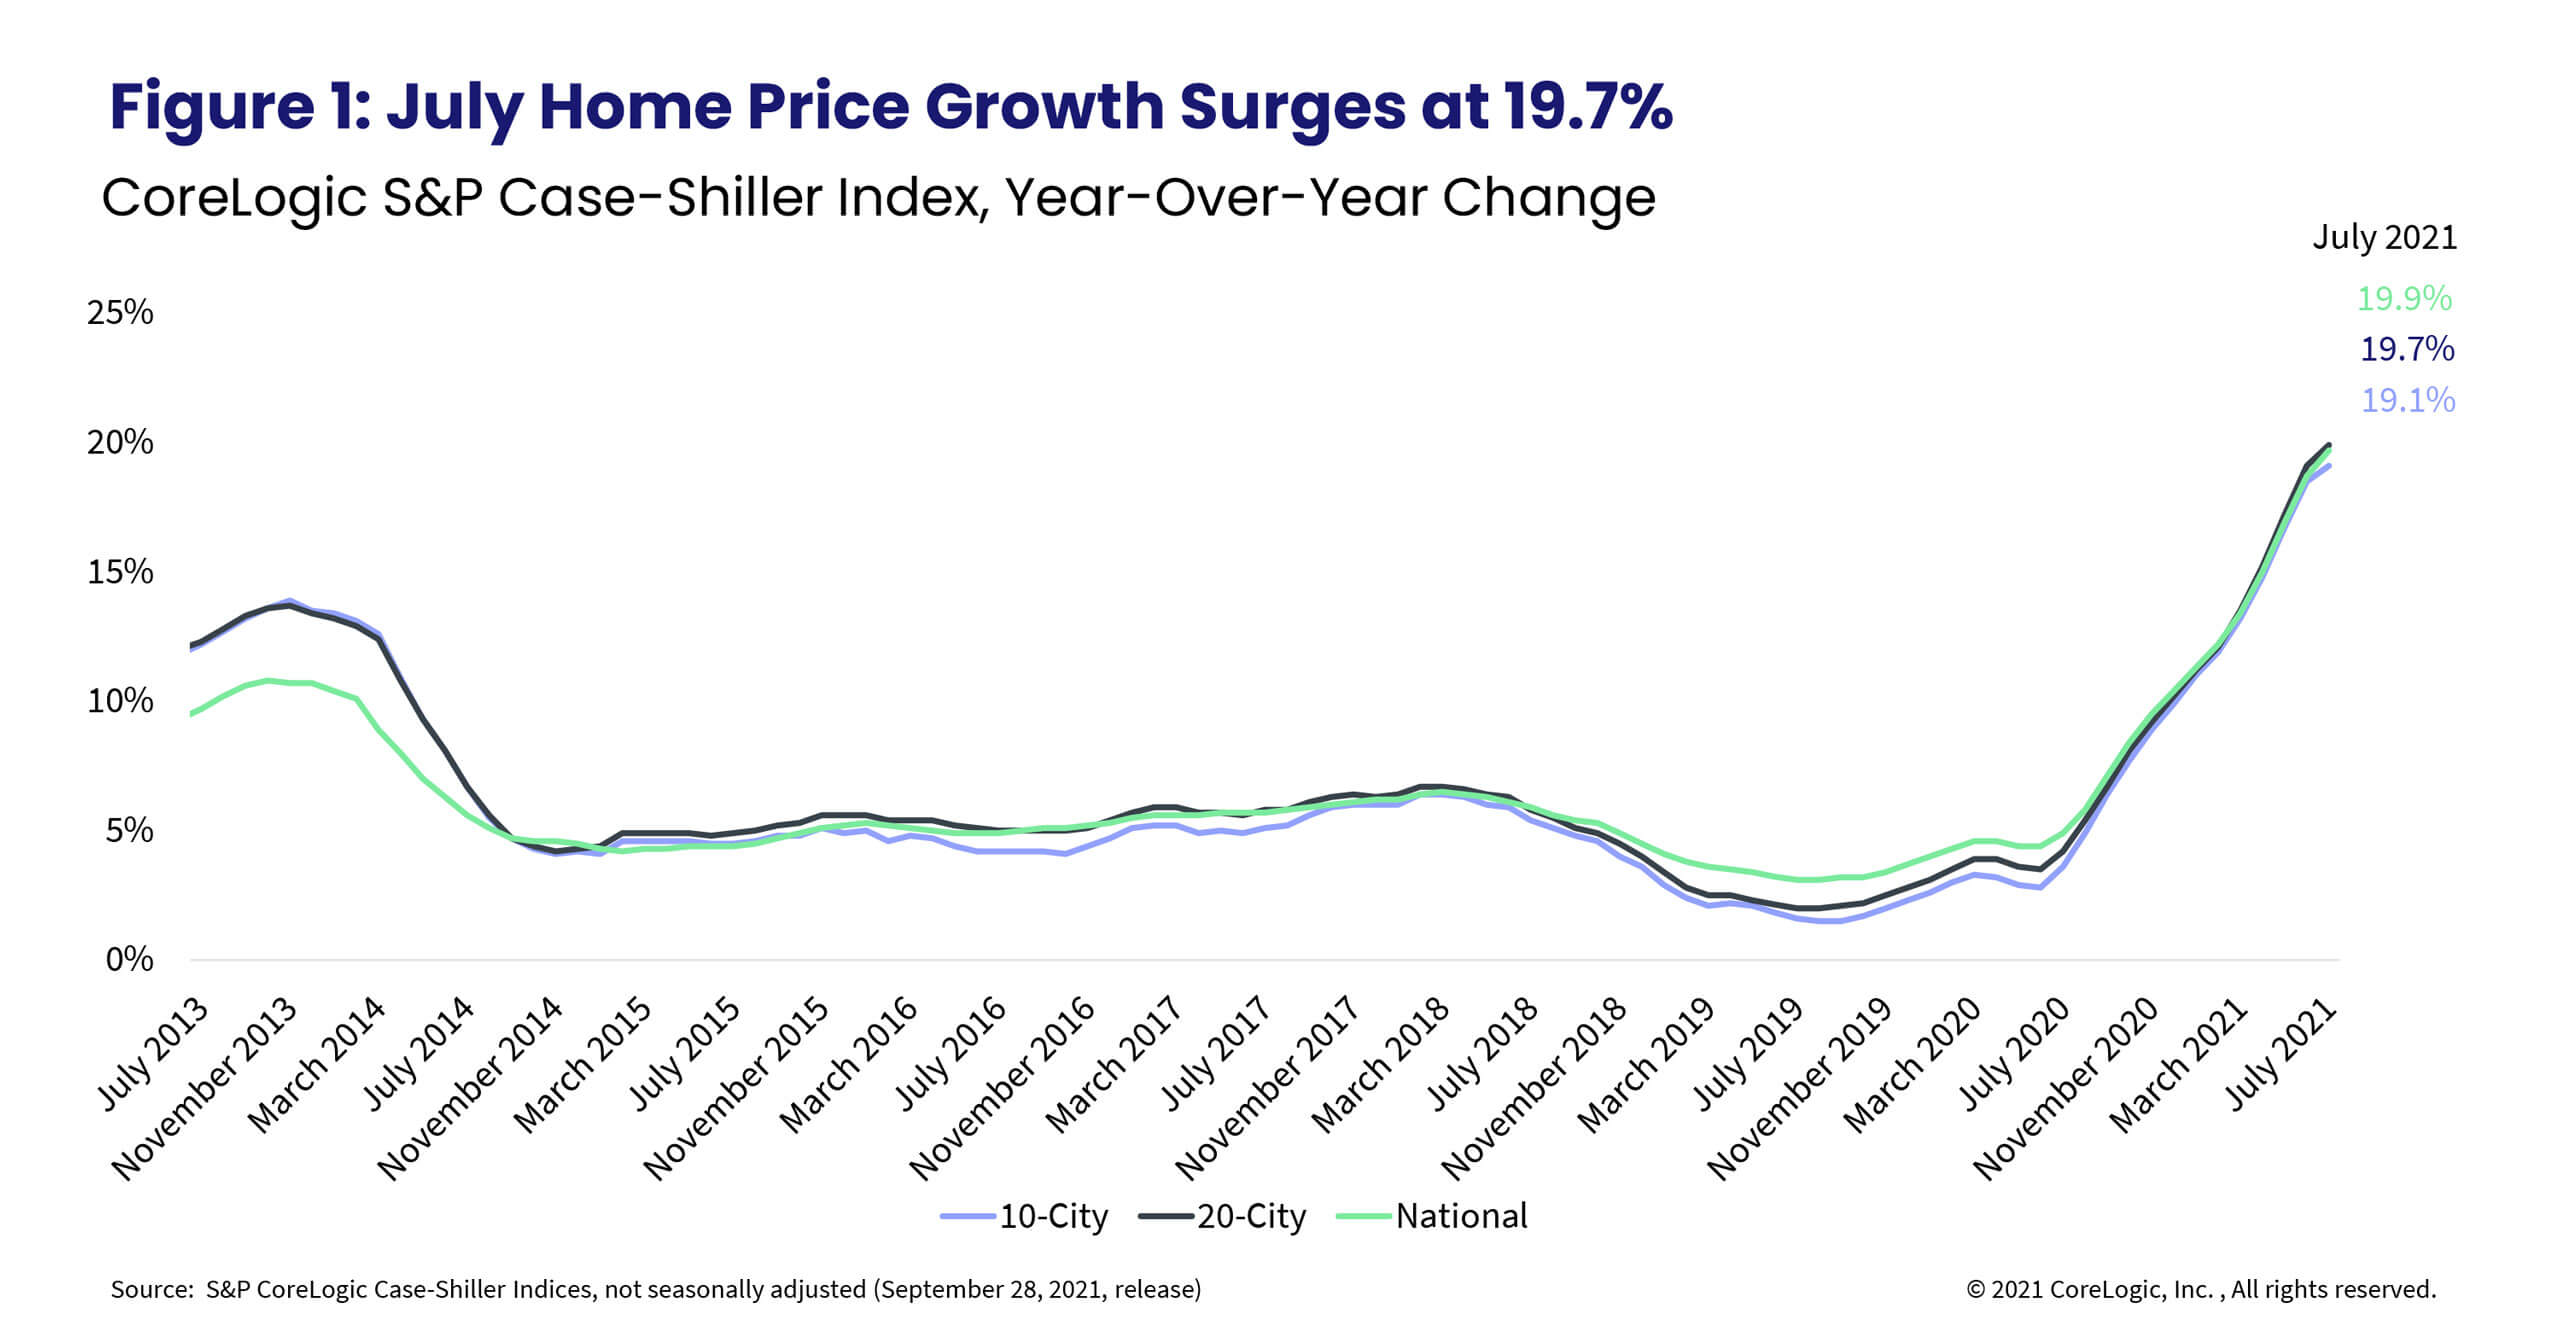
Summer’s red-hot housing markets are echoed in the latest S&P CoreLogic Case-Shiller Index, which accelerated to a new record high — up 19.7% year over year. The month-to-month index, up 1.62%, showed persistence in monthly increases and also accelerated at the fastest June-to-July rate since the inception of the data series.

There’s a surge of millennials approaching the prime home-buying age and are experiencing more flexibility to expand their search locations. Additionally, there are move-up buyers with larger budgets who are relocating to more affordable areas where they’re financially able to outbid local residents. Taken together, these factors have created a double whammy for home price growth. Homebuyers across all ages continue to enjoy historically low mortgage rates but have now also been joined by an influx of investor buyers over the summer. This continued high buyer demand has even outstripped the improvements in the supply of for-sale homes from the all-time lows experienced in the spring.

Market heat indicators, such as days on market, share of homes selling over the asking price and sale price premiums, all pointed to no sign of relief over the summer. By the end of the season, some indicators suggested the housing market might cool, but not more than seasonally expected. Still, buyer fatigue is likely to set in and take some wind out of the fierce market competition which will likely lead to home price growth slowing.

The 10- and 20-city composite indexes also maintained the momentum, up 19.1% and 19.9% year over year, respectively. This is the fastest growth rate for the 10-city index since 2004 while the 20-city index has never recorded such a strong home price increase (Figure 1). The faster acceleration of the 20-city index compared to the 10-city index illustrates the rapid price growth seen in smaller, more affordable metros where in-migration from coastal residents has been pushing home price growth to new highs. Compared to the 2006 peak, the 10-city composite is now 26% higher, while the 20-city composite is 32% higher.

Figure 1: July Home Price Growth Surges at 19.7%

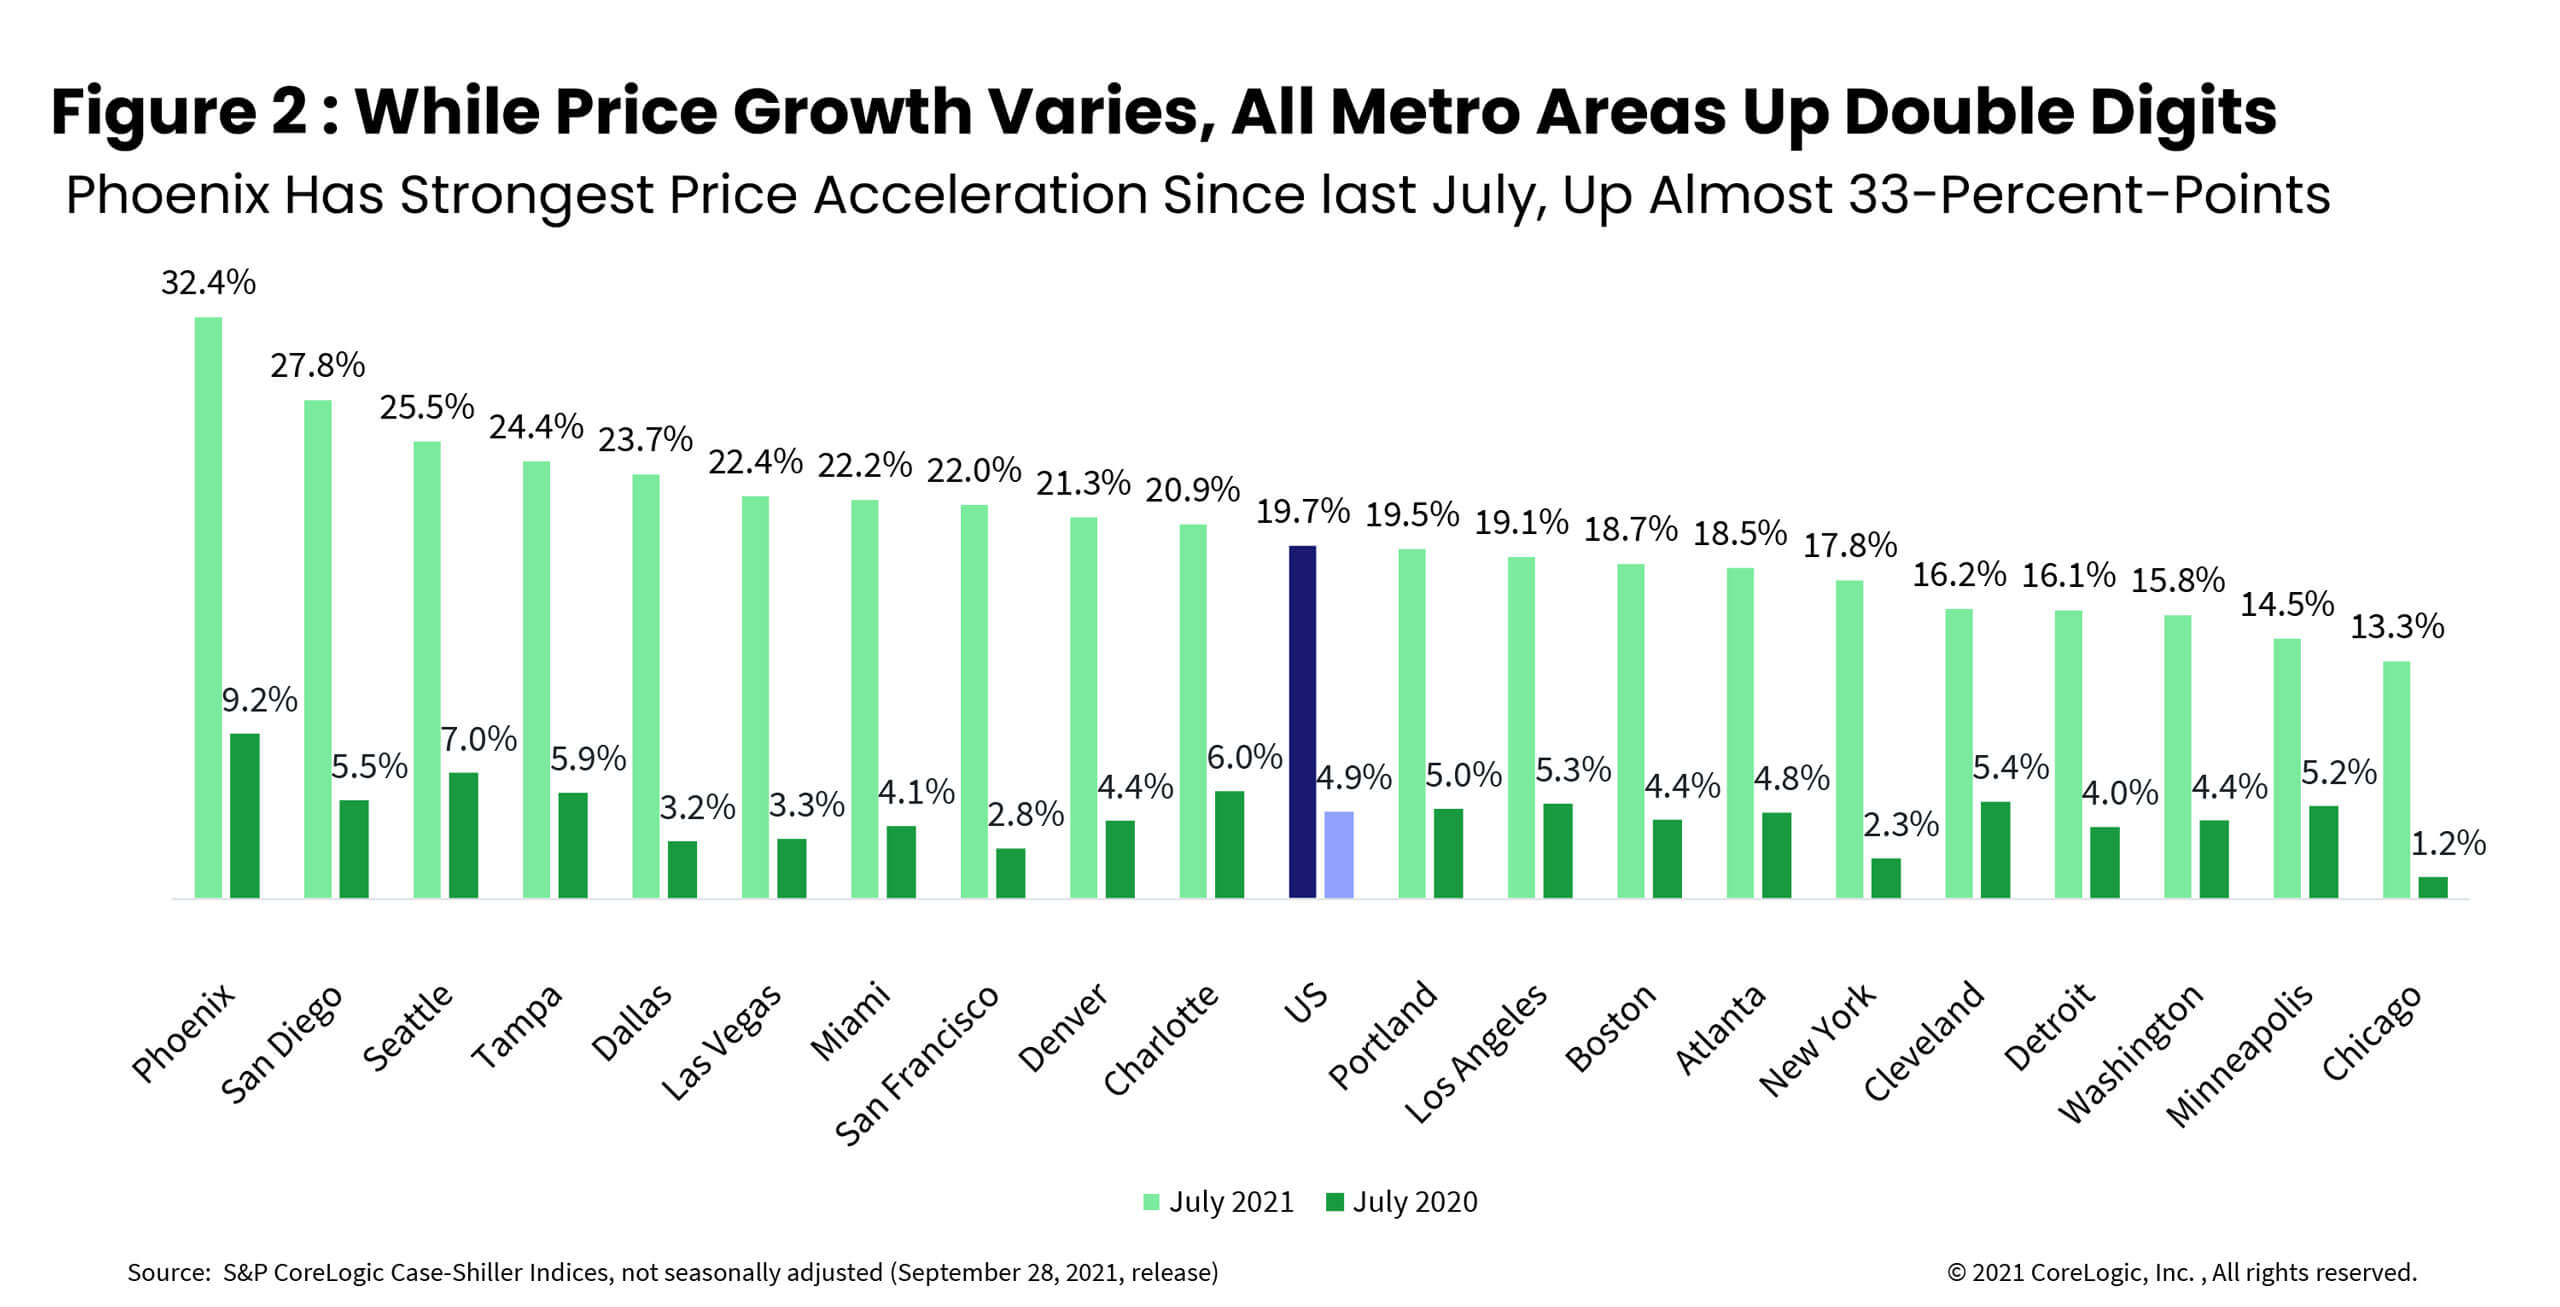
For the 25th consecutive month, Phoenix maintained the strongest home price growth among the 20 markets, surging 32.4% in July, the fastest acceleration since the spring of 2006 and 23-percentage points higher than last July’s growth. There has been very little change in the ranking of metropolitan areas by price growth over the last year.

San Diego remained in second place for the strongest home price growth, with an annual acceleration of 27.8%, and a larger jump of over 22-percentage points from last July. Seattle, in third place, had a 25.5% jump in July.

Chicago (up 13.3%) and Minneapolis (up 14.5%) continued to lag despite both experiencing double-digit growth. Chicago has been ranking the lowest in price appreciation in the past five months’ releases with no change in price growth compared to June. However, Minneapolis had the slowest acceleration in price growth compared to last year (Figure 2).

Figure 2 : While Price Growth Varies, All Metro Areas Up Double Digits

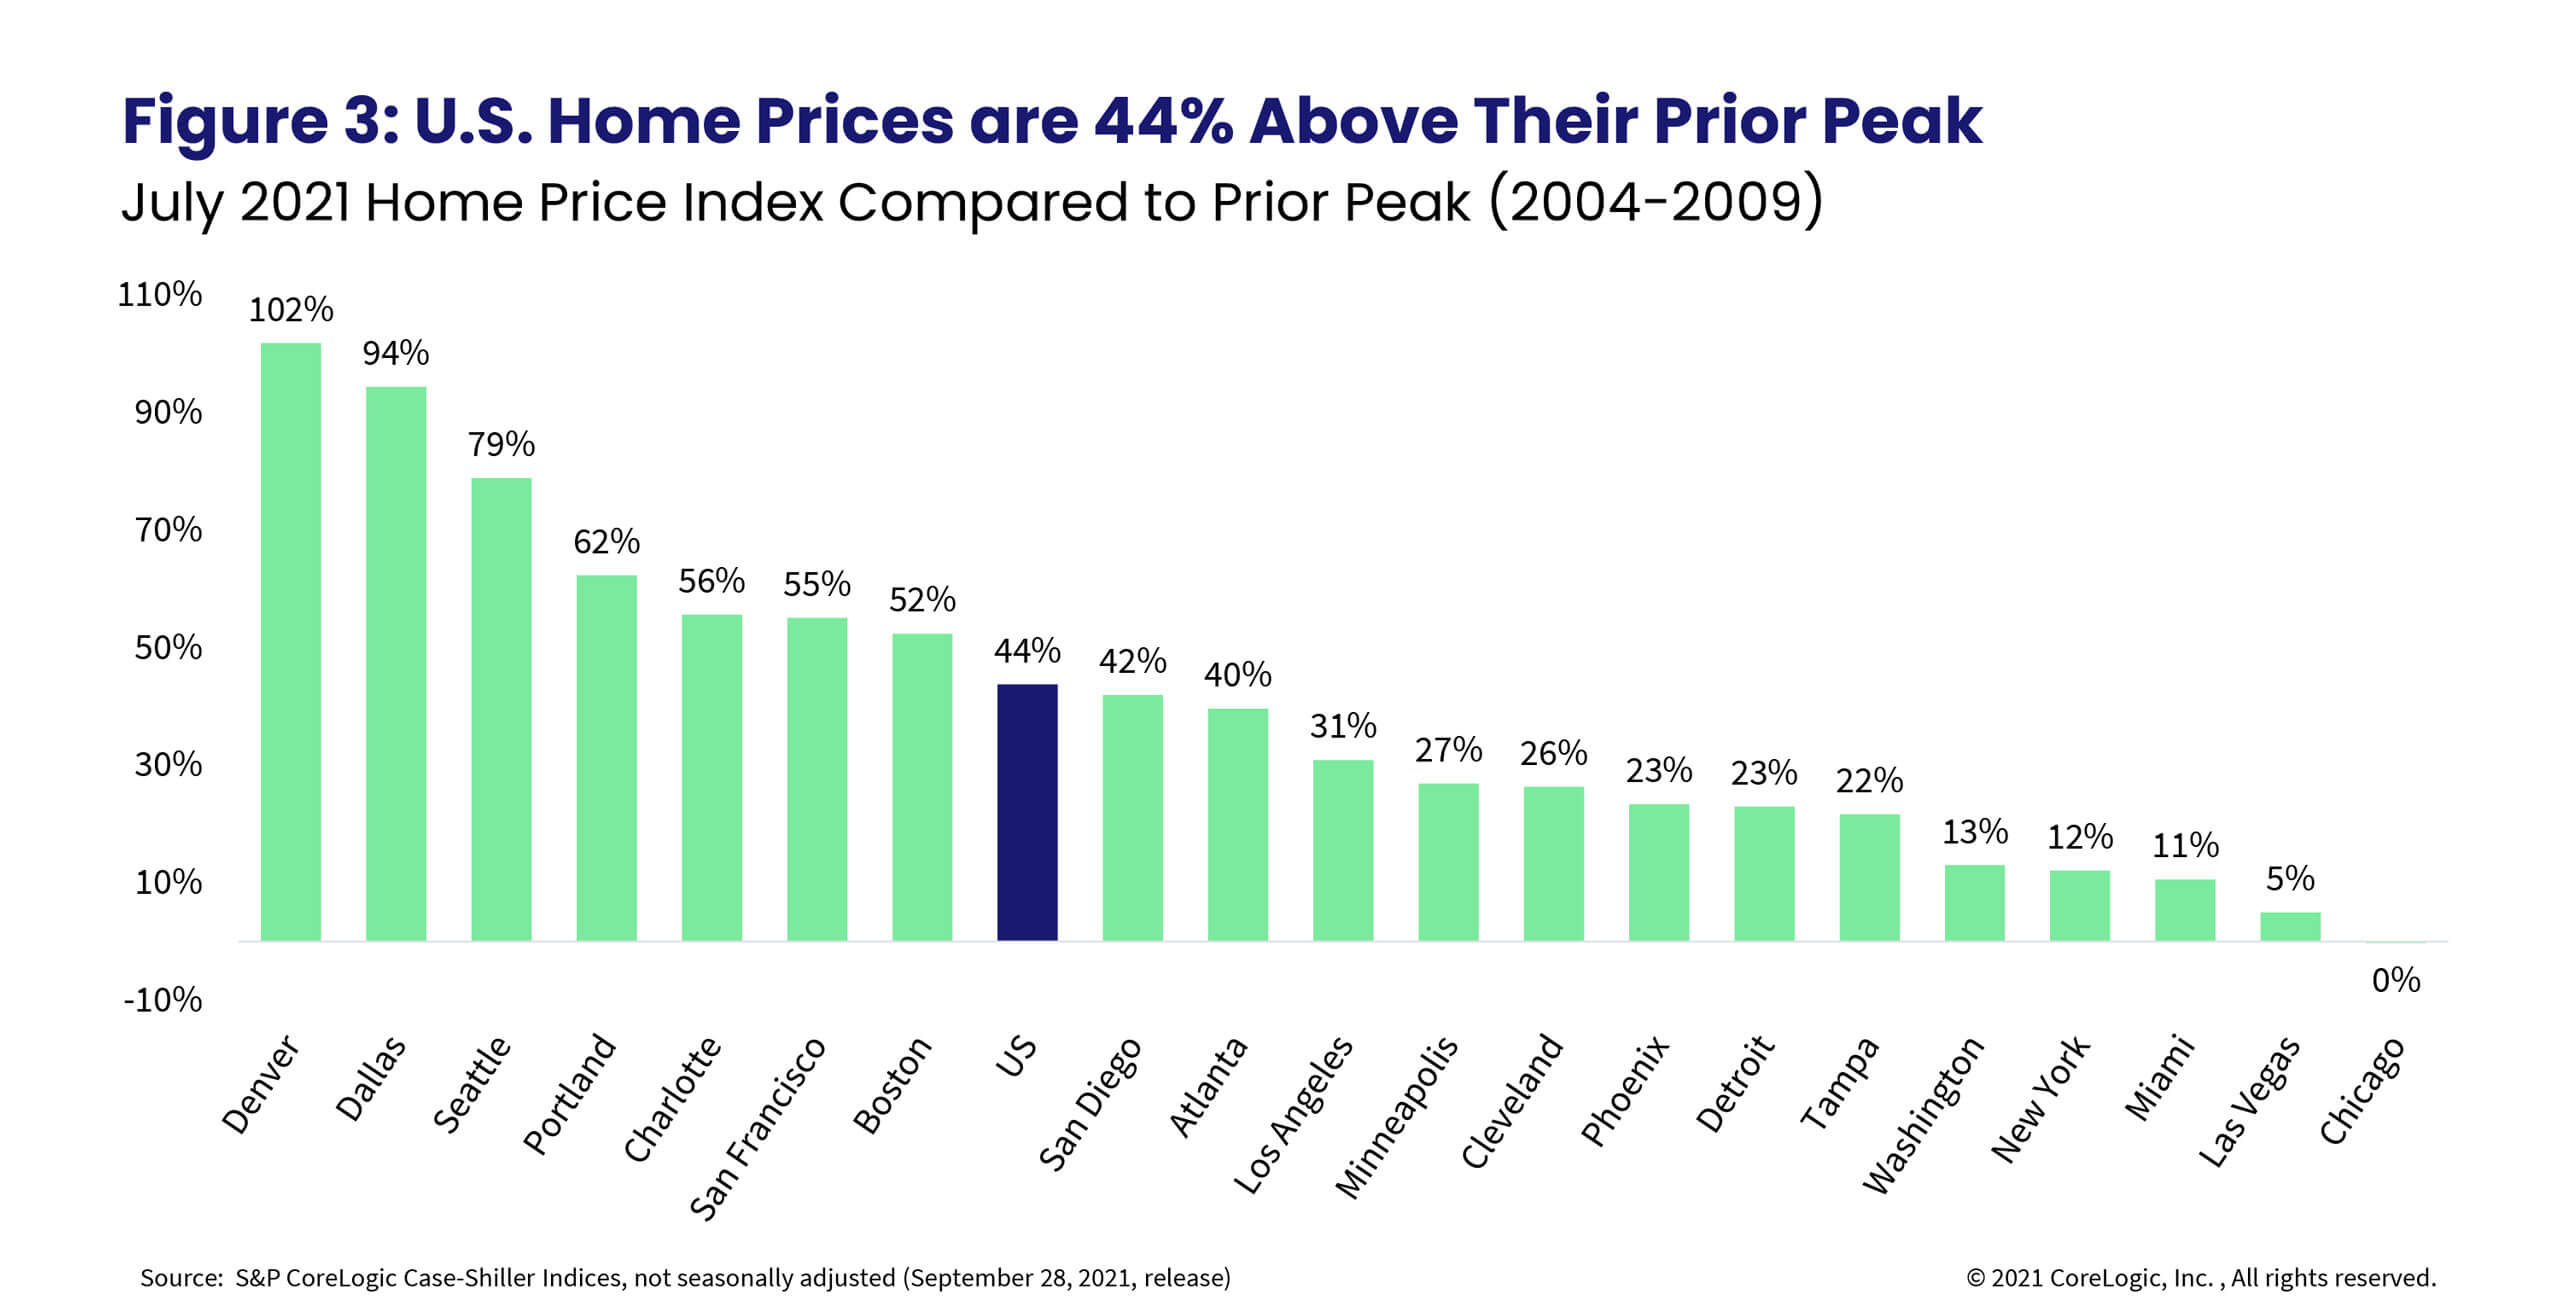
In July, national home prices were 44% higher than the previous peak. All metros are now at or above their previous peaks. Chicago has finally caught up with its previous peak while Denver’s prices have leapt 102% above its 2006 peak, followed by Dallas at 94% (Figure 3). Nonetheless, while nominal prices have surpassed previous levels, national home prices are only 10% above the previous peak when adjusted for inflation.

Figure 3: U.S. Home Prices Are 44% Above Their Prior Peak

The low tier and high tier home price growth converged in July with both tiers recording 21.2% annual growth. However, the middle tier recorded a somewhat smaller 20.7% year-over-year increase. This convergence occurred as demand for homes in all price segments remains strong, and is particularly due to heightened demand for higher-end homes since last summer and continued competition for entry-level homes in the low tier. The demand for homes in the low tier is again bolstered by an influx of investors whose activity surged during the spring months and remains elevated. Also, note that high tier price growth is at the highest rate recorded in the data.

Lastly, the month-to-month changes in home price growth by price tier and location reveal the recent relative desirability of metro areas and purchase power of the buyers.

The largest home price increase in the lower one-third price tier remains in Phoenix, up 4% from June to July, followed by Atlanta at 2.8% and Las Vegas and Miami both at 2.6%. Compared to monthly growth rates recorded in April, Miami, Phoenix and Atlanta have had the strongest acceleration among low price tiers.

In the high tier, Phoenix was in the lead with a 3.2% increase followed by a 2.9% increase in Tampa, Florida, and Las Vegas. The Washington metro has experienced some weakening in monthly acceleration rates compared to earlier in the year, and among metros within the high tier, it ranks the lowest for monthly growth rates.

Interestingly, in Las Vegas and San Diego, the high tier is accelerating at a faster pace than lower tiers as again, an influx of buyers with larger budgets keep propping demand for higher-end homes .

In summary, this summer seemed to mark a peak of home buying activity not seen since the pre-Great Recession. Nevertheless, while it may naturally be worrisome to see the same type of home buyer frenzy as the time leading up to the Great Recession, there are many different circumstances to keep in mind. The current rapid rise in home price appreciation appears to be driven by different mobility opportunities not necessarily seen pre-Great Recession. Namely, with being able to work from home, households from expensive coastal areas are moving to more affordable places and also bringing with them higher price expectations that they are willing to pay. As a result, larger budgets of incoming residents are pushing home price growth beyond rates previously recorded. While the continued price growth may seem unsustainable, continued migration from pricier coastal areas may continue pushing home price growth higher. Still, with inventories likely seeing some respite and buyer fatigue, acceleration is likely to take a step back by the end of this year but remain in double digits through the remainder of 2021.

©2021 CoreLogic, Inc. , All rights reserved.

  • Category: Home Price Insights, Intelligence, Reports
  • Tags: Case Shiller Index
ABOUT THE AUTHOR
Selma Hepp
Selma Hepp
Chief Economist
View Profile

Related Posts

Header Intelligence Protect storm HHQ hazard
Climate Change

2023 Severe Convective Storm Risk Report

As rising global temperatures continue to contribute to increasingly hazardous wildfire seasons, it is more important than ever for homeowners, insurers, and governments to understand the risk these hazards pose to their communities.

March 31, 2023
Construction worker framing a house
Construction Insight

Quarterly Construction Insights – Q1 2023

CoreLogic tracks construction cost for commercial, residential and agricultural construction of all types of goods (labor and materials) throughout the United States and Canada.

March 30, 2023
Jan23LPIPromo
Blogs

Loan Performance Insights – March 2023

U.S. mortgage delinquency and foreclosure rates continued to hold near record lows in January.

March 30, 2023

About Corelogic

  • Newsroom
  • Leadership
  • Careers
  • Ethics & Compliance

Accounts

  • Products Sign-in

Contact

  • Sales Contact
  • Product Support

Regions

  • CoreLogic Australia
  • CoreLogic New Zealand
  • CoreLogic UK

Follow & Connect

  • Facebook
  • Instagram
  • Linkedin
  • Twitter
  • YouTube
© 2023 CoreLogic. All rights reserved.
  • Legal
  • Privacy Policy
  • CCPA
  • Cookie Preferences
  • Security
  • Sitemap
  • Accessibility
  • Legal
  • Privacy Policy
  • CCPA
  • Cookie Preferences
  • Security
  • Sitemap
  • Accessibility