Despite recent price declines, annual average home price growth for 2022 was the second highest on record
With a full year of data, the S&P CoreLogic Case-Shiller Index once again proved that 2022 was an incredibly volatile year for the housing market, which experienced both historic highs and historic lows in a matter of months.
In December, the CoreLogic S&P Case-Shiller Index posted a 5.8% year-over-year increase, down from a 7.6% gain in November, marking the eight straight month of decelerating annual home price gains. With the quick decline in home price growth over the year, December’s annual gain was the slowest since August 2020 (Figure 1).
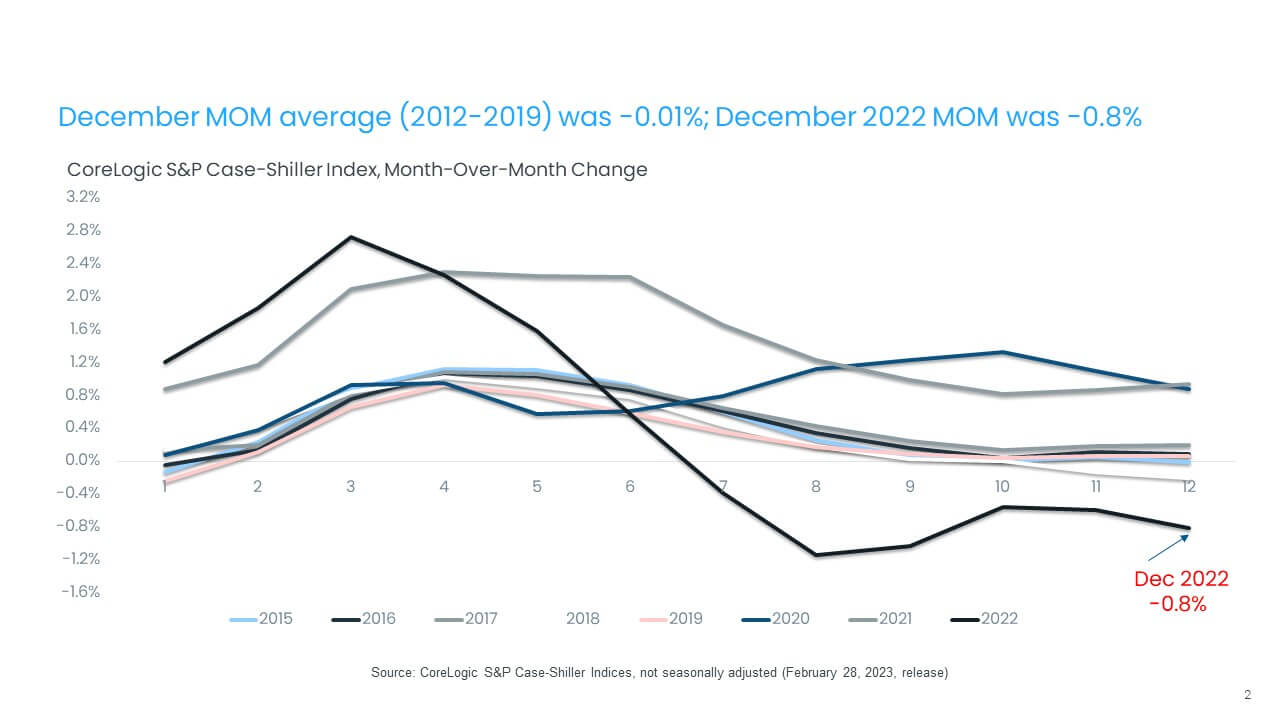
In addition, the non-seasonally adjusted month-to-month index posted its sixth consecutive month of declines, down by 0.8% in December from a 0.6% decrease in November. Between 2012 and 2019, the monthly index changes from November to December have been generally flat, averaging about a -0.01% decline (Figure 2). Monthly decreases began to slow in the summer of 2022, after the initial mortgage rate shock, but they picked back up in December, reflecting November’s peak mortgage rates. Cumulatively, home prices in the national index are down by 4.4% from 2022’s high point.
While annual gains are still positive, further slowing of price growth, and according CoreLogic’s Home Price Index forecast, will lead to the S&P CoreLogic Case-Shiller Index posting annual declines by the spring of 2023. Also, barring some unexpected changes in the housing market, the peak-to-trough decline is expected to reach about 8% nationally.
Again, some markets will see more significant price declines in 2023, though decreases are expected to remain regionalized and specific to metro areas that saw relatively more price growth during the pandemic. Based on CoreLogic’s latest HPI, 17 metro areas recorded year-over-year price declines in December, with most of them located in California and pandemic boomtowns such as Coeur d’Alene, Idaho; Boise, Idaho and Reno, Nevada.
The 10- and 20-city composite indexes followed the same decelerating trend in December— up by 4.4% and 4.6% year over year, respectively. And while the overall trend of stronger price gains in smaller markets continued to drive the 20-city index’s growth, slowing appreciation was slightly more evident in those metros, as they tend to include more affordable markets that are being hit harder by declining buyer purchasing power. The 10-city index is down by 5.9% since last spring’s peak, while the 20-city index declined from its 6.2% peak in December.
Compared with the 2006 peak, the 10-city composite price index is now 37% higher, while the 20-city composite is up by 45%. Adjusted for inflation, which continues to remain concerningly elevated, the 10-city index is now down by 4%, while the 20-city index is up by 1% compared with its 2006 high point.
Figure 1: December Home Price Gains Were the Slowest Since August 2020
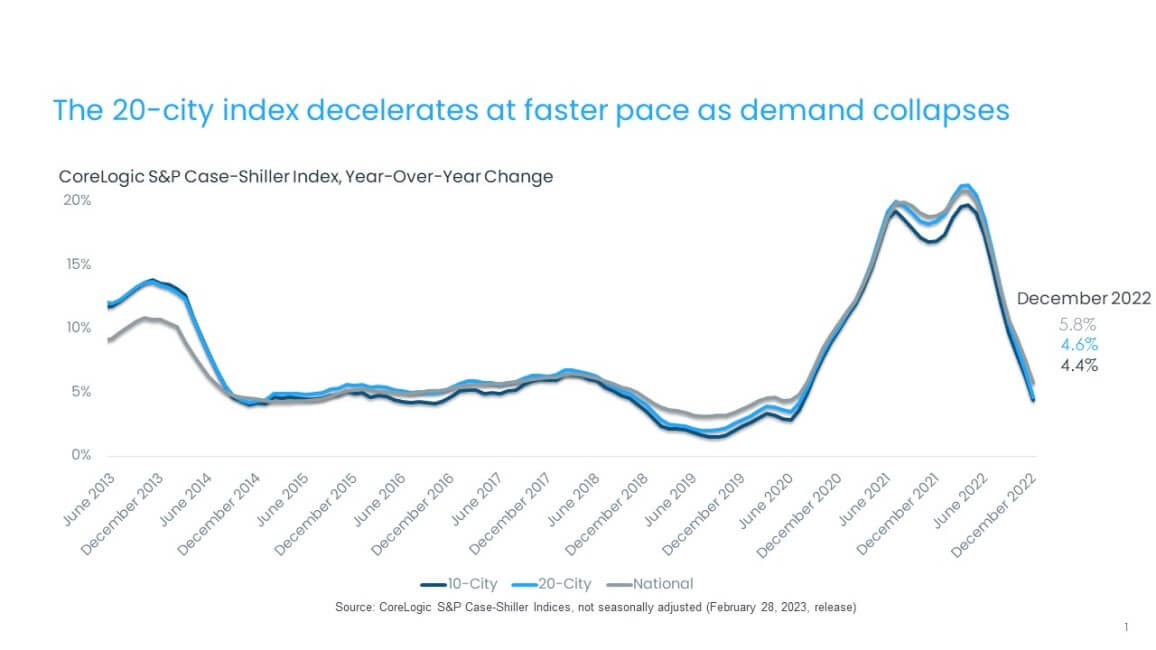
Figure 2: Month-Over-Month Price Declines Pick Up in December With High Mortgage Rates
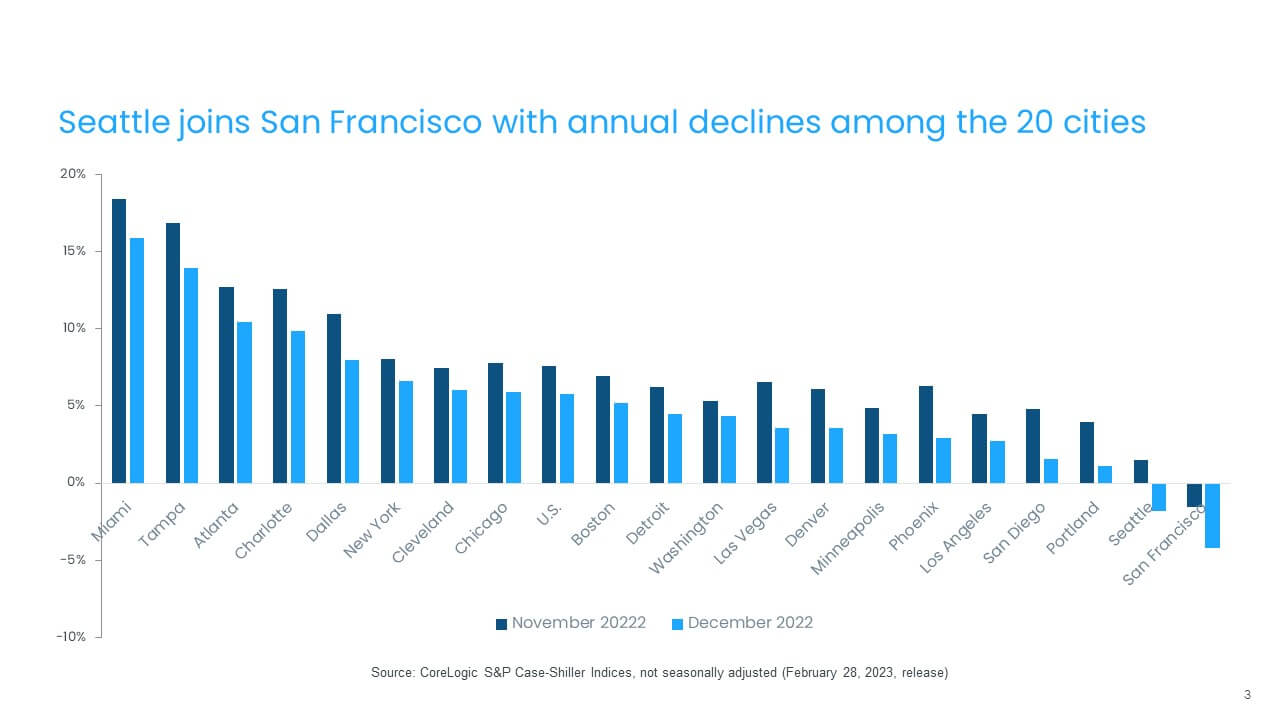
Despite the rapid slowing of the national index to single-digit growth, there are still a few metros that posted double-digit increases. Miami again recorded the strongest annual home price growth among the 20 tracked markets for the fifth straight month, increasing by 15.9% in December but down from November’s non-seasonally adjusted rate of 18.4%. Tampa, Florida again ranked second, recording a 13.9% year-over-year gain in December, down from 16.8% in November.
Atlanta posted the third-highest increase, at 10.4% in December. Charlotte, North Carolina, with a 10% gain, rounded out the metros that continued to post double-digit annual increases in December. San Francisco and Seattle both showed annual declines, down by a respective 4.2 and 1.8% in December. Some of the other markets near the bottom for price growth are San Diego and Phoenix, both of which posted around 30% gains earlier in 2022.
In December, all 20 metros continued to experience decelerating annual gains (Figure 3). Phoenix and Seattle posted the largest monthly price drops, both down by about 3.3 percentage points. San Diego showed the third-largest slowdown, down by 3.2 percentage points, followed by Dallas, which was down by 3 percentage points since November. Washington, Cleveland and New York saw the smallest declines in year-over-year home price gains compared with November.
Figure 3: Deceleration in Year-Over-Year Home Price Growth Seen in All 20 Metros
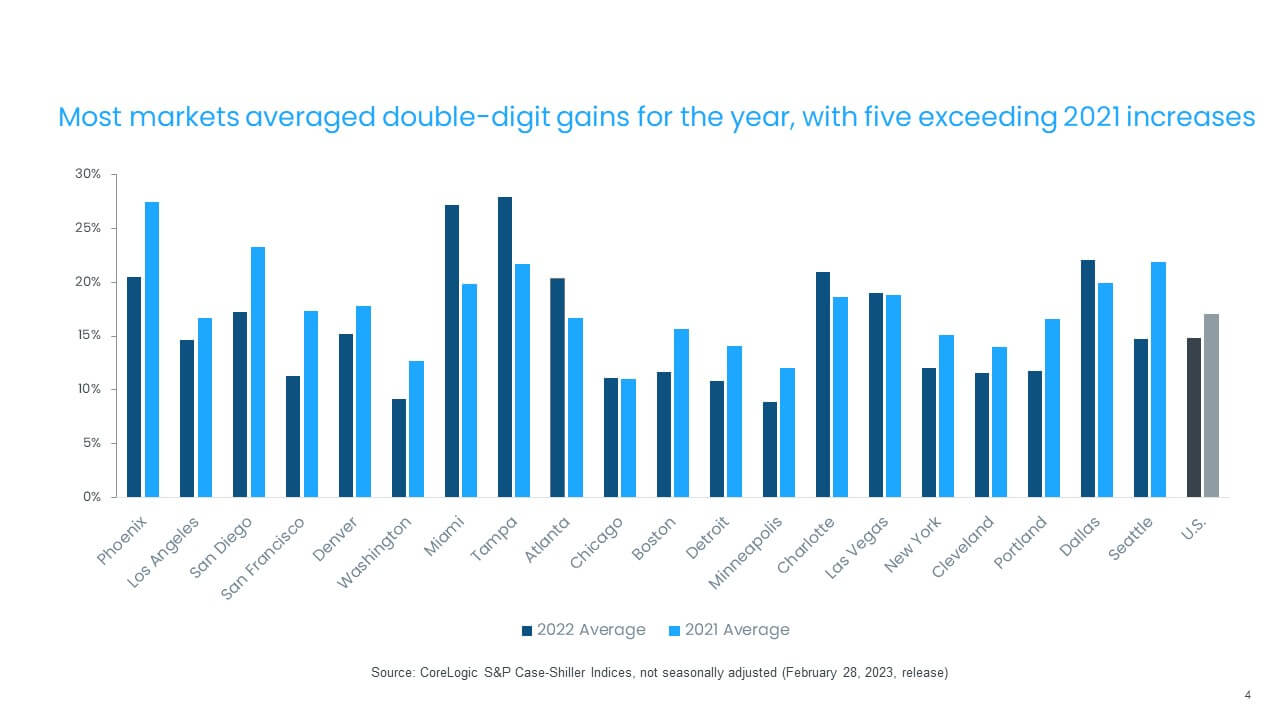
The full data for 2022 also illustrates the volatility in numbers seen over the year. Given the rapid rate of appreciation in the early months of the year, the national average annual gain in 2022 was 15%, still the second highest following 2021 with its record high of 17%, and more than four times higher than the 3.5% increase recorded in 2019.
In addition, there are a few markets with annual growth close to 30% for the 2022 average, such as Miami and Tampa. Most other tracked markets also recorded strong double-digit increases, while Minneapolis and Washington are the two metros with the lowest gains.
Figure 4: At 15%, 2022 Average Annual Growth Was Still the Second Highest
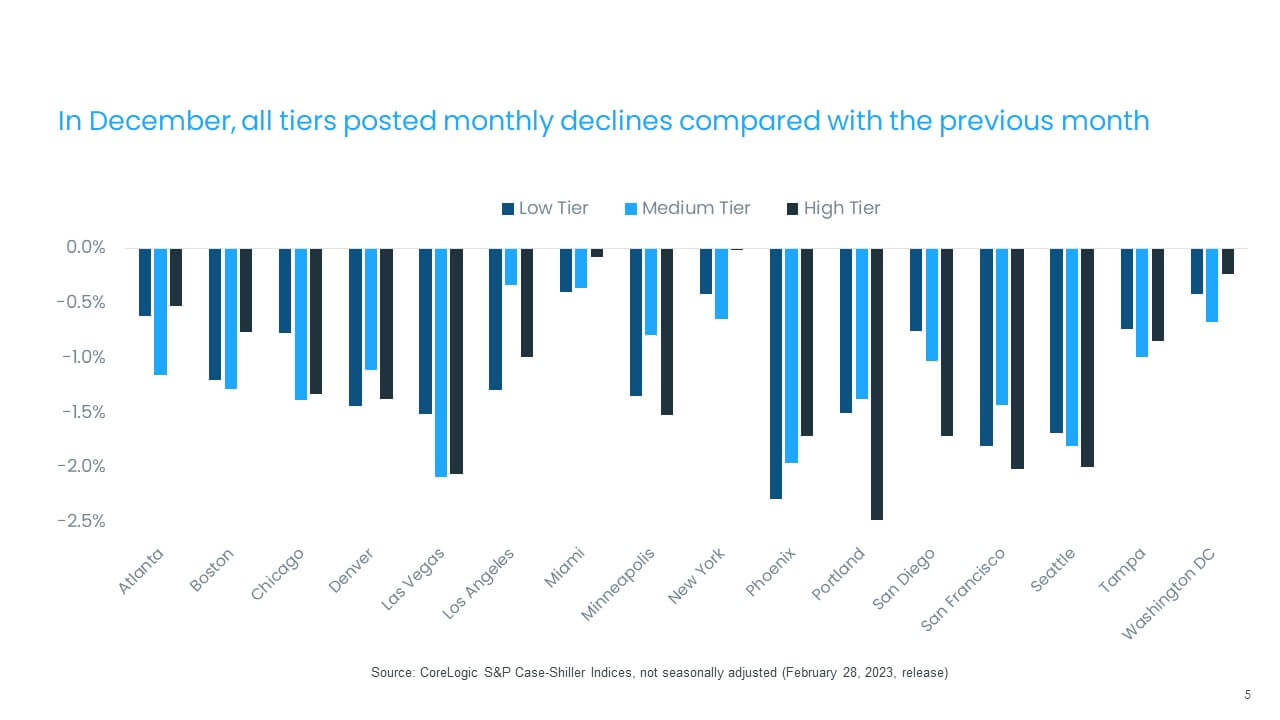
Slowing price growth across all price tiers similarly persisted through the end of the year. The low tier was up by 5.8% in December, middle-tier growth grew by 4.2% and the high tier rose by 4.8%. The high tier showed the largest deceleration in annual gains compared with the spring 2022 peak, down by 19 percentage points. This is a similar trend observed in CoreLogic’s Single-Family Rent Index and may reflect the relative greater mobility of higher-income households during the pandemic, which has since waned.
In addition, the relative strength of low-tier price growth could reflect pressure from multiple parties, including investors and owner-occupied buyers, as well as a stubbornly low inventory of homes for sale. The latest CoreLogic data suggests that the investor share of home sales remained steady at the end of 2022, averaging about 83,000 properties per month nationwide in the fourth quarter across investors of all sizes, while new listings continued to slow significantly.
The month-over-month comparison of appreciation by price tier and location also reveals relative changes in demand across the country. From November to December, all price tiers across all metros showed declines in monthly gains. In general, areas in the Northeast and Midwest that fared relatively worse during the pandemic are seeing renewed buyer demand and relative resilience in home prices than pandemic boomtowns such as Phoenix.
New York’s housing market was particularly impacted by the pandemic, and the relative strength in that metro’s high tier may reflect a rebound effect from weaker demand in 2021. Miami also continues to see relatively smaller price declines, as some of the out-migration from the Northeast continues to drive South Florida’s housing demand.
The average monthly price gain among low-tier homes was down by 1%, though that number is not seasonally adjusted. High-tier and middle-tier prices also declined by 1% month over month on average (Figure 5).
Figure 5: Monthly Price Declines Average -1.1% for Low, Medium and High Tiers
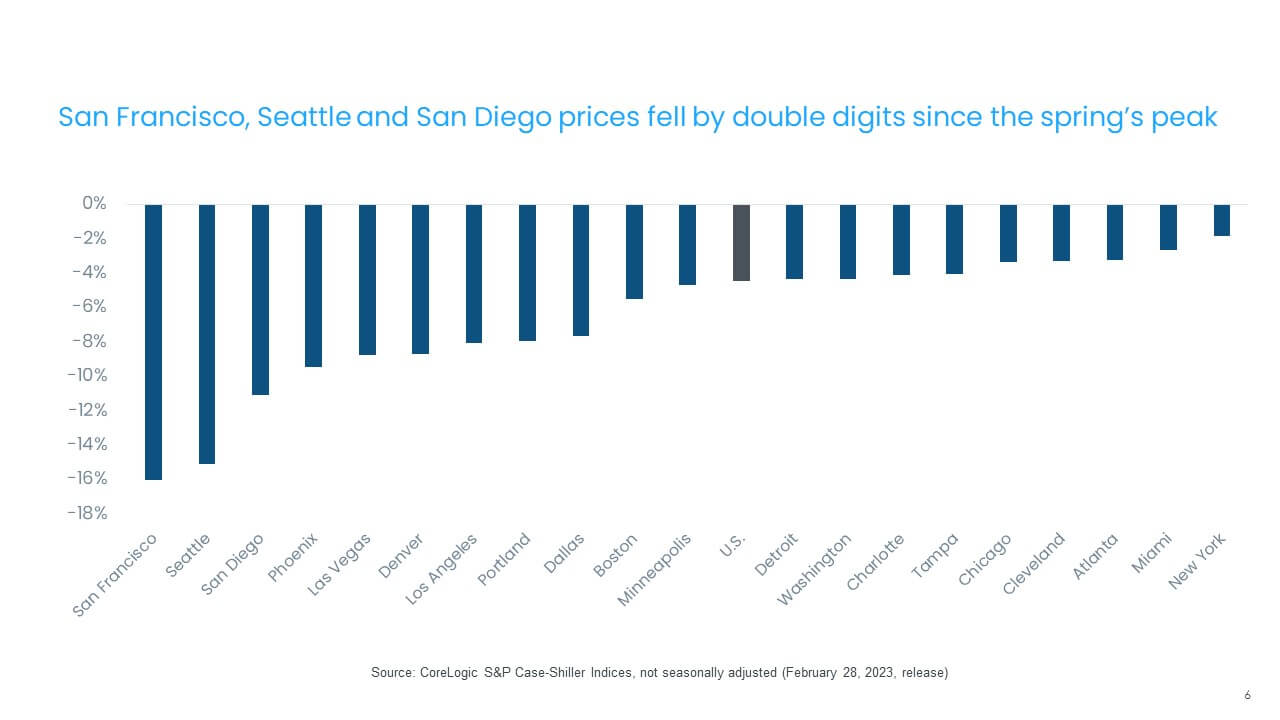
Finally, December home prices declined in all markets compared with their respective peak months in 2022. San Francisco and Seattle posted the largest declines — down by 16% and 15%, respectively. The smallest decline was seen in New York, down by 2%, followed by Cleveland, Chicago and Miami, which were all down by about 3%. Overall, home prices dropped by 4.4% from the spring peak (Figure 6).
Figure 6: December Prices Down 4.4% from Earlier 2022 Peak
Looking forward, the housing market outlook remains uncertain, especially given the continued volatility in mortgage rates and persistent inflation pressures, both of which will weigh on the Federal Reserve’s future actions. Nevertheless, homebuyer response to falling mortgage rates has been noticeable in early 2023 and illustrates the impact of mortgage rates in unthawing the housing market.