Fifteen metro areas had stronger annual home price growth in December compared to November
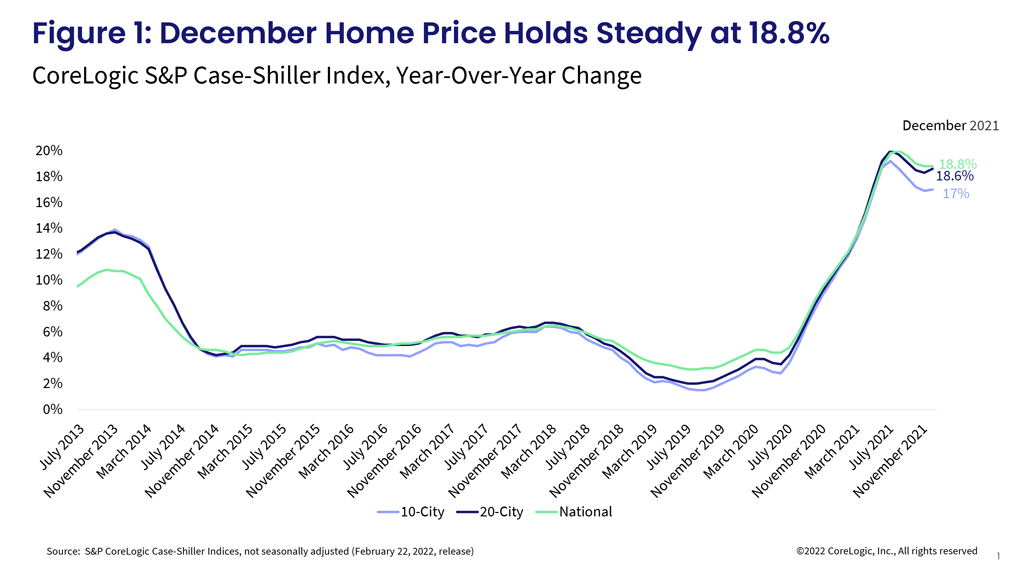
After some signs of slowing home price growth, suggested by the seasonally adjusted deceleration in month-to-month gains, November monthly price growth re-accelerated again, indicating home buyers have not yet thrown in the towel. This is also reflected in the December S&P CoreLogic Case-Shiller Index, which remained steady after three months of slowing, and was up 18.8% year over year, about flat from the 18.8% increase the month prior.
The non-seasonally adjusted month-to-month index was also flat at 0.92%, the same as in November. Except for last winter, the December monthly gain was the strongest in the history of the data series. Generally, there is a decline between November and December, which averaged 0.46% between 2006 and 2019. Re-acceleration in monthly gains is consistent with continued robust demand, despite spiking home prices and higher costs of borrowing. Buyers could have also rushed in at the end of the year in anticipation of higher rates in the coming year, which are now about 100 basis points above where they were when December closings were signing contracts.
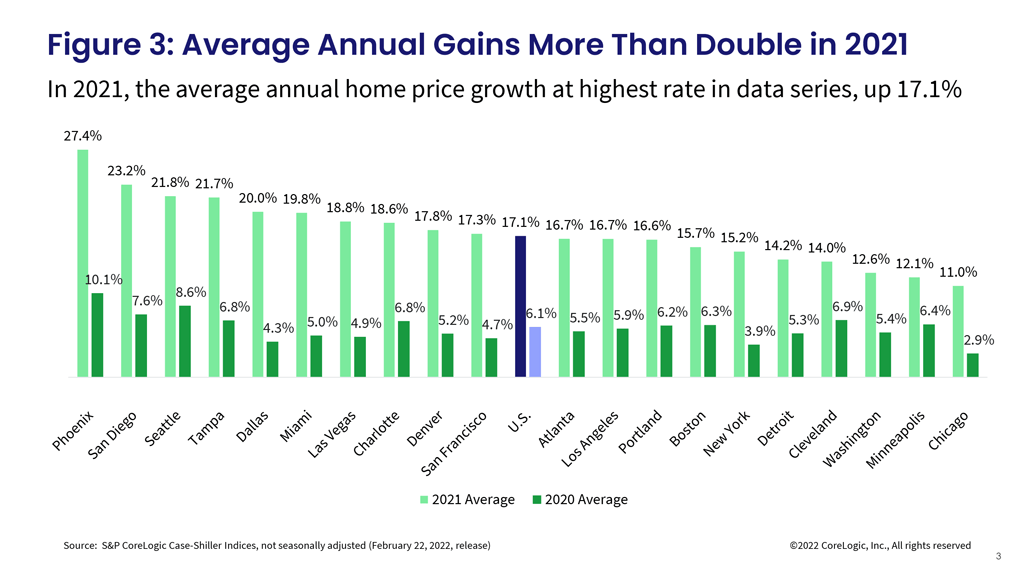
In addition, with a full year of data, the S&P CoreLogic Case-Shiller Index once again proved that 2021 has been an incredible year for the housing market. The average annual growth of 17.1% is the strongest average annual recorded in the series of data. Last year, the national growth rate averaged 6.6%.
The 10- and 20-city composite indexes also continued to regain pace from the prior four months of slowing and were up 17% and 18.6% year over year, respectively (Figure 1). The gains remain higher in the 20-city index. This echoes the stronger demand seen in smaller, warmer and more affordable areas where buyers in-migrating from more expensive areas are coming in with higher incomes and larger budgets to bid on available homes.
Compared to the 2006 peak, the 10-city composite is now 32% higher, while the 20-city composite is 38% higher. Adjusted for inflation, which has been running hot since mid-2021, the 10-city index is down 2%, while the 20-city index is up 3% compared to the 2006 peak.
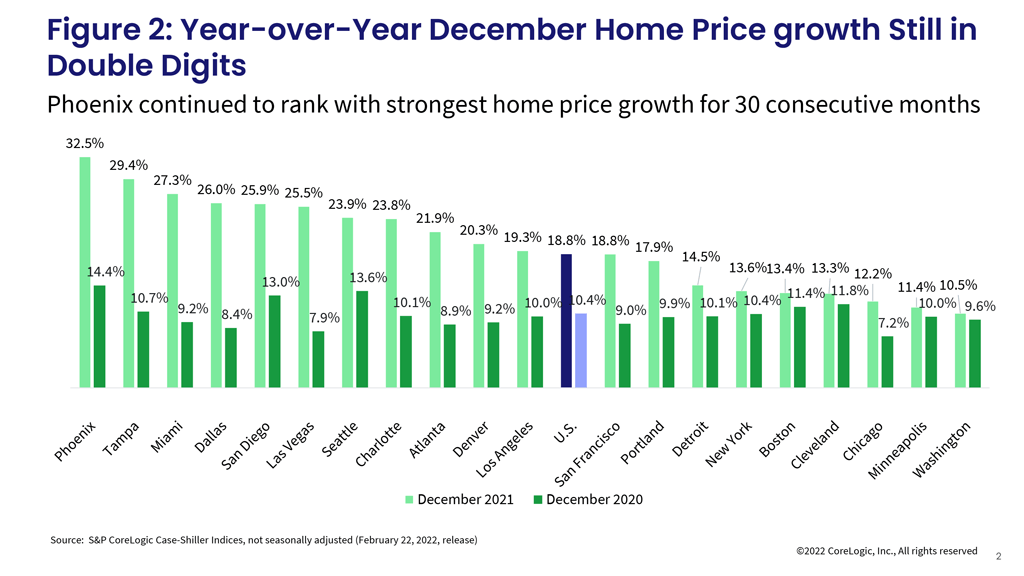
For the 30th consecutive month, Phoenix had the strongest home price growth among the 20 markets, surging 32.5% in December, barely down from November’s non-seasonally adjusted rate of 32.2%.
Tampa, Florida, still ranks 2nd with a 29.4% gain, up from 28% the month before, while Miami ranks 3rd with a 27.3% increase in December. The two cities have experienced the strongest acceleration in annual gains compared to last December. In sum, 15 metro areas experienced acceleration in annual gains since November, more than the 11 metro areas that accelerated a month prior.
Washington and Minneapolis are on the bottom of the list, up 10.5% and 11.4%, respectively, in December. The metros with the largest slowdown in annual gains from the month before are Washington and New York. Despite having the slowest rate of annual price increase, these areas have still been experiencing double-digit rates for 13 consecutive months (Figure 2).
Again, while the U.S. S&P CoreLogic Case-Shiller Index averaged 17.1% for the year, the markets, such as Phoenix which has consistently remained the fastest-growing market for 2.5 years, had average gains in 2021 10 percentage points above the national average. All 20 metro areas had at least double-digit average growth. San Diego and Dallas followed with a 16% average for the year. And as year-over-year gains showed as well, the smallest increases were in Minneapolis, Washington and Cleveland (Figure 3).
Further, the average gains for all three price tiers also reaccelerated in December, with the high tier showing most of the acceleration, up 20.6% in December from 20.1% in November. The slowest regain in price growth was among low-tier homes, still up 19.8%. The lagging low-tier price growth reflects affordability challenges those looking to buy low-tier homes are facing after a year of vigorous price gains.
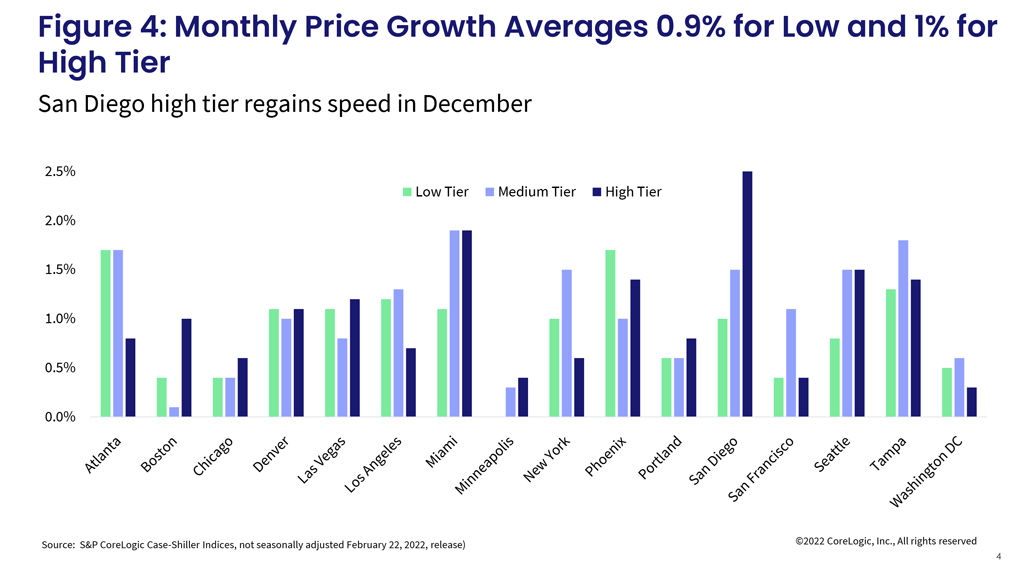
In addition, the month-to-month comparison of home price growth by price tier and location reveals where demand is slowing relatively faster. From November to December, areas with colder climates, particularly Minneapolis, continued with smaller monthly increases. Though unlike in November, all metros had at least some gains across the price tiers. As anticipated, the largest monthly gains were in warmer areas, such as San Diego and Miami, but also in Seattle. San Diego seems to have regained some excitement from buyers after a few months of slower gains, particularly among higher-priced homes.
The largest home price increases in the lower one-third price tier were in Atlanta and Phoenix, both up 17%.
The average monthly gains among low-tier homes sped up in December, up 0.9%, though these are not seasonally adjusted. The high-tier monthly gains averaged 1% in December — again, noting acceleration from November’s average of 0.9%. In the high tier, San Diego led the monthly gains, up 2.7%, followed by Miami, up 1.9%. The middle tier monthly price increases averaged 1.1% (Figure 4).
At the conclusion of 2021, and after about 18 months of greater-than-average, year-over-year home price increases, the housing markets seem to still be facing more tailwinds than the headwinds. One of the most concerning headwinds in 2022 is the rapid increase in mortgage interest rates, which are already higher than many were expecting at this time of the year. Nevertheless, despite the higher rates, home sales activity continues to track close to record levels. Unfortunately, first-time home buyer share appears to be taking a hit as the group finds itself with stressed budgets and reaching their affordability ceilings. Additionally, higher mortgage rates may deter some potential sellers from selling their homes, as they find it difficult to give up the lower rate, and home prices are likely much higher than what they have paid. The disincentive is already obvious in the continually falling inventory of for-sale homes, which is showing no signs of improvement.
The continued concern with higher inflation and un-anchoring of inflation expectations may lead to a strong monetary policy reaction from the Federal Reserve, further pushing up mortgage rates and weighing on housing demand. Slowing demand would put a damper on prices as well. The latest CoreLogic HPI forecast predicts the annual growth rate in December 2022 will slow to about 3.5%.
2022 CoreLogic, Inc. , All rights reserved.