Chat
Chat with Sales Hours: Monday-Friday 8:30 a.m. - 4:30 p.m. (CST)
Contact Sales
Call Sales Toll-Free 1-(866) 774-3282 Hours: Monday-Friday 7 a.m. - 5 p.m. (CST)
Product Login
Product Log-in
Product Support
Product Support
Email Sales
Contact Sales
After Hours
  • Support
  • Sign In Sign In
  • AUS NZ UK
CoreLogic - Home
  • Solutions
    view solutions by:

    Data Solutions

    • Lead Generation
    • Property Data
    • Location Intelligence

    Real Estate

    • Multiple Listing Enterprise
    • Agent & Broker

    Mortgage

    • Origination
    • Servicing
    • Appraisal
    • Commercial Property Tax

    Insurance

    • Hazard Risk
    • Catastrophe Risk Management
    • Risk Evaluation
    • Underwriting Automation
    • Weather
    • Claims Automation
    • Restoration
    • INTRCONNECT

    Mortgage Lenders

    • Origination

    Mortgage Servicers

    • Residential Property Tax
    • Default & Loss Mitigation
    • Portfolio Insight & Monitoring

    Mortgage Appraisers

    • Appraisal

    Real Estate Agents & Brokers

    • Agents & Brokers

    Real Estate MLS

    • Multiple Listing Enterprises

    Commercial Real Estate Owners

    • Commercial Property Tax

    Marketing Departments

    • Property Data

    Insurance Underwriters

    • Risk Evaluation
    • Underwriting Automation
    • Hazard Risk
    • Catastrophe Risk Management

    Insurance Risk Managers

    • Risk Evaluation
    • Hazard Risk
    • Catastrophe Risk Management

    Insurance Claims

    • Claims Automation
    • Restoration Contractors
    • Weather Verification

    Construction Contractors

    • Restoration Contractors

    General

    • Location Intelligence
    • Lead Generation
    • Data Solutions
  • Resources

    Reports

    • Climate Change
    • Construction Cost Update
    • Construction Insights
    • Home Price Insights
    • Homeowner Equity Insights
    • Loan Performance Insight
    • Mortgage Fraud
    • Property Tax Delinquency
    • Single-Family Rent Index

    Insight Blogs

    • Hazard HQ
    • Office of Chief Economist
    • Affordable Housing
    • Homebuying
    • Insurance
    • Other Articles

    More Resources

    • Events
    • Case Studies
    • White Papers
    • Podcasts
    • Quick Takes
  • Company
    • About
    • Leadership
    • Newsroom
    • Contact
    • Careers
  • Search
CoreLogic - Home
  • Solutions
  • Resources
  • Company

    • About
    • Leadership
    • Newsroom
    • Contact
    • Careers
  • Accounts

    • Products Sign-in
  • Contact

    • Sales Contact
    • Product Support
  • Regions

    • Australia
    • New Zealand
    • United Kingdom
  • Social

    • Facebook
    • Instagram
    • Linkedin
    • Twitter
    • Youtube
Solutions
VIEW BY:
  • Data Solutions

    • Lead Generation
    • Property Data
    • Location Intelligence
  • Real Estate

    • Multiple Listing Enterprise
    • Agent & Broker
  • Mortgage

    • Origination
    • Servicing
    • Appraisal
    • Commercial Property Tax
  • Insurance

    • Hazard Risk
    • Catastrophe Risk Management
    • Risk Evaluation
    • Underwriting Automation
    • Weather
    • Claims Automation
    • Restoration
    • INTRCONNECT
  • Mortgage Lenders

    • Origination
  • Mortgage Servicers

    • Residential Property Tax
    • Default & Loss Mitigation
    • Portfolio Insight & Monitoring
  • Mortgage Appraisers

    • Appraisal
  • Real Estate Agents & Brokers

    • Agents & Brokers
  • Real Estate MLS

    • Multiple Listing Enterprises
  • Commercial Real Estate Owners

    • Commercial Property Tax
  • Marketing Departments

    • Property Data
  • Insurance Underwriters

    • Risk Evaluation
    • Underwriting Automation
    • Hazard Risk
    • Catastrophe Risk Management
  • Insurance Risk Managers

    • Risk Evaluation
    • Hazard Risk
    • Catastrophe Risk Management
  • Insurance Claims

    • Claims Automation
    • Restoration Contractors
    • Weather Verification
  • Construction Contractors

    • Restoration Contractors
  • General

    • Location Intelligence
    • Lead Generation
    • Data Solutions
Resources
  • Reports

    • Climate Change
    • Construction Cost Update
    • Construction Insights
    • Home Price Insights
    • Homeowner Equity Insights
    • Loan Performance Insight
    • Mortgage Fraud
    • Property Tax Delinquency
    • Single-Family Rent Index
  • Insight Blogs

    • Hazard HQ
    • Office of Chief Economist
    • Affordable Housing
    • Homebuying
    • Insurance
    • Other Articles
  • More Resources

    • Events
    • Case Studies
    • White Papers
    • Podcasts
    • Quick Takes

Home / Intelligence / Reports / U.S. S&P CoreLogic Case-Shiller Rockets to 16.6%, Reaches New Records

ABOUT THE AUTHOR
Selma Hepp
Selma Hepp
Chief Economist
View Profile
  • July 27, 2021

U.S. S&P CoreLogic Case-Shiller Rockets to 16.6%, Reaches New Records

At 18.1% and 17.5%, middle- and high-tier price growth also reach historical records  

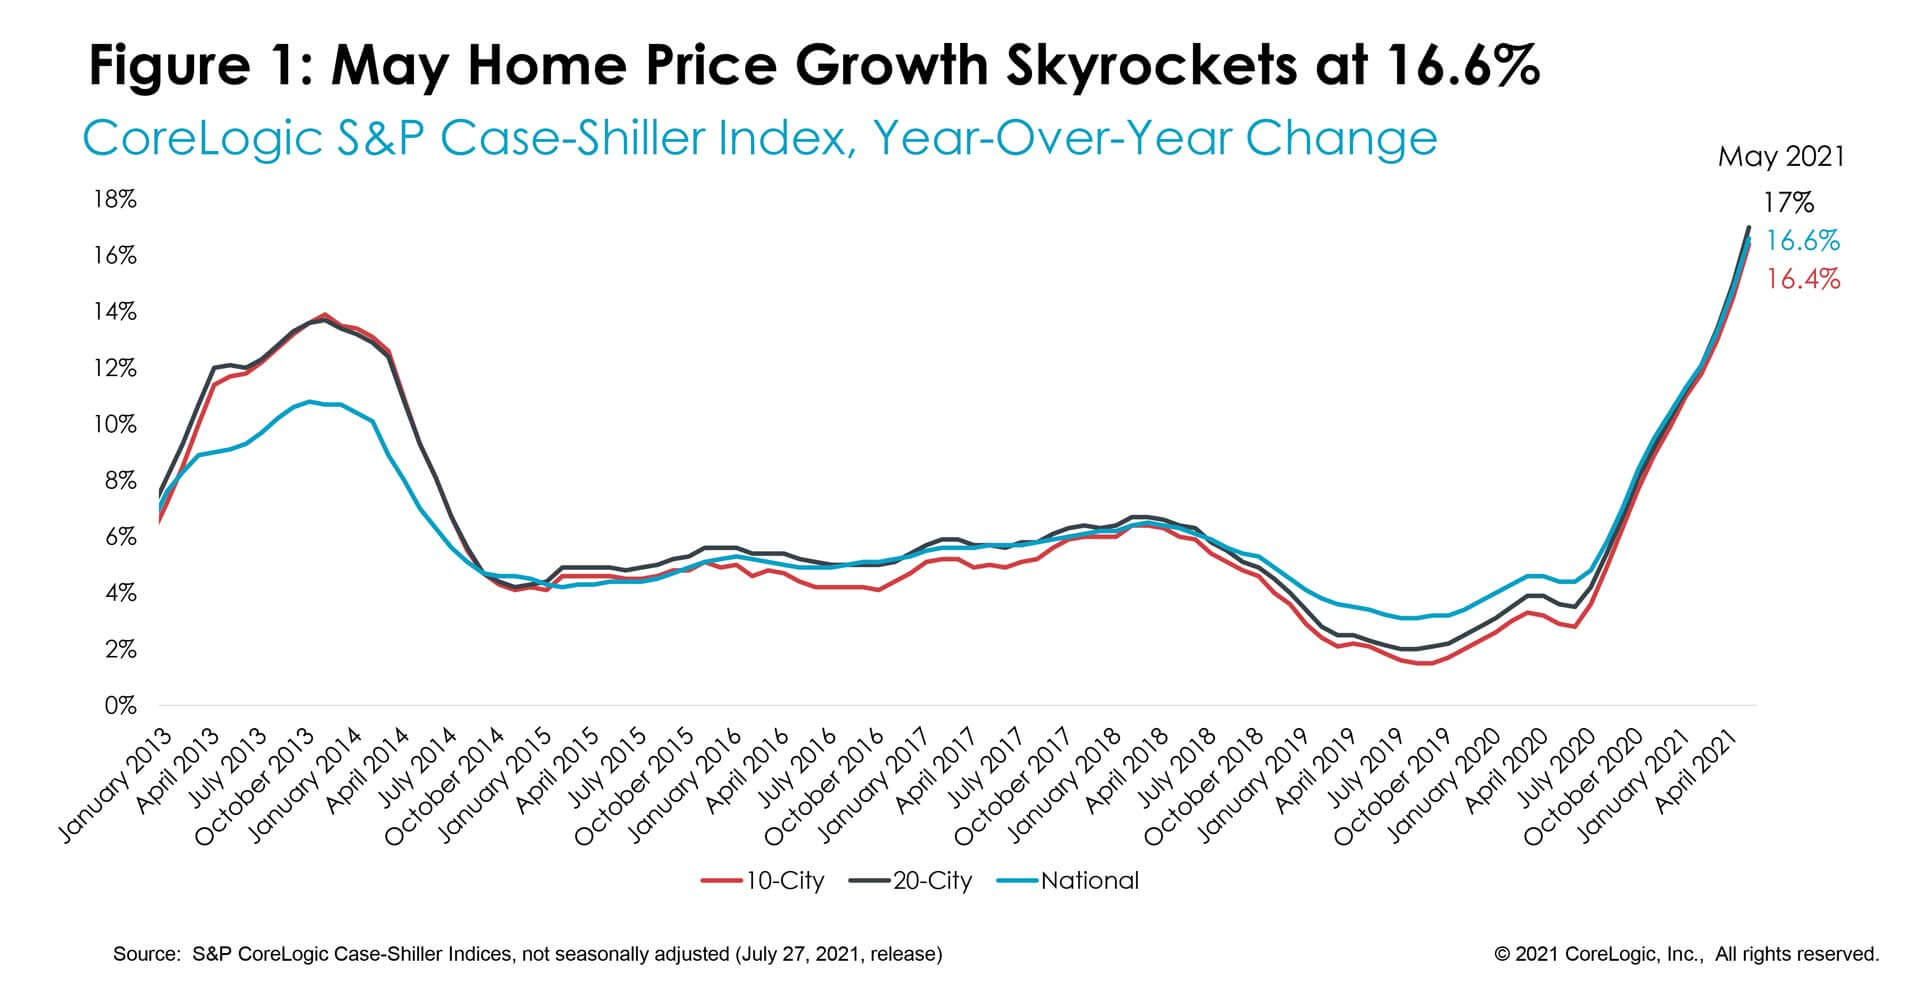
Despite concerning acceleration in home prices since last summer, consumers are still eager to buy, and an increasing share of homes are selling over the asking price. In May, S&P CoreLogic national Case-Shiller Index skyrocketed 16.6% year over year — keeping with the theme of reaching new highs in the past few months. The month-to-month index shot up 2.14%, making it the fastest April-to-May increase since the data series began. 

Acceleration in home price growth and mass vaccinations earlier in the spring has prompted more sellers to list their homes. This has been helpful for buyers after months of decreasing new listings and intense competition for dwindling for-sale homes. The imbalance between robust demand and dismal availability of for-sale homes has led to a continual bidding over asking prices, which reached record levels in recent months. Now, almost 6 in 10 homes listed are selling over the asking price. Nevertheless, with more new listings and new home construction, home price acceleration that has built momentum, and continues to reach new highs, will likely slow later this summer but remain in double digits. 

The 10- and 20-city composite indexes also soared in May, up 16.4% and 17% year over year, respectively. The last time both indices had similar rates of growth was in 2004. This time, the 20-city index is accelerating at a faster pace than the 10-city composite (Figure 1). Compared to the prior peak in 2006, the 10-city composite is now 22% higher, while the 20-city composite is 27% higher. But, when the two indices are adjusted for inflation, the 10-city index is still 5% below its 2006 peak, while the 20-city index is 1% below the previous peak. While the national month-to-month growth rates hastened in recent months, both city indices have experienced some slowing in monthly growth rates, with the 10-city composite slowing from a 2.1% increase in March to 1.9% in May. The 20-city composite was down from 2.3% in March to 2.1% in May.

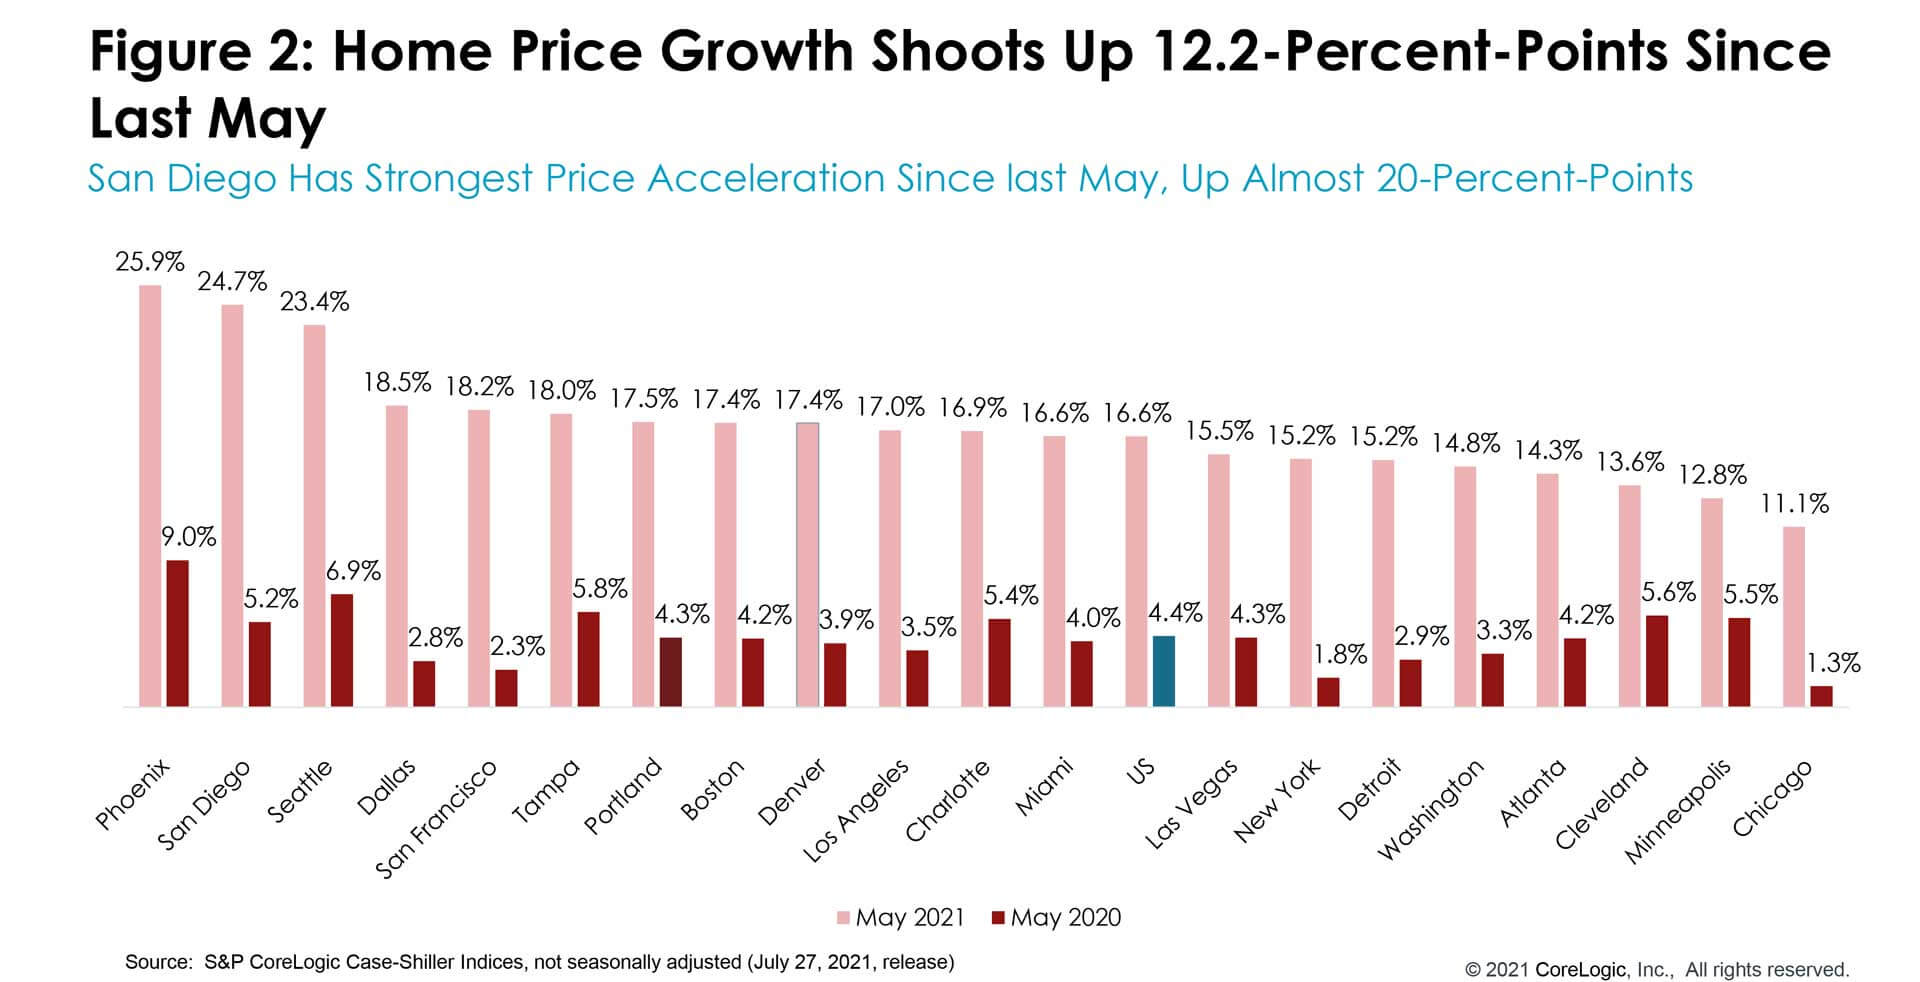
There has been almost no change in the ranking of metropolitan areas by price growth over the last year. For the 23rd consecutive month, Phoenix had the strongest home price growth among the 20 markets, taking off 25.9% in May, the fastest acceleration since the spring of 2006 and 17-percentage-points higher than last May’s growth.

San Diego remained in second place, with an annual increase of 24.7%, and a larger jump of 19-percentage points from last May. Seattle, in third place, had a 23.4% jump in May. All 20 cities in the index had double-digit home price growth in May.

Chicago and Minneapolis continued to lag, up 11.1% and 12.8%, respectively. Chicago has been ranking the lowest in price appreciation in the past three months’ releases. However, Minneapolis had the slowest acceleration in price growth compared to last year (Figure 2).

Figure 2: Home Price Growth Shoots Up 12.2-Percent-Points Since Last May

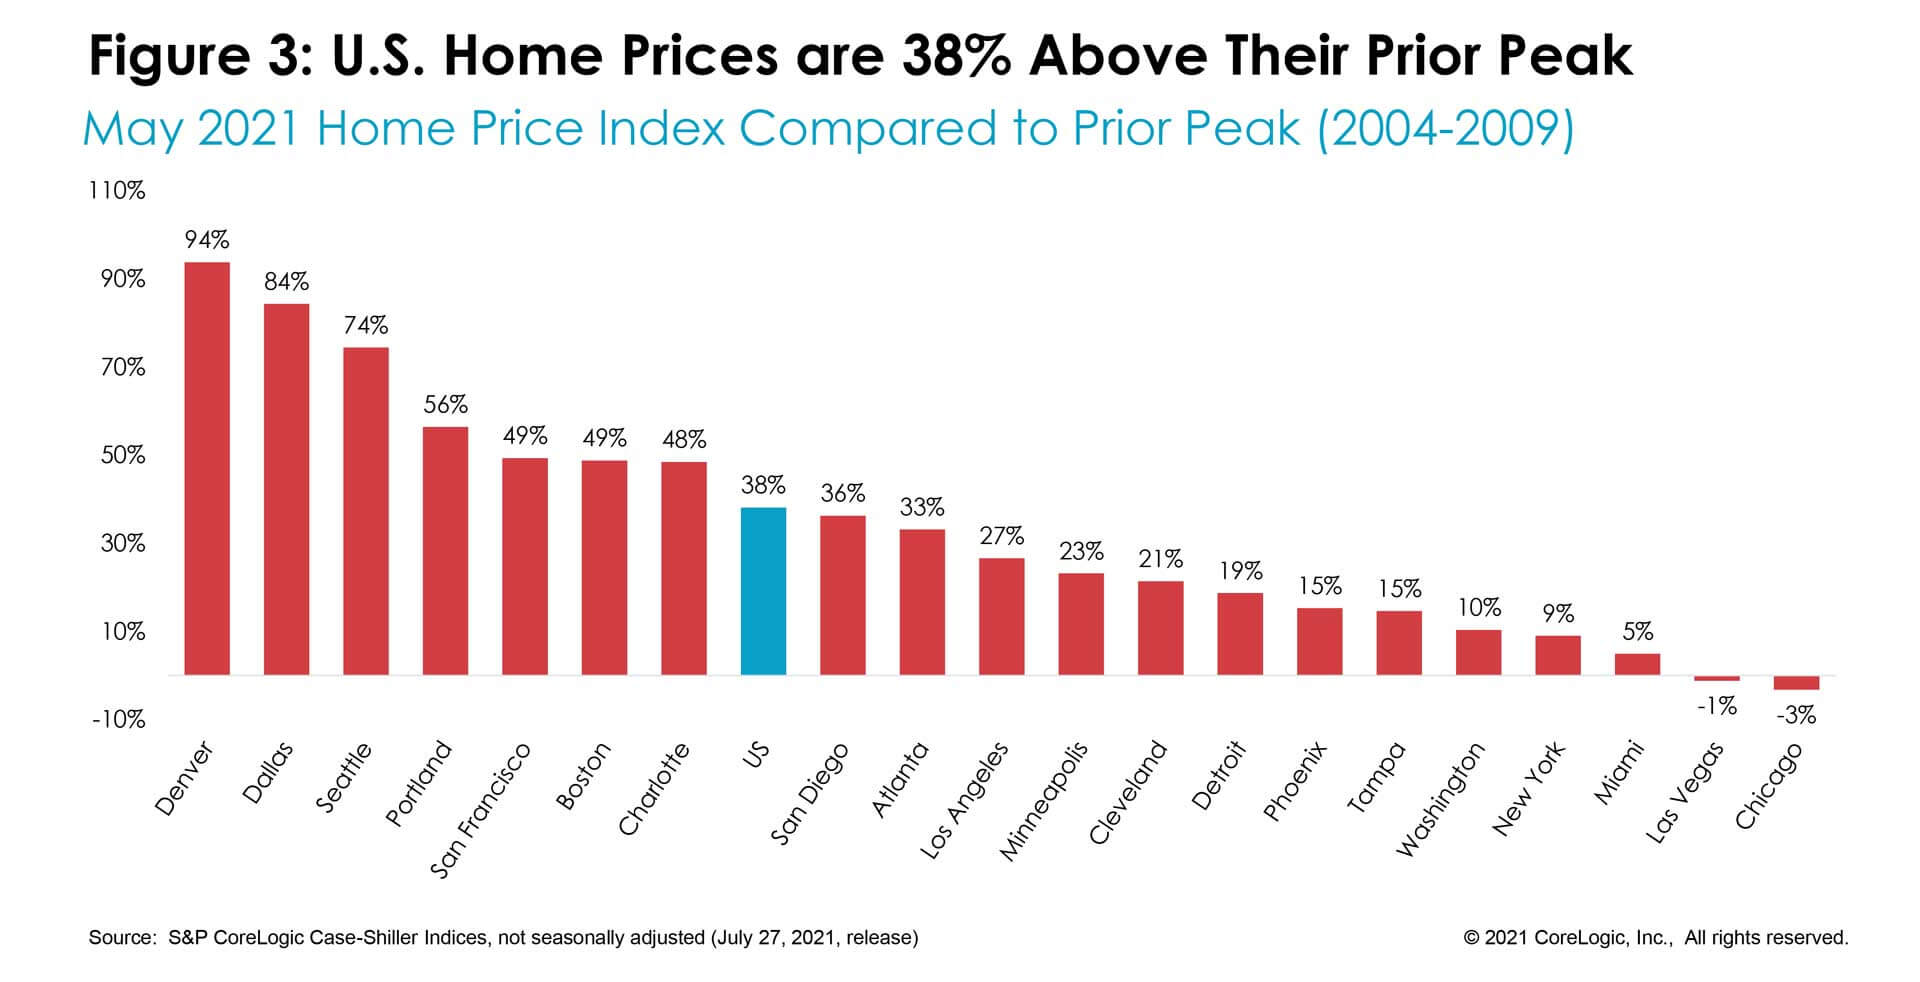
In May, national home prices were 38% higher than the previous peak. Las Vegas and Chicago are still catching up with the previous peaks. Conversely, Denver’s prices have leapt 94% above its 2006 peak, followed by Dallas at 84% (Figure 3). Still, while nominal prices have surpassed previous levels, national home prices are only 7% above the previous peak when adjusted for inflation.

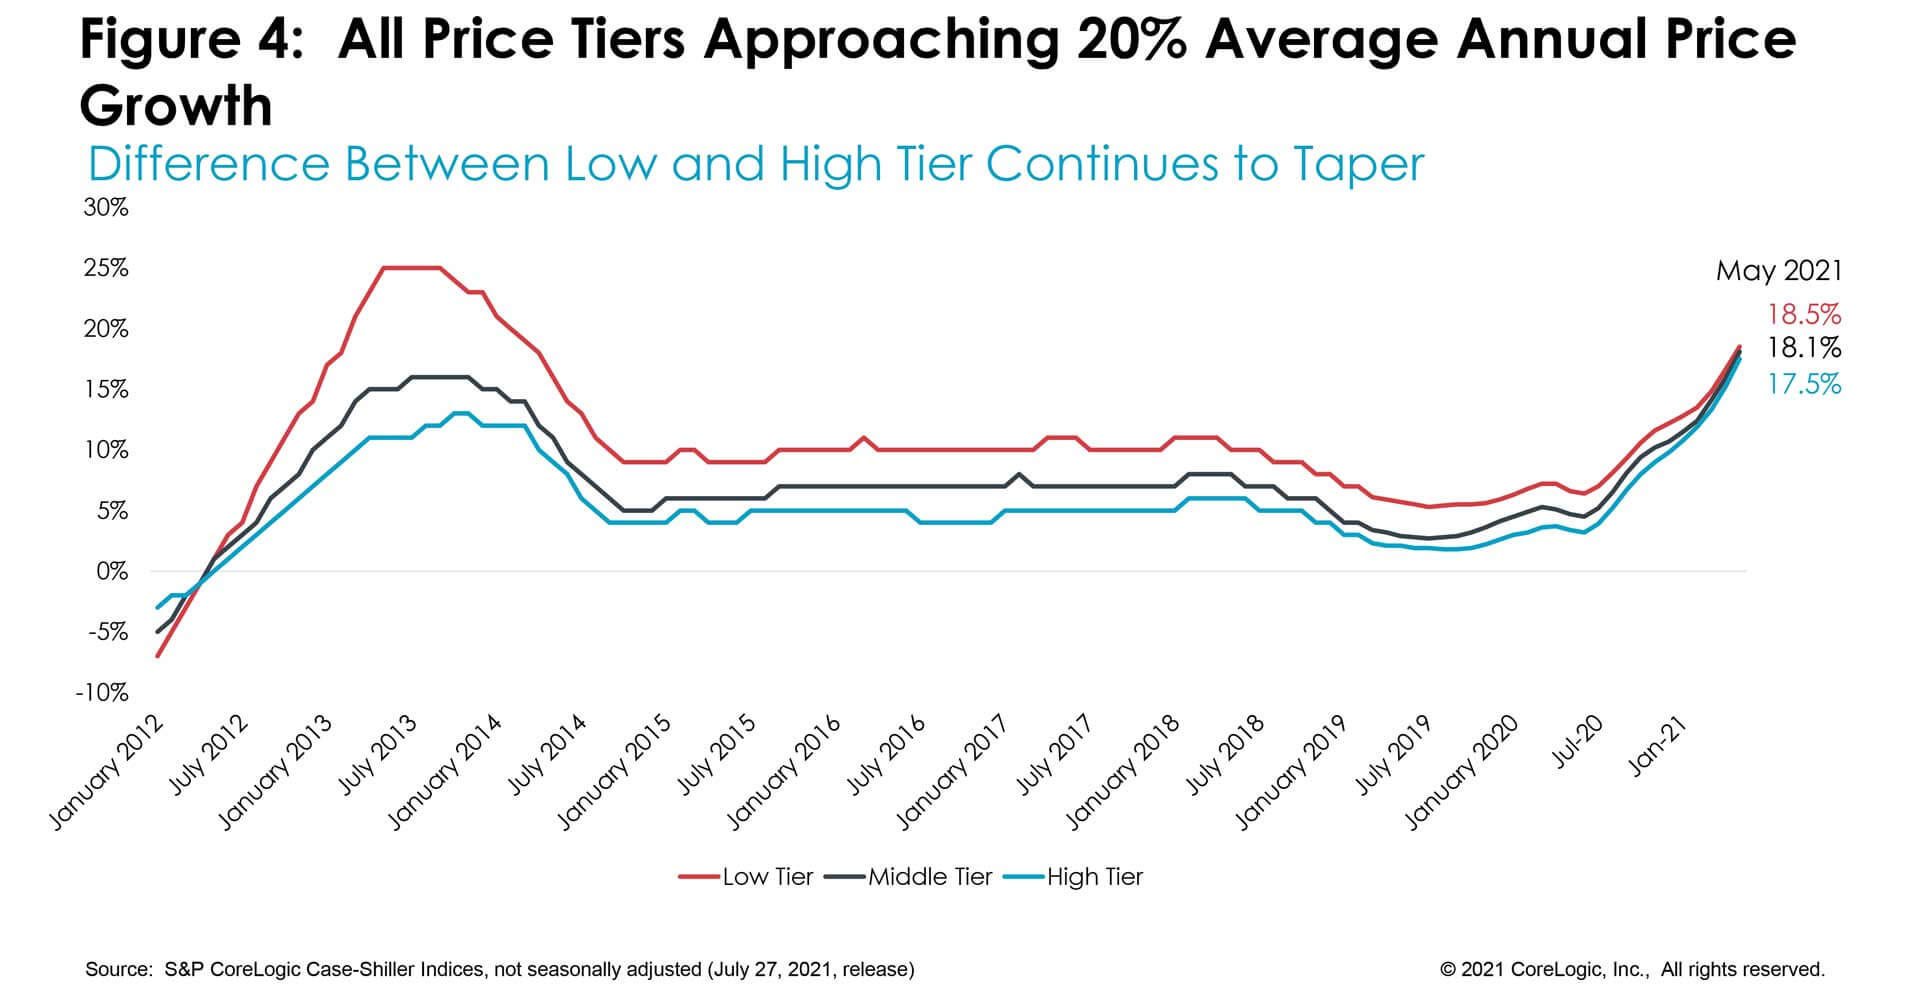
Home price growth between the low tier and high tier continued to converge, narrowing the difference between the two tiers to a two-decade low. This convergence occurred as demand for homes in all price segments picked up pace since the onset of the pandemic, but particularly due to heightened demand for higher-end homes since last summer.

Prices of homes in the lower one-third of the price distribution jumped on average 18.5% in May. The fastest price growth in the low tier was in 2013 when the growth rate reached 25% as investors were snapping up foreclosed properties post-Great Recession. The average growth among medium-tier priced homes followed at 18.1%, while prices in the highest tier were up 17.5% on average, making it the strongest home price growth recorded for the two tiers in the history of the series (Figure 4).

Lastly, the month-to-month changes in home price growth have revealed some interesting buyer preferences. The high tier growth rates have been picking up pace in recent months. However, this tier appears to have peaked in March with an average monthly increase at 2.7% among the 16 cities that report prices by tier. In May, the high tier’s monthly increase averaged 2.5%. The low tier’s monthly growth has also slowed from an average of 2.46% in April to 2.2% in May. Nevertheless, the monthly increases are still notable, and we may see a pick-up in the coming months.

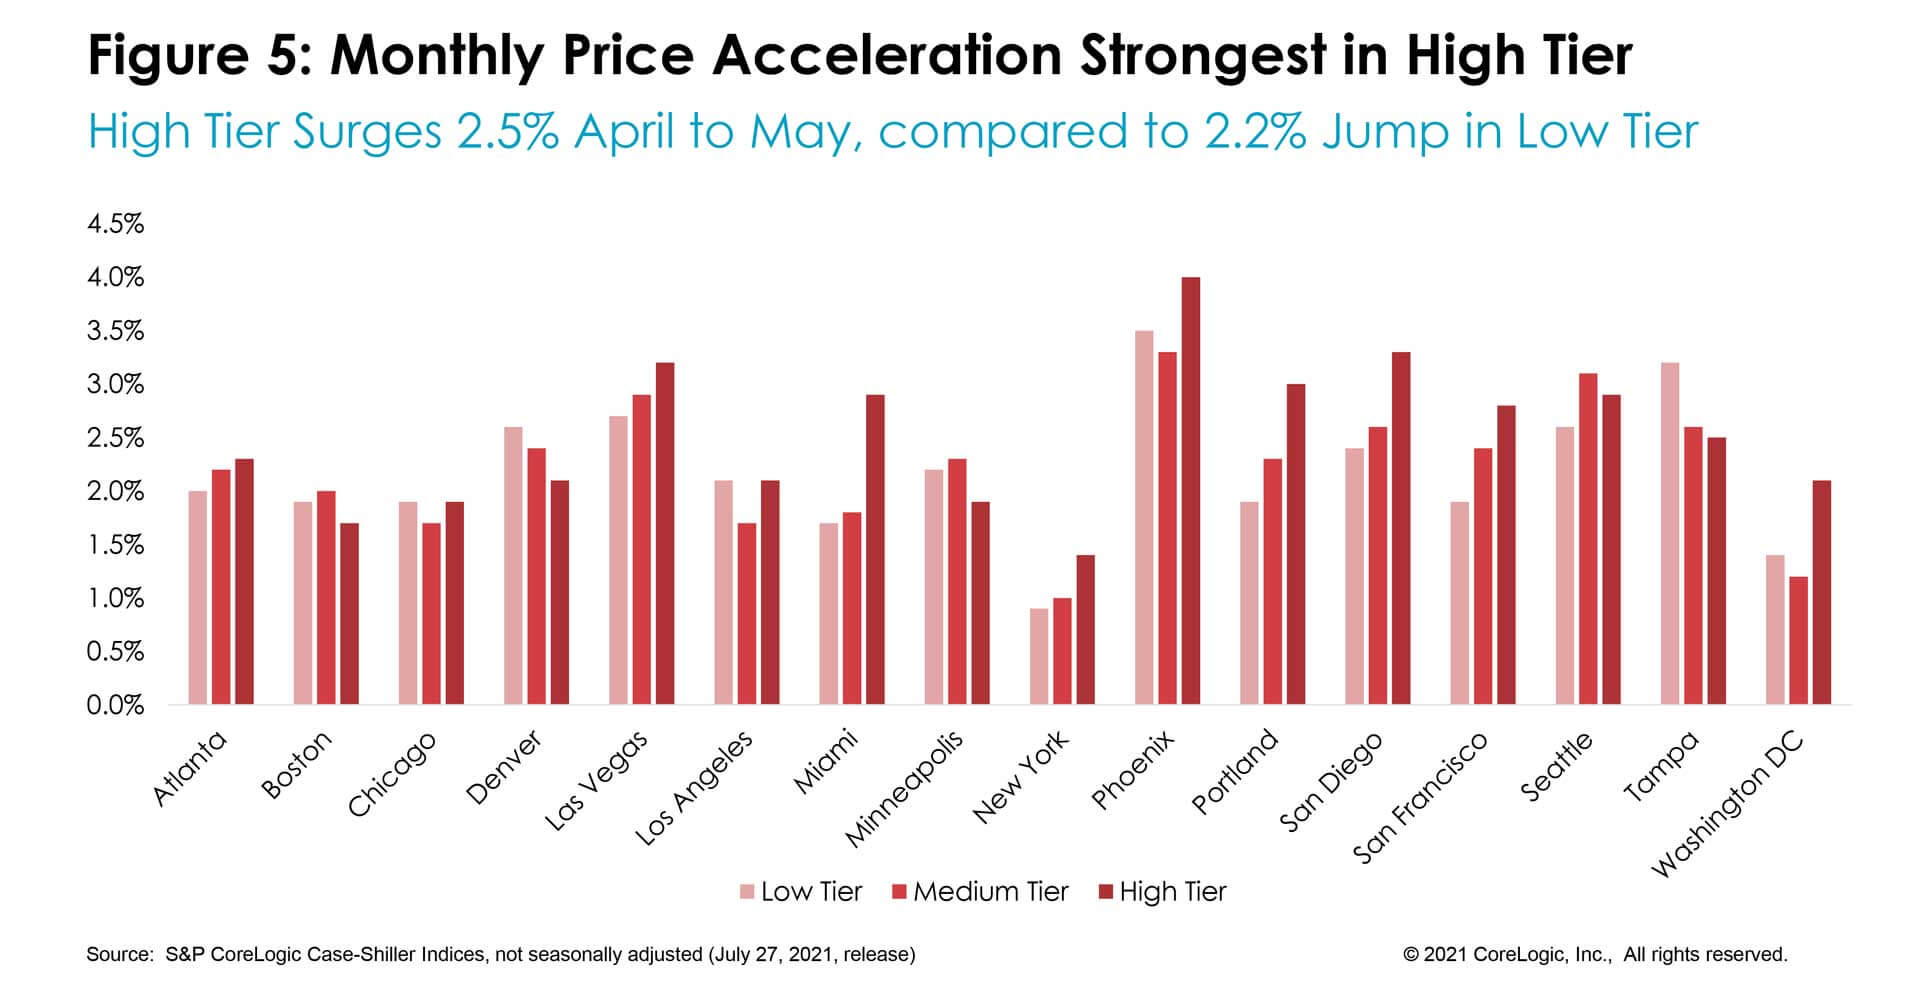
The largest home price increases in the lower one-third price tier were in Phoenix at a 3.5% increase from April to May, followed by Tampa at 3.2%. In March, the city with the strongest growth in the low-tier was in San Francisco at 3.5%, but slowed to a 1.9% increase in May.

In the high tier, Phoenix again took the lead with a 4% increase from April-to-May, followed by San Diego at 3.3%. In March, Seattle was leading with a 6.2% increase in the high tier and has since slowed to a 2.9% rise (Figure 5).

While sustained spurts of home price growth are keeping economic watchers on their toes, underlying strength in consumer demand remains supported by a significant pool of accumulated savings and solid mortgage underwriting. Both are markedly different than home price run-up seen in 2005. Nevertheless, improvements in the availability of new listings will help release the tremendous pressure that competing buyers have put on home prices and home price growth, which is likely to slow some by the end of the summer.

  • Category: Home Price Insights, Intelligence, Reports
  • Tags: Case Shiller Index, Home Value
ABOUT THE AUTHOR
Selma Hepp
Selma Hepp
Chief Economist
View Profile

Related Posts

CSI_Promo_Mar2023
Blogs

US CoreLogic S&P Case-Shiller Index Gain Slows to Pre-Pandemic Low, Up by 3.8% Year Over Year in January

The index continued to decline year over year in January, again posting a single-digit gain.

March 28, 2023
Tornado footprints in Southern California captured by CoreLogic's weather verification technology as viewed in CoreLogic Reactor™.
Blogs

A Rare Los Angeles Tornado and Near Hurricane-Force Winds in San Francisco

CoreLogic Weather Verification Services captured wind and tornado footprints from the severe weather system in California.

March 24, 2023
atmospheric rivers california
Core Conversations

What Was it Really Like to Live Through the California Floods? Our Team Spills

A Conversation With Kent David and Tom Larsen Since the beginning of the year, California has been drenched by atmospheric rivers. The flooding in California

March 22, 2023

About Corelogic

  • Newsroom
  • Leadership
  • Careers
  • Ethics & Compliance

Accounts

  • Products Sign-in

Contact

  • Sales Contact
  • Product Support

Regions

  • CoreLogic Australia
  • CoreLogic New Zealand
  • CoreLogic UK

Follow & Connect

  • Facebook
  • Instagram
  • Linkedin
  • Twitter
  • YouTube
© 2023 CoreLogic. All rights reserved.
  • Legal
  • Privacy Policy
  • CCPA
  • Cookie Preferences
  • Security
  • Sitemap
  • Accessibility
  • Legal
  • Privacy Policy
  • CCPA
  • Cookie Preferences
  • Security
  • Sitemap
  • Accessibility