At 14.6%, national home price growth beats the previous housing boom
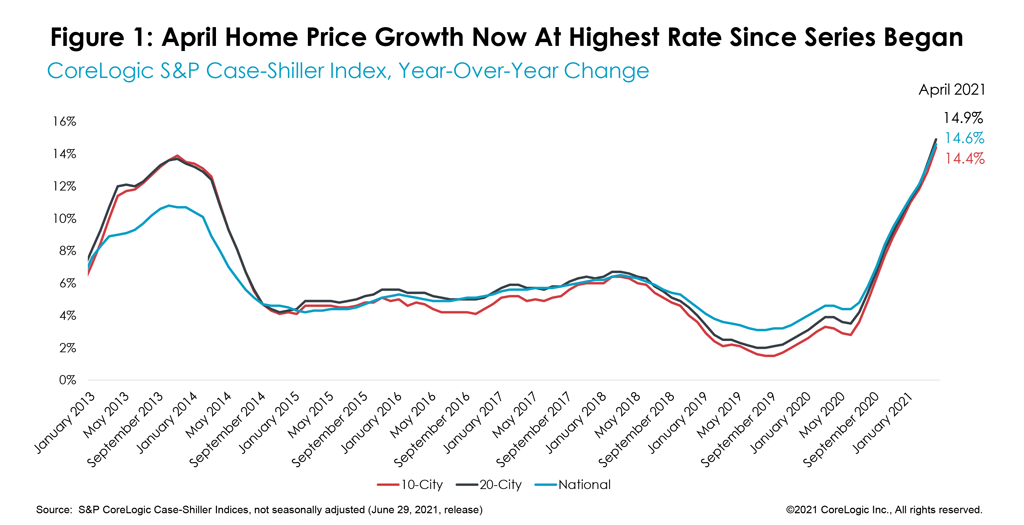
As the spring homebuying season took hold in April, there was no respite from demand, leading to home price growth rates that were last seen in 2005. In April, the S&P CoreLogic national Case-Shiller Index jumped a remarkable 14.6% year over year — the highest rate since the beginning of the index series. The month-to-month index surged 2.09%, making it the strongest March-to-April increase in the recorded history of data.
While the acceleration of home price growth is met with much concern over the sustainability of home price growth and affordability challenges it’s creating, it is important to note that housing remains substantially more affordable than 15 years ago. The reason is that while home price levels relative to household incomes are similar to 2006 levels, current mortgage interest rates are more than 50% lower, resulting in notably lower ratios of mortgage payments to monthly household income, and to monthly rent payments, compared to today. Importantly, the resultant risk of home price declines over the next 12 months is also much lower today. For example, according to CoreLogic Market Risk Indicators, in April 2021, the share of metro areas with more than 75% risk of year-over-year price decline fell to only 0.2%, down from 13.3% in April 2006. To determine the vulnerability of metro areas to price decline, CoreLogic’s probability model considers many data points at a state and metro level, including unemployment rates, income, distressed loans, new construction and more.
The 10- and 20-city composite indexes also surged in April, up 14.4% and 14.9% year over year, respectively. The last time both indices had similar rates of growth was in 2005 (Figure 1). Compared to the prior peak in 2006, the 10-city composite is now 19% higher, while the 20-city composite is 24% higher. However, when the two indices are adjusted for inflation, the 10-city index is still 6% below its 2006 peak, while the 20-city index is 2% below the previous peak.
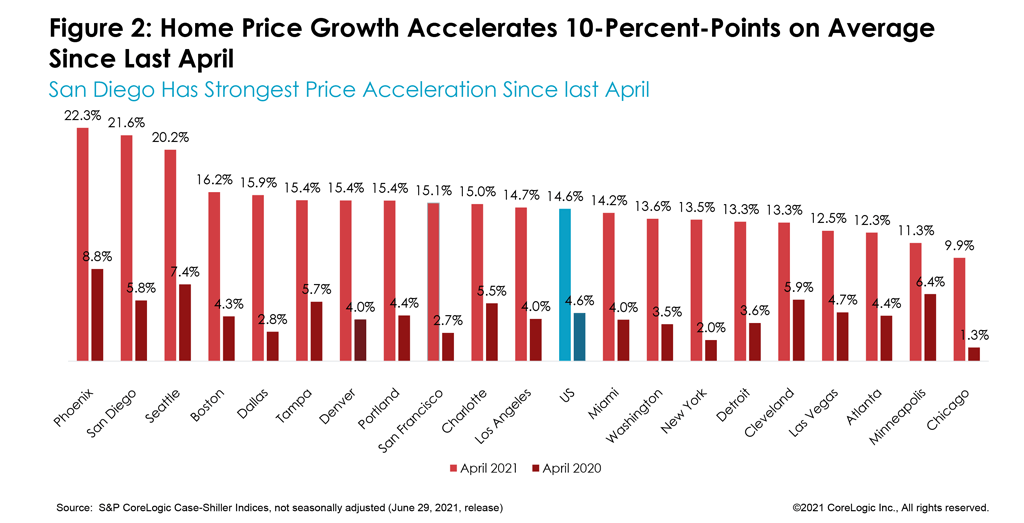
The ranking of metropolitan areas by price growth remained consistent. For the 22nd consecutive month, Phoenix had the fastest home price growth among the 20 markets — accelerating 22% in April. This was the fastest acceleration since February 2013 and is 14-percentage points higher than last April’s growth.
San Diego remained in second place with an annual increase of 21.6% and a larger jump of 15.8-percentage points from last April. Seattle, in third place, had a 20.2% jump in April. All 20 cities in the index had double-digit home price growth in April.
Chicago and Minneapolis continued to lag, up 10% and 11.3%, respectively. Chicago has been ranking lowest in price appreciation in the most recent three months. However, Minneapolis had the slowest acceleration in price growth compared to last year.
Additionally, while the CoreLogic HPI shows that San Francisco county and city has had relatively flat or declining prices over the last year, the metro region included in the Case Shiller HPI encompasses Marin, Contra Costa and Alameda counties, which have experienced double-digit growth equitable to other fast price growth regions (Figure 2).
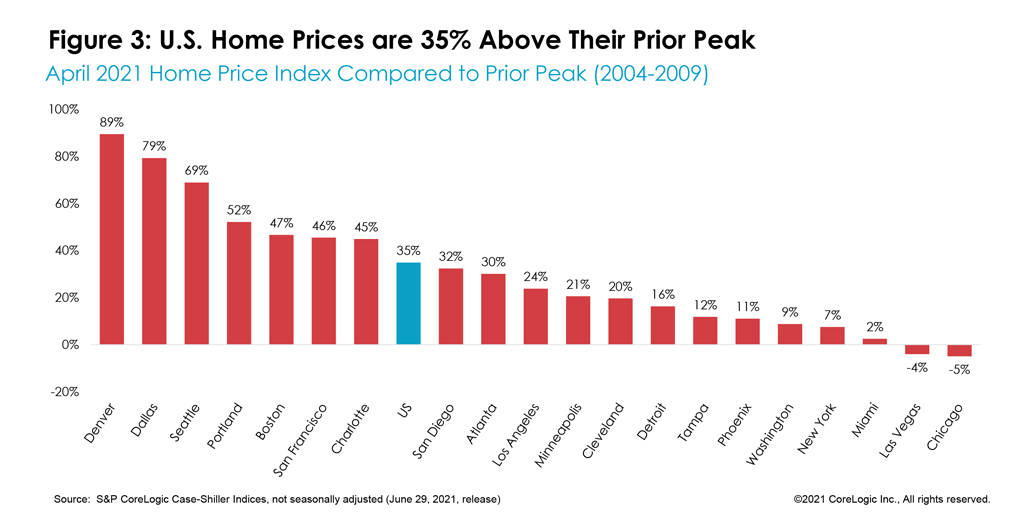
In April, national home prices were 35% higher than the previous peak. Two cities remain below their previous peaks: Las Vegas and Chicago. By contrast, Denver’s prices have leaped 89% above its 2006 peak, followed by Dallas at 79% (Figure 3). While nominal prices have surpassed previous levels, when adjusted for inflation, national home prices were only 6% above the previous peak.
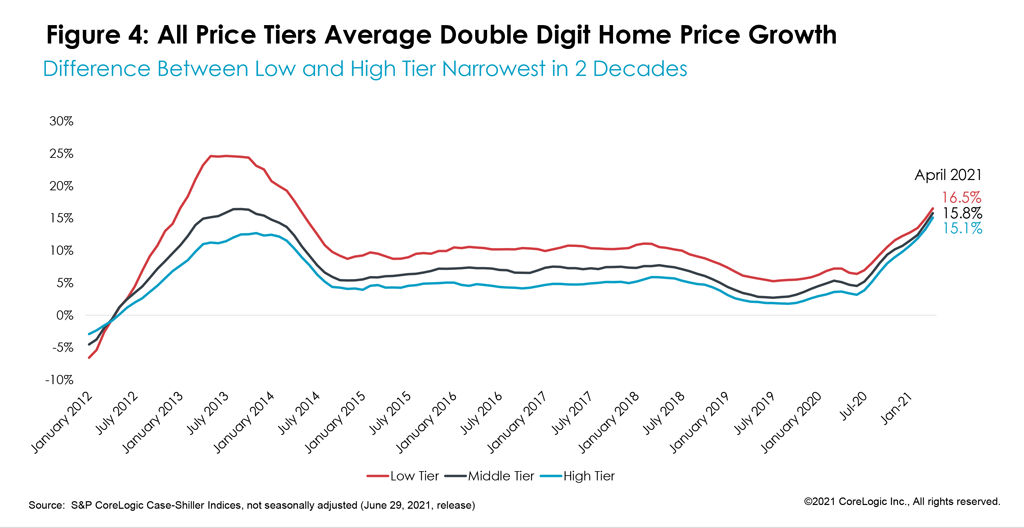
All three price tiers continued increasing by double-digit rates. Home prices in the lower third of the price distribution jumped on average 16.5% in April, making it the strongest growth among the three tiers — as it has been since home price recovery began in 2012. The average growth among medium-tier priced homes followed at 15.8%, while prices in the highest-tier were up 15.1% on average.
As demand for homes in all price segments picked up pace since the onset of the pandemic, price growth between the low and high tier continued to converge, leading to the narrowest difference between the two in at least the last two decades. Also, demand for higher-end homes has been particularly strong since last summer as higher-income households have fared relatively better financially than lower-income households (Figure 4).
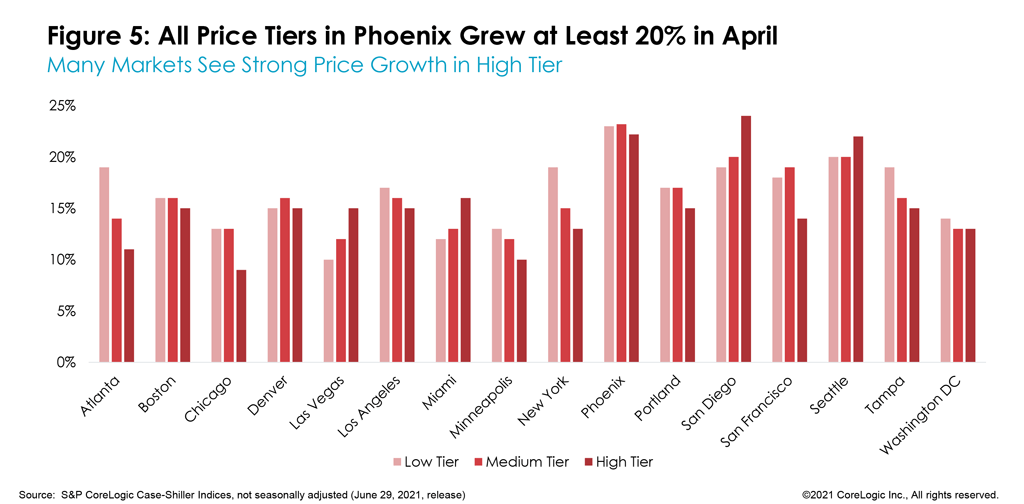
The largest home price increases in the lower third continued in Phoenix and Seattle, up 23% and 20%, respectively, followed by a 19% increase in both Atlanta and San Diego.
Compared to April 2020, San Francisco’s low tier had the fastest acceleration of 15.1-percentage points in home price growth, followed by New York at 14.3-percentage points.
In the high tier, price growth in San Diego accelerated by 19-percentage points since last April, followed by a 16.2-percentage point acceleration in Seattle. San Diego had the fastest acceleration in the high tier among all recorded cities and compared to its lower price tiers with a 24% jump in April (Figure 5).
Massive home buying demand seems to persist despite concerns about overheated home price growth and shrinking affordability, particularly in regions where rapid price growth is pushing existing residents to other areas. At the same time, while there are some weak signs for more new listings compared to previous months, keen buyers seem to be snatching them up rapidly. As a result, overall inventory levels are still showing no signs of respite. Furthermore, part of the accelerated price growth amid heightened demand may be reflecting some migration patterns. Namely, families from expensive coastal areas moving to more affordable ones but bringing with them higher price expectations they are willing to pay. Nevertheless, if buyers are also bringing higher earnings and intend to spend locally, this may have a positive outcome for existing residents, their earnings and the local economy.
Ultimately, while slowing home price growth has been anticipated, the continuing pressures on prices will likely persist throughout 2021 and keep the price growth at double-digit rates throughout the remainder of the year.
©2021 CoreLogic Inc., All rights reserved.

