


- New York City and Miami metropolitan areas have greatest risk of storm surge
- Atlantic Coast contains 57% of the total homes at risk of storm surge flooding
CoreLogic® (NYSE: CLGX), a leading global property information, analytics and data-enabled solutions provider, today released its 2019 CoreLogic Storm Surge report, which shows more than 7.3 million single- and multifamily homes along the Gulf and Atlantic Coasts have the potential for storm surge damage, with a total estimated reconstruction cost value (RCV) of nearly $1.8 trillion. Early predictions from the National Oceanic and Atmospheric Administration (NOAA) indicate a near-normal year for the 2019 Atlantic hurricane season.
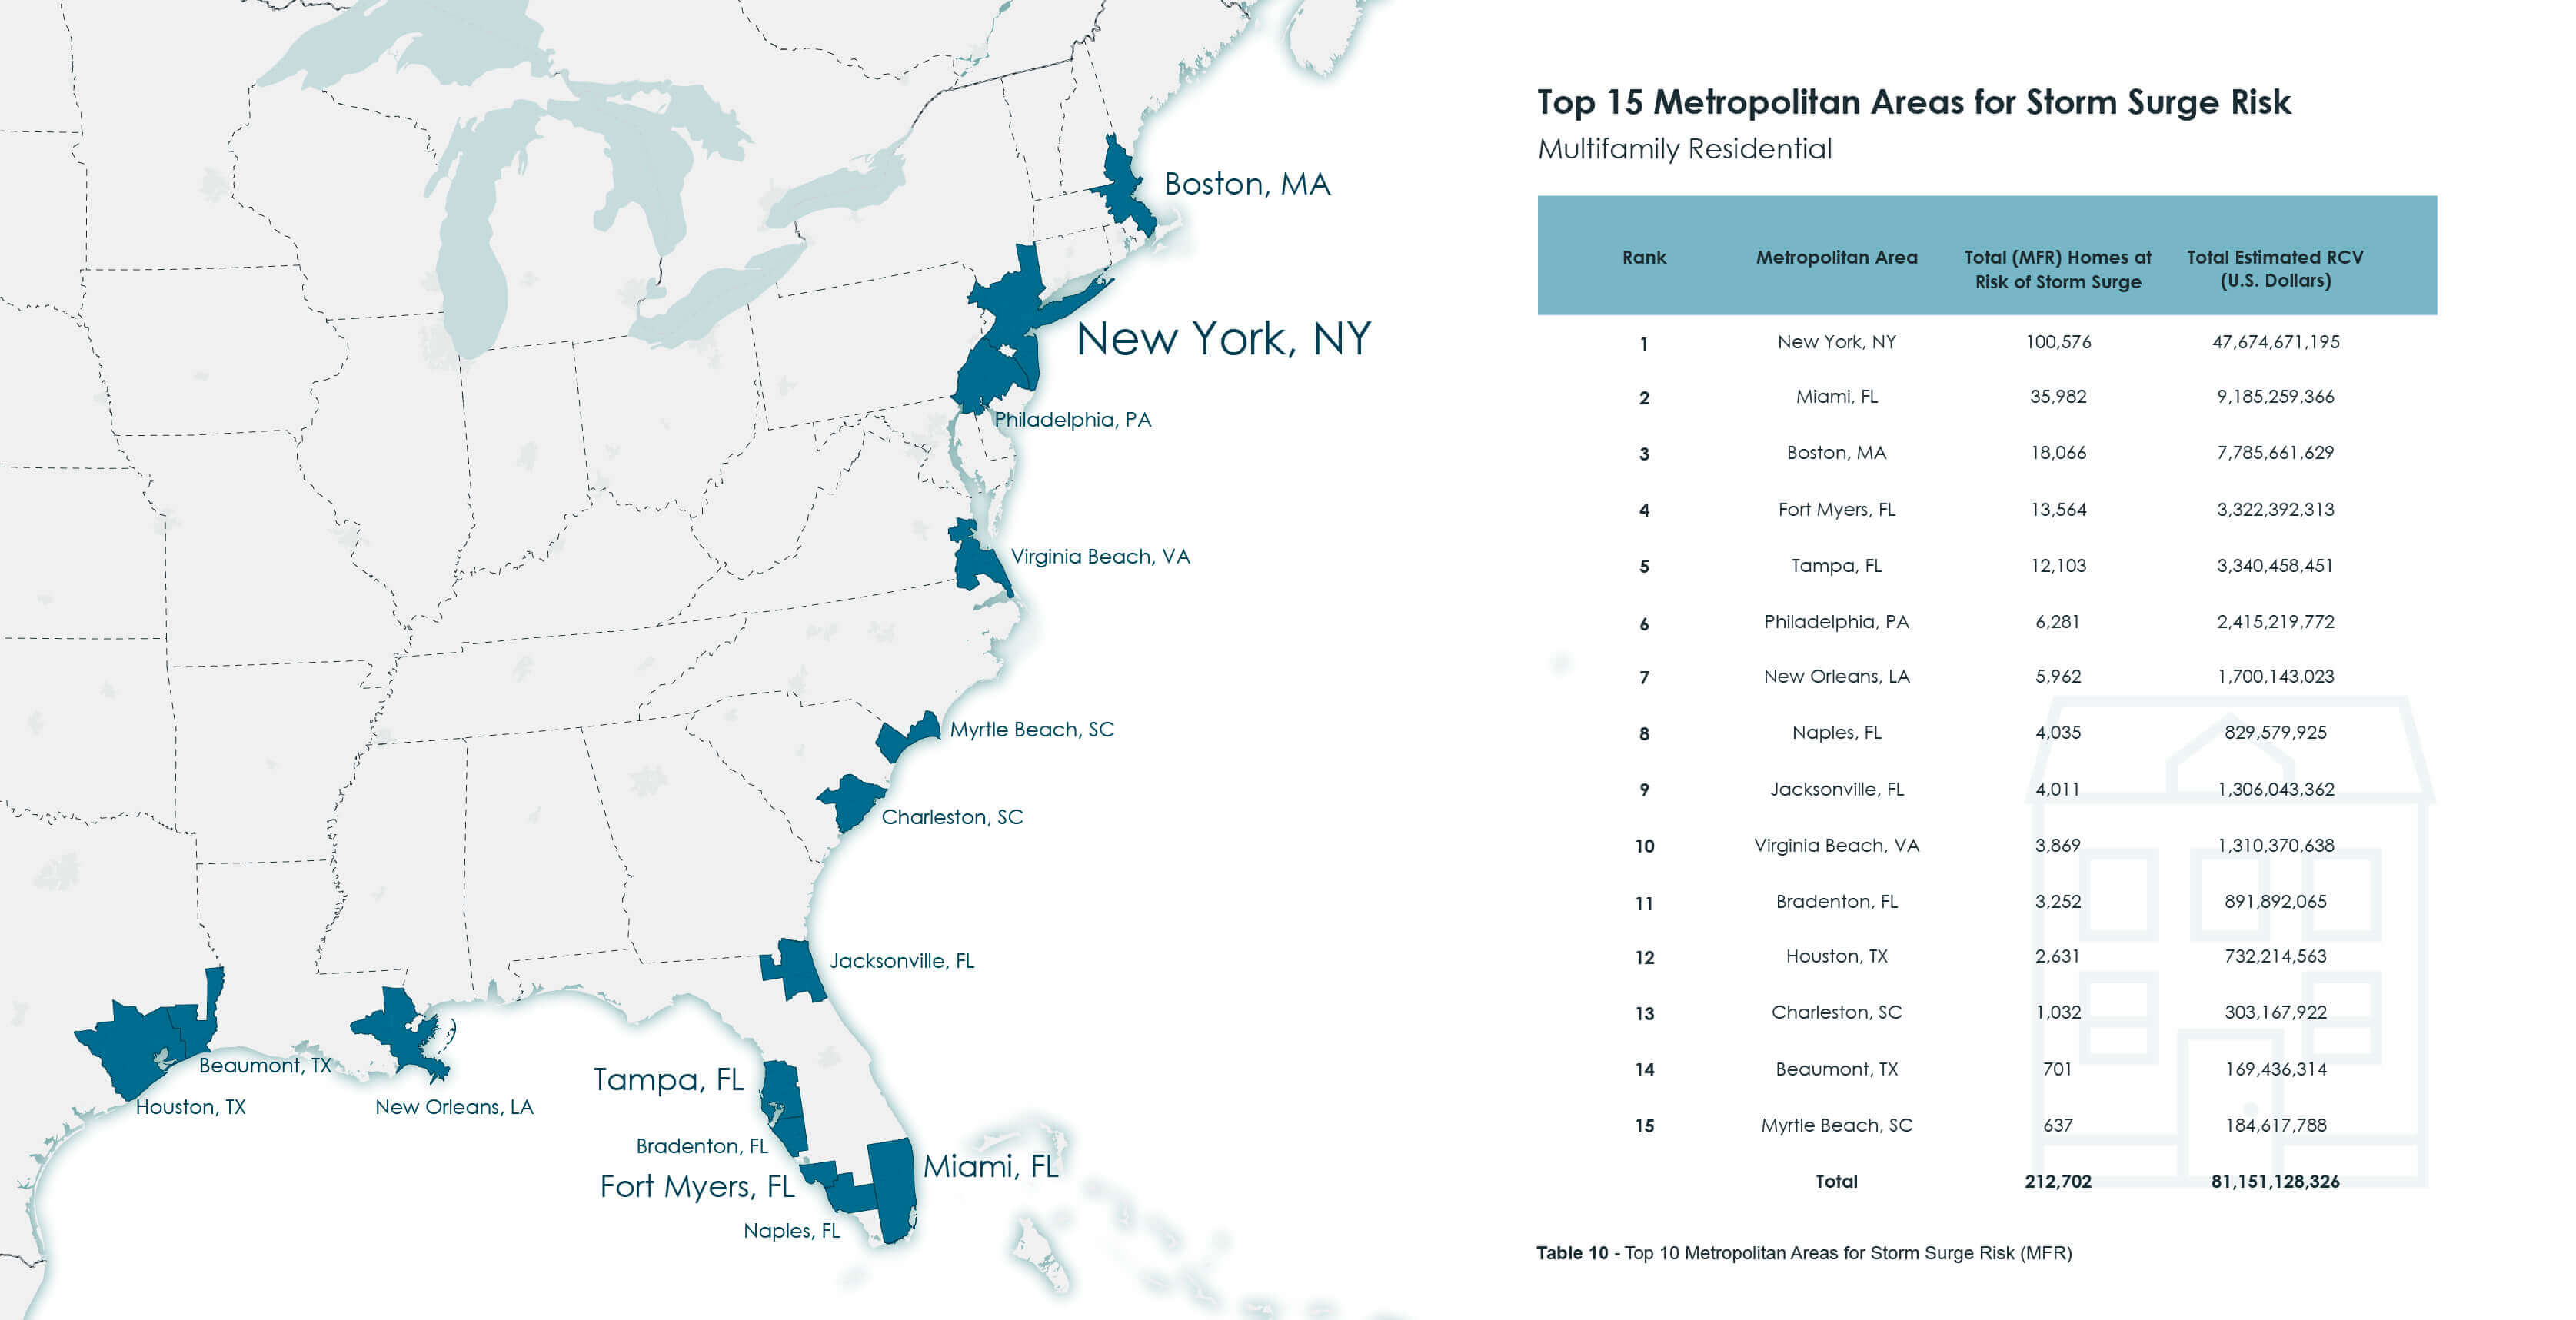
The CoreLogic Storm Surge report provides an annual evaluation of the number of homes in the United States that are vulnerable to storm surge in the Gulf of Mexico and Atlantic Basin, which includes every state from Texas to Maine, approximately 3,700 miles. The report also includes associated RCV of these properties, which is calculated using the combined cost of construction materials as well as equipment and labor. The analysis examines risk across 19 states and 85 Core-Based Statistical Areas (CBSA). This is the first year the Storm Surge report analysis includes multifamily structures, which encompass apartments, condominiums and multi-unit dwellings.
“It is essential to understand and evaluate the total hazard exposure of properties at risk of storm surge prior to a hurricane event, so insurers can better protect and restore property owners from financial catastrophe,” said Dr. Tom Jeffery, senior hazard scientist at CoreLogic. “Damage from storm surge and inland flooding has proven to be far more destructive than wind in recent years, so we cannot rely on the hurricane category alone to give us a sense of the potential loss. A Category 5 hurricane in an area with few structures may be far less devastating than a Category 1 hurricane in a densely populated area.”
Regional Implications
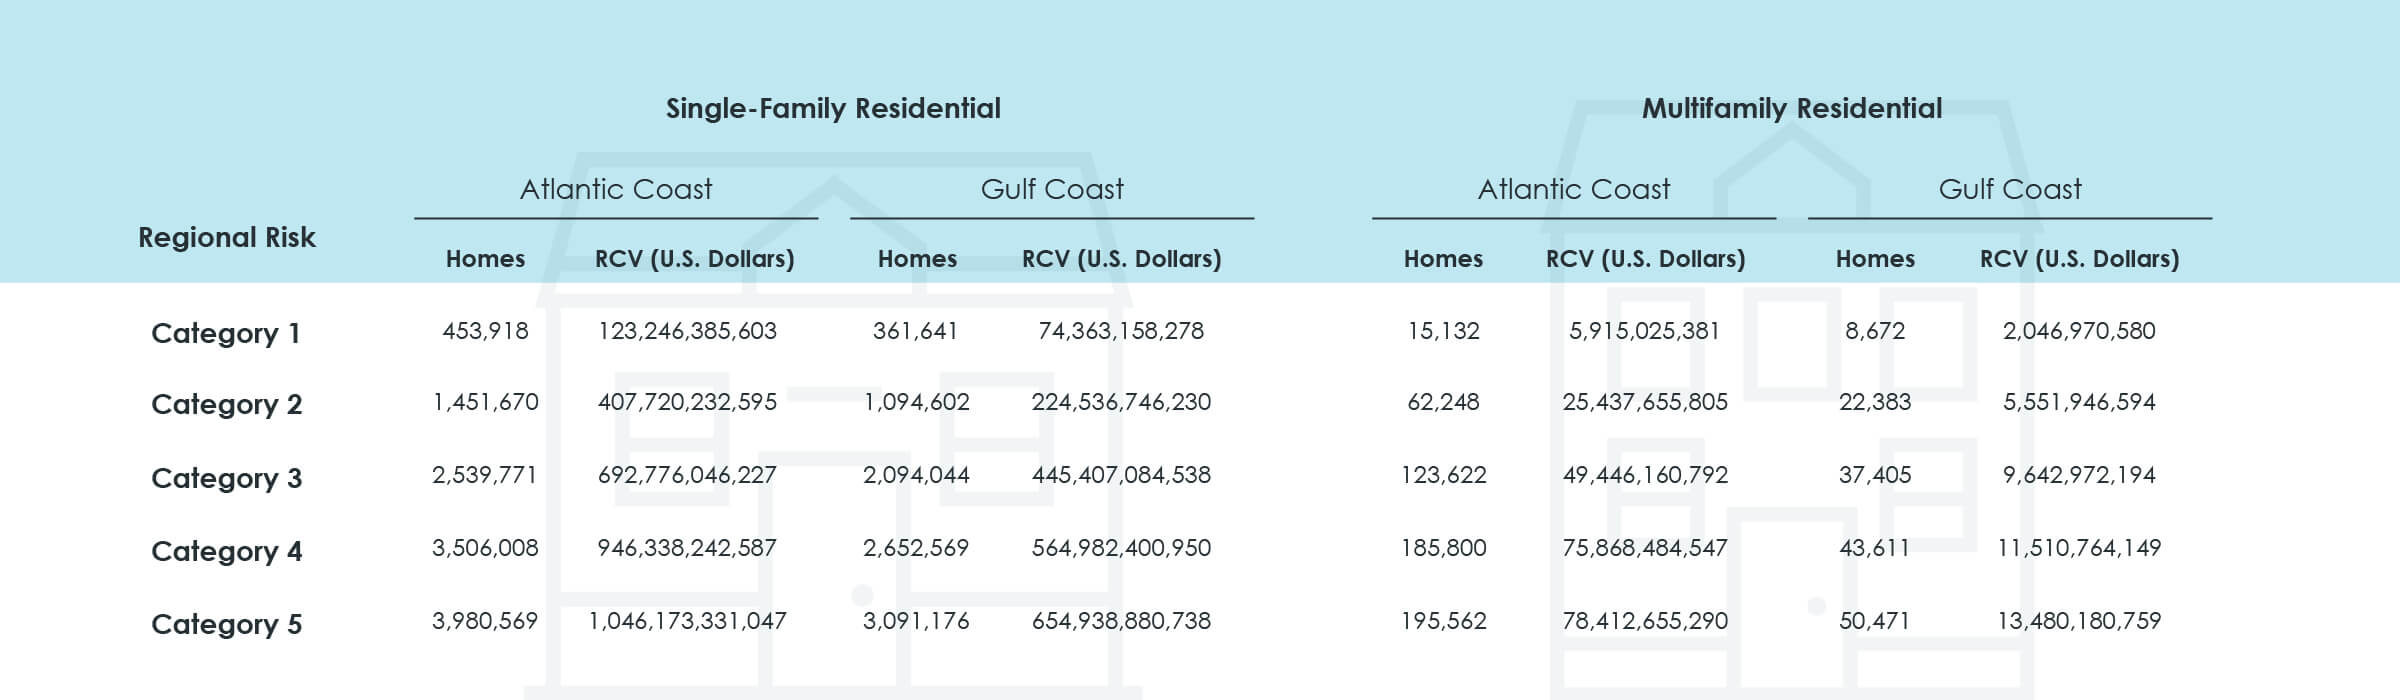
- The Atlantic Coast contains 57% of the total homes at risk of storm surge flooding and 62.7% of the total RCV. The region has more than 4.1 million homes at risk of storm surge with an RCV of over $1.1 trillion.
- Conversely, the Gulf Coast contains 43% of the homes at risk and 37.3% of the total RCV. The region has nearly 3.1 million homes at risk with over $668 billion in potential exposure to total destruction damage.
State Implications
- Florida, Louisiana, New York and Texas have the greatest number of homes at risk of storm surge.
- Florida has the most exposure to storm surge flooding, with more than 2.9 million homes at risk. The state also has the highest RCV at over $603 billion.
- Louisiana has the second most exposure to storm surge flooding, with more than 847,000 at-risk homes and the third highest RCV at over $202 billion.
- In New York, the density of the residential population near the coast makes it extremely vulnerable to flooding despite less frequent hurricane events. New York ranks third in the number of homes at risk (over 564,000) and second in RCV (over $240 billion).
- Texas ranks fourth with more than 561,000 at-risk homes. Texas has the fifth-highest RCV with more than $113 billion.
Metro Implications
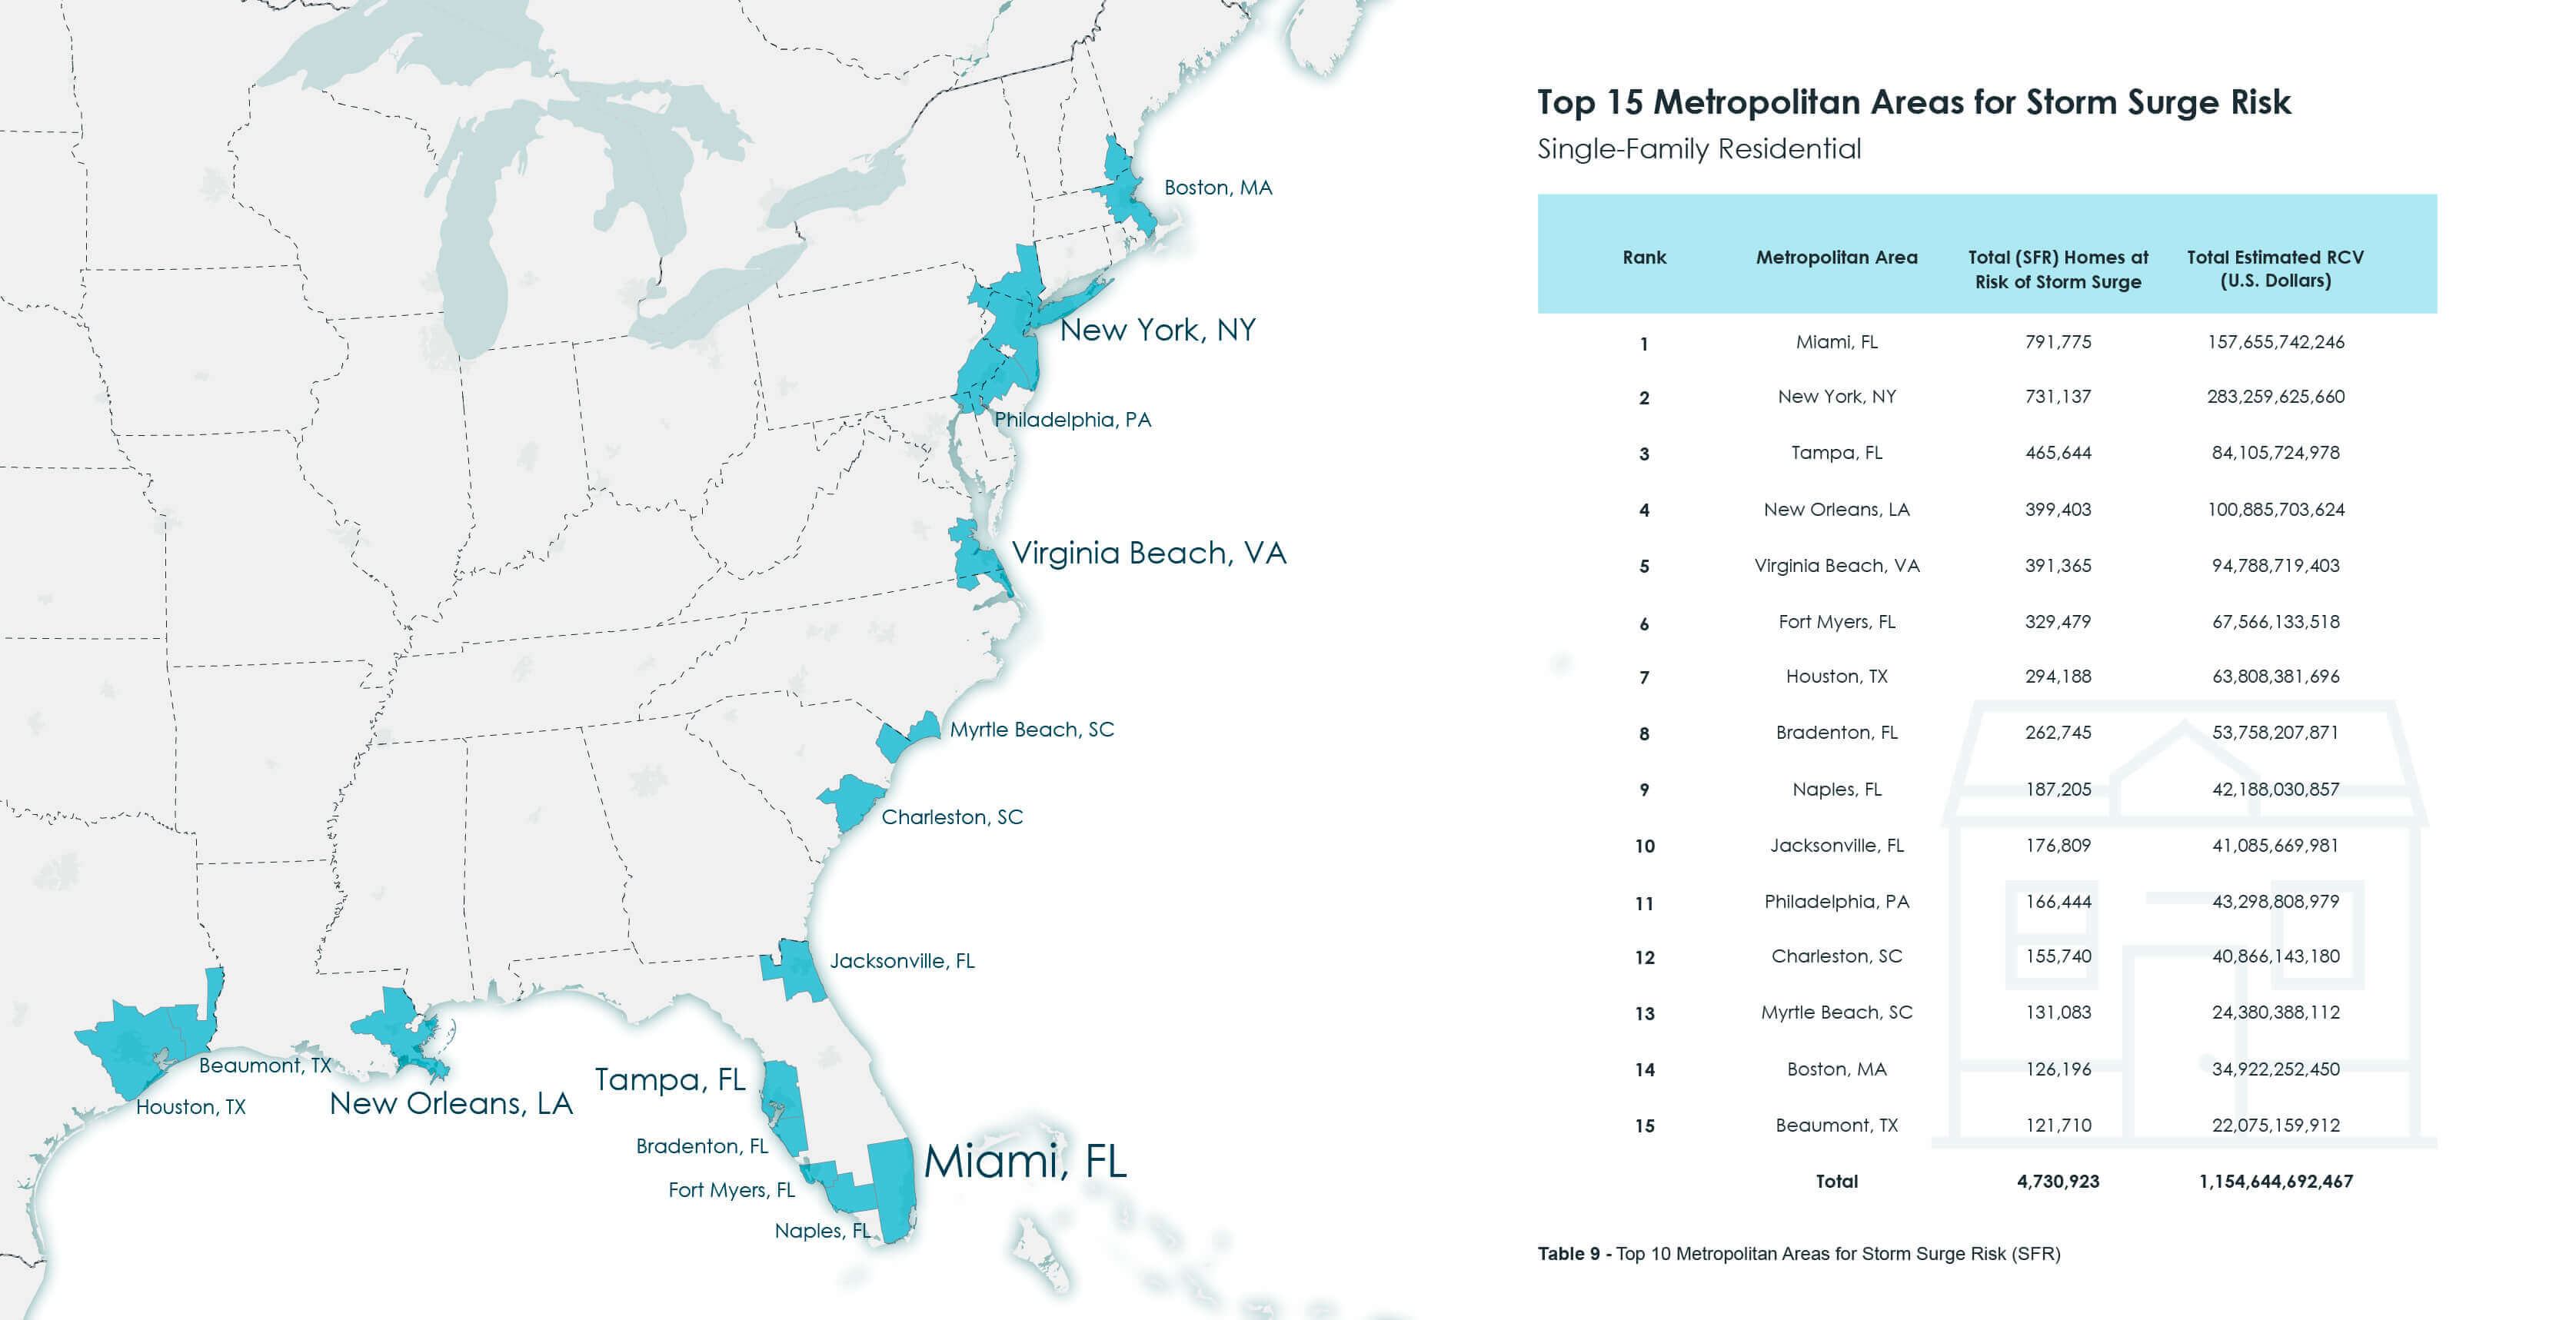
CoreLogic looked at 85 Core-Based Statistical Areas (CBSA) to determine the metropolitan areas with the greatest number of homes exposed to and the highest RCV from storm surge flooding.
- The New York, Newark and Jersey City metro area has the greatest risk of storm surge with just over 831,000 homes at risk and RCV of over $330 billion. Although this number of homes at risk is similar to that of the Miami metro area, the RCV for these homes is double Miami’s metro area RCV.
- The Miami, Florida metro area that includes Miami, Fort Lauderdale and West Palm Beach, Florida follows the New York metro area with more than 827,000 homes at risk and an RCV of $166 billion.
- Because of the density of residences in large metro areas, the top 15 CBSAs account for 67.5% of the total number of homes at risk and 68.9% of the total RCV for storm surge risk in the United States. This underscores the importance of considering location of future storms when assessing the potential for catastrophic damage.
Important notes regarding definitions:
Single-family and multifamily homes are provided in separate charts and categorized by level of exposure to storm surge hazard from Categories 1 through 5 hurricanes. RCV figures represent the cost to completely rebuild a property in case of damage assuming the worst-case scenario at 100% destruction. For more information about this data and what to expect from CoreLogic hurricane season reporting, contact us at [email protected] to get access to a recorded pre-season media-only webinar.
Note: These numbers are cumulative. A home being affected by a Category 1 storm would accordingly also be affected by a Category 5—so the highest Category represents the aggregate total.
Methodology
The analysis in the 2019 CoreLogic Storm Surge Report encompasses single-family residential structures less than four stories, including mobile homes, duplexes, manufactured homes and cabins (among other non-traditional home types). And, for the first time, the report also encompasses multifamily structures, which include apartments, condominiums and multi-unit dwellings. It is important to note that the inclusion of high-rise residential units such as those listed above may skew both the numbers associated with storm surge risk. This is because lower-level units are most likely to be affected, whereas the units above the second floor will rarely, if ever, experience storm surge flood damage.
Year-over-year changes between the number of homes at risk and the RCV can be the result of several variables, including new home construction, improved public records, enhanced modeling techniques, fluctuation in labor, equipment and material costs and even a potential rise in sea level. Indeed, this year’s addition of new data in the form of multifamily structures has increased the total number of structures at risk. For that reason, direct year over year comparisons should be warily considered. To estimate the value of property exposure of single-family residences, CoreLogic uses its RCV methodology, which estimates the cost to rebuild the home in the event of a total loss and is not to be confused with property market values or new construction cost estimation. Reconstruction cost estimates more accurately reflect the actual cost of damage or destruction of residential buildings that would occur from hurricane-driven storm surge, since they include the cost of materials, equipment and labor needed to rebuild. These estimates also factor in geographical pricing differences (although actual land values are not included in the estimates). The values in this report are based on 100% percent (or “total”), destruction of the residential structure. Depending on the amount of surge water from a given storm, there may be less than 100% damage to the residence, which would result in a lower realized RCV.
To evaluate storm surge risk at the local level, CoreLogic uses the designation of Core-Based Statistical Areas (CBSAs), which are often referred to as metropolitan areas (>50,000 people), or micropolitan areas (<50,000 people). The CBSA represents an urban center and the adjacent regions that are socioeconomically tied to that center. The specific areas identified in this report are named by primary urban center, though each may contain additional urban areas.
The high-resolution, granular modeling for underwriting individual risk allows enhanced understanding of the risk landscape and damage potentials. CoreLogic offers high-resolution solutions with a view of hazard and vulnerability consistent with the latest science for more realistic risk differentiation. The high-resolution storm surge modeling using 10m digital elevation model (DEM) and parcel-based geocoding precision from PxPoint™ facilitates a realistic view of the risk.
The probabilistic CoreLogic North Atlantic Hurricane Model, which can be accessed in the catastrophe modeling platform RQE®, is powered with unparalleled property data from CoreLogic. The combination of high-quality data and detailed modeling provides realistic and credible view of the potential risk to make informed business decisions, understand risk and accelerate recovery.
About CoreLogic
CoreLogic (NYSE: CLGX), the leading provider of property insights and solutions, promotes a healthy housing market and thriving communities. Through its enhanced property data solutions, services and technologies, CoreLogic enables real estate professionals, financial institutions, insurance carriers, government agencies and other housing market participants to help millions of people find, acquire and protect their homes. For more information, please visit www.corelogic.com.
CORELOGIC, the CoreLogic logo, RQE and PXPoint are trademarks of CoreLogic, Inc. and/or its subsidiaries. All other trademarks are the property of their respective owners.