Chat
Chat with Sales Hours: Monday-Friday 8:30 a.m. - 4:30 p.m. (CST)
Contact Sales
Call Sales Toll-Free 1-(866) 774-3282 Hours: Monday-Friday 7 a.m. - 5 p.m. (CST)
Product Login
Product Log-in
Product Support
Product Support
Email Sales
Contact Sales
After Hours
  • Support
  • Sign In Sign In
  • AUS NZ UK
CoreLogic - Home
  • Solutions
    view solutions by:

    Data Solutions

    • Lead Generation
    • Property Data
    • Location Intelligence

    Real Estate

    • Multiple Listing Enterprise
    • Agent & Broker

    Mortgage

    • Origination
    • Servicing
    • Appraisal
    • Commercial Property Tax

    Insurance

    • Hazard Risk
    • Catastrophe Risk Management
    • Risk Evaluation
    • Underwriting Automation
    • Weather
    • Claims Automation
    • Restoration
    • INTRCONNECT

    Mortgage Lenders

    • Origination

    Mortgage Servicers

    • Residential Property Tax
    • Default & Loss Mitigation
    • Portfolio Insight & Monitoring

    Mortgage Appraisers

    • Appraisal

    Real Estate Agents & Brokers

    • Agents & Brokers

    Real Estate MLS

    • Multiple Listing Enterprises

    Commercial Real Estate Owners

    • Commercial Property Tax

    Marketing Departments

    • Property Data

    Insurance Underwriters

    • Risk Evaluation
    • Underwriting Automation
    • Hazard Risk
    • Catastrophe Risk Management

    Insurance Risk Managers

    • Risk Evaluation
    • Hazard Risk
    • Catastrophe Risk Management

    Insurance Claims

    • Claims Automation
    • Restoration Contractors
    • Weather Verification

    Construction Contractors

    • Restoration Contractors

    General

    • Location Intelligence
    • Lead Generation
    • Data Solutions
  • Resources

    Reports

    • Climate Change
    • Construction Cost Update
    • Construction Insights
    • Home Price Insights
    • Homeowner Equity Insights
    • Loan Performance Insight
    • Mortgage Fraud
    • Property Tax Delinquency
    • Single-Family Rent Index

    Insight Blogs

    • Hazard HQ
    • Office of Chief Economist
    • Affordable Housing
    • Homebuying
    • Insurance
    • Other Articles

    More Resources

    • Events
    • Case Studies
    • White Papers
    • Podcasts
    • Quick Takes
  • Company
    • About
    • Leadership
    • Newsroom
    • Contact
    • Careers
  • Search
CoreLogic - Home
  • Solutions
  • Resources
  • Company

    • About
    • Leadership
    • Newsroom
    • Contact
    • Careers
  • Accounts

    • Products Sign-in
  • Contact

    • Sales Contact
    • Product Support
  • Regions

    • Australia
    • New Zealand
    • United Kingdom
  • Social

    • Facebook
    • Instagram
    • Linkedin
    • Twitter
    • Youtube
Solutions
VIEW BY:
  • Data Solutions

    • Lead Generation
    • Property Data
    • Location Intelligence
  • Real Estate

    • Multiple Listing Enterprise
    • Agent & Broker
  • Mortgage

    • Origination
    • Servicing
    • Appraisal
    • Commercial Property Tax
  • Insurance

    • Hazard Risk
    • Catastrophe Risk Management
    • Risk Evaluation
    • Underwriting Automation
    • Weather
    • Claims Automation
    • Restoration
    • INTRCONNECT
  • Mortgage Lenders

    • Origination
  • Mortgage Servicers

    • Residential Property Tax
    • Default & Loss Mitigation
    • Portfolio Insight & Monitoring
  • Mortgage Appraisers

    • Appraisal
  • Real Estate Agents & Brokers

    • Agents & Brokers
  • Real Estate MLS

    • Multiple Listing Enterprises
  • Commercial Real Estate Owners

    • Commercial Property Tax
  • Marketing Departments

    • Property Data
  • Insurance Underwriters

    • Risk Evaluation
    • Underwriting Automation
    • Hazard Risk
    • Catastrophe Risk Management
  • Insurance Risk Managers

    • Risk Evaluation
    • Hazard Risk
    • Catastrophe Risk Management
  • Insurance Claims

    • Claims Automation
    • Restoration Contractors
    • Weather Verification
  • Construction Contractors

    • Restoration Contractors
  • General

    • Location Intelligence
    • Lead Generation
    • Data Solutions
Resources
  • Reports

    • Climate Change
    • Construction Cost Update
    • Construction Insights
    • Home Price Insights
    • Homeowner Equity Insights
    • Loan Performance Insight
    • Mortgage Fraud
    • Property Tax Delinquency
    • Single-Family Rent Index
  • Insight Blogs

    • Hazard HQ
    • Office of Chief Economist
    • Affordable Housing
    • Homebuying
    • Insurance
    • Other Articles
  • More Resources

    • Events
    • Case Studies
    • White Papers
    • Podcasts
    • Quick Takes

Home / Intelligence / Blogs / Office of the Chief Economist / 2018 HMDA Data: High Debt-to-Income Ratio Was the Top Reason for Mortgage Denials

ABOUT THE AUTHOR
Yanling Mayer
Yanling Mayer
Principal, Economist
View Profile
  • September 26, 2019

2018 HMDA Data: High Debt-to-Income Ratio Was the Top Reason for Mortgage Denials

More than 1-in-2 denied applications had a DTI above the 43% QM threshold


The Consumer Financial Protection Bureau recently released the 2018 loan-level mortgage lending data submitted by more than 5,600 commercial banks, savings associations, credit unions and mortgages companies covered by the Home Mortgage Disclosure Act (HMDA).  One of the new mandates in the 2018 HMDA reporting was the requirement of reporting reason(s) of denial when lenders turned down an application.[1] The new requirement has provided an important data point for furthering the understanding of likely gaps between the demand and supply of housing credit, which in turn are helpful in policy deliberations of homeownership and access to housing credit.

In 2018, 2.65 million loan applications secured by single-family one- to four-unit properties (including manufactured homes) were denied, making the overall denial rate 24.7%. The denial rate was calculated as the total number of denied applications divided by the total number of applications, excluding applications that were withdrawn by applicants or were closed by lenders due to an incomplete application file. Applications of all lien status (first or subordinate) and occupancy status (principal residence, second residence, or investment property) were included in the analysis.

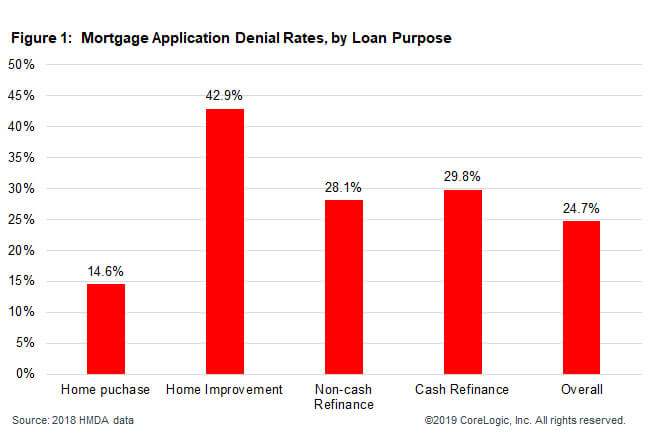
When broken down by loan purpose (Figure 1), application denial rates were the lowest in home purchase (14.6%), nearly doubled in non-cash-out refinance (28.1%), and more than tripled in home improvement loans (42.9%).  With refinance applications, cash-out refinance was denied at a slightly higher rate (29.8%) than non-cash-out refinance.

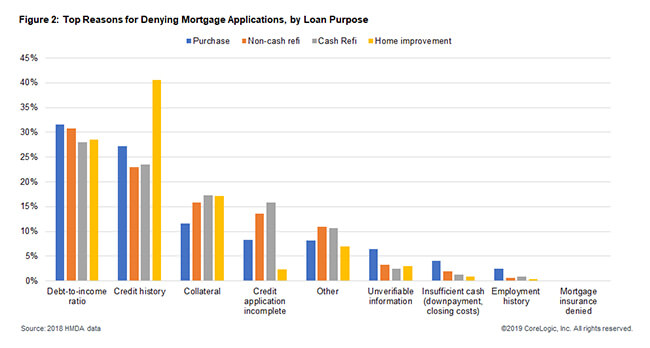
Although up to a total of four reasons are reportable according to the new HMDA rule, the majority of the applications (76.7%) cited just one reason, and it was rare for lenders to report more than two reasons (4.1%).  The number one reason reported by lenders for turning down applications was due to applicants’ potential indebtedness burden as measured by the debt-to-income ratio (Figure 2).  Higher debt-to-income ratio (DTI) was responsible for more than 36.8% of denied home-purchase applications, 34.3% of denied non-cash-out refinance, and 31.9% of denied cash-out refinance.[2]

Credit history was the second most frequently reported reason – responsible for 33.9% of denied purchase applications, 27.5% of denied of cash-out refi, 37.1% of denied cash-out refi, and as much as 46.7% of denied home improvement applications. More than 70% of home-improvement loan applications were second liens, which might explain lenders’ caution in home improvement loan underwriting.

The third most frequently reported reason was related to the collateral securing the loans. Collateral was more frequently cited for denials of home improvement loans (24.7%) and non-cash-out refinance (19.1%).  In home-purchase applications, collateral was responsible for just 13.3% of denials.  Additionally, about 9% of purchase applications were denied due to insufficient cash for down payment or closing cost.

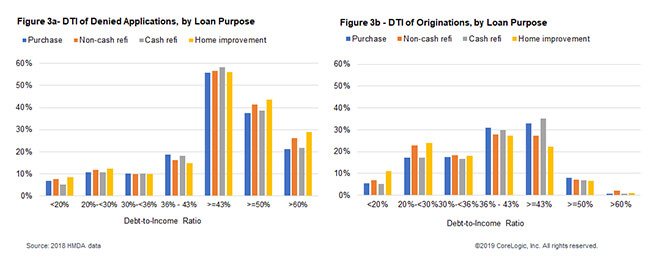
Clearly, many applications were denied largely due to the risk of a high degree of household indebtedness.  Approved applications, on the other hand, generally had much lower DTI (Figure 3a vs. Figure 3b).  In home purchases for example, more than one-in-two denied applications (53.1%) had a DTI above 43% – the threshold established by the CFPB for qualified mortgages (QM), compared to 29.1% of purchase originations with a DTI above 43%. Cash-out refinance had the highest percentage of DTI exceeding the 43% threshold in either denied applications (55.6%) or originations (35.1%).

Also, a DTI ratio above 50% or 60% was common among denied applications but was rare among originations. For instance, 37.5% of denied purchase applications had a DTI at 50% or higher and 21.3% had a DTI more than 60% – versus 7.9% of purchase originations had a DTI at 50% or more and 0.6% had a DTI more than 60%.

Many factors could potentially affect access to credit, including supply side factors such as funds availability, credit standards, or government regulations.  A glance into the 2018 HMDA data showed that on the demand side, higher DTI and weak credit history were overwhelmingly responsible for an inability to access credit by many prospective borrowers.

[1] In prior HMDA reporting, it was not mandatory for lenders to report reasons of denial. In 2017, for example, only about 72.1% of denied purchase applications and 66.2% of denied refinance applications had at least one reported denial reason (reference: “Data Point: 2018 Mortgage Market Activity and Trends,” by Consumer Financial Protection Bureau, August 2018.)

[2] Note: The sum across various reasons may add up to more than 100% because lenders can report more than one denial reason. More than one denial reason was provided for 23.3% of denied applications.

©2019 CoreLogic, Inc. All rights reserved.

  • Category: Blogs, Intelligence, Office of the Chief Economist
ABOUT THE AUTHOR
Yanling Mayer
Yanling Mayer
Principal, Economist
View Profile

Related Posts

mississippi tornadoes
Blogs

March 24 EF-4 Tornado in Mississippi

CoreLogic estimates over 4,100 homes were within the path of the tornado that hit Mississippi on March 24, 2023.

March 29, 2023
California Atmospheric Rivers
Core Conversations

What Was it Really Like to Live Through the California Floods? Our Team Spills | Part 2

In Part 2, host Maiclaire Bolton Smith talks about the atmospheric rivers and the snow that has made headlines and headway in altering California’s natural hazard landscape.

March 29, 2023
CSI_Promo_Mar2023
Blogs

US CoreLogic S&P Case-Shiller Index Gain Slows to Pre-Pandemic Low, Up by 3.8% Year Over Year in January

The index continued to decline year over year in January, again posting a single-digit gain.

March 28, 2023

About Corelogic

  • Newsroom
  • Leadership
  • Careers
  • Ethics & Compliance

Accounts

  • Products Sign-in

Contact

  • Sales Contact
  • Product Support

Regions

  • CoreLogic Australia
  • CoreLogic New Zealand
  • CoreLogic UK

Follow & Connect

  • Facebook
  • Instagram
  • Linkedin
  • Twitter
  • YouTube
© 2023 CoreLogic. All rights reserved.
  • Legal
  • Privacy Policy
  • CCPA
  • Cookie Preferences
  • Security
  • Sitemap
  • Accessibility
  • Legal
  • Privacy Policy
  • CCPA
  • Cookie Preferences
  • Security
  • Sitemap
  • Accessibility