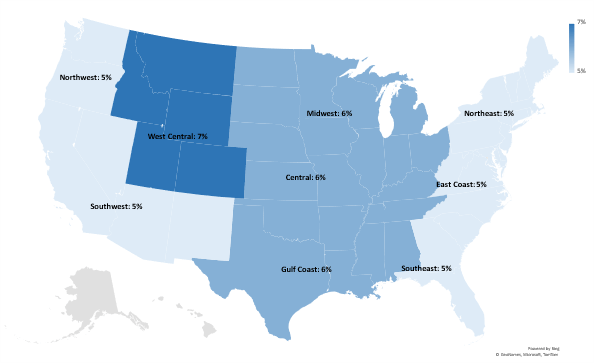
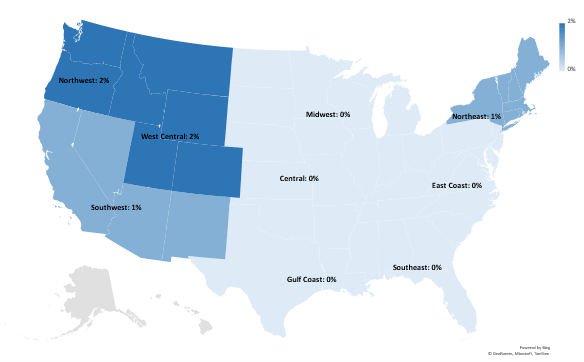
Defined Regions
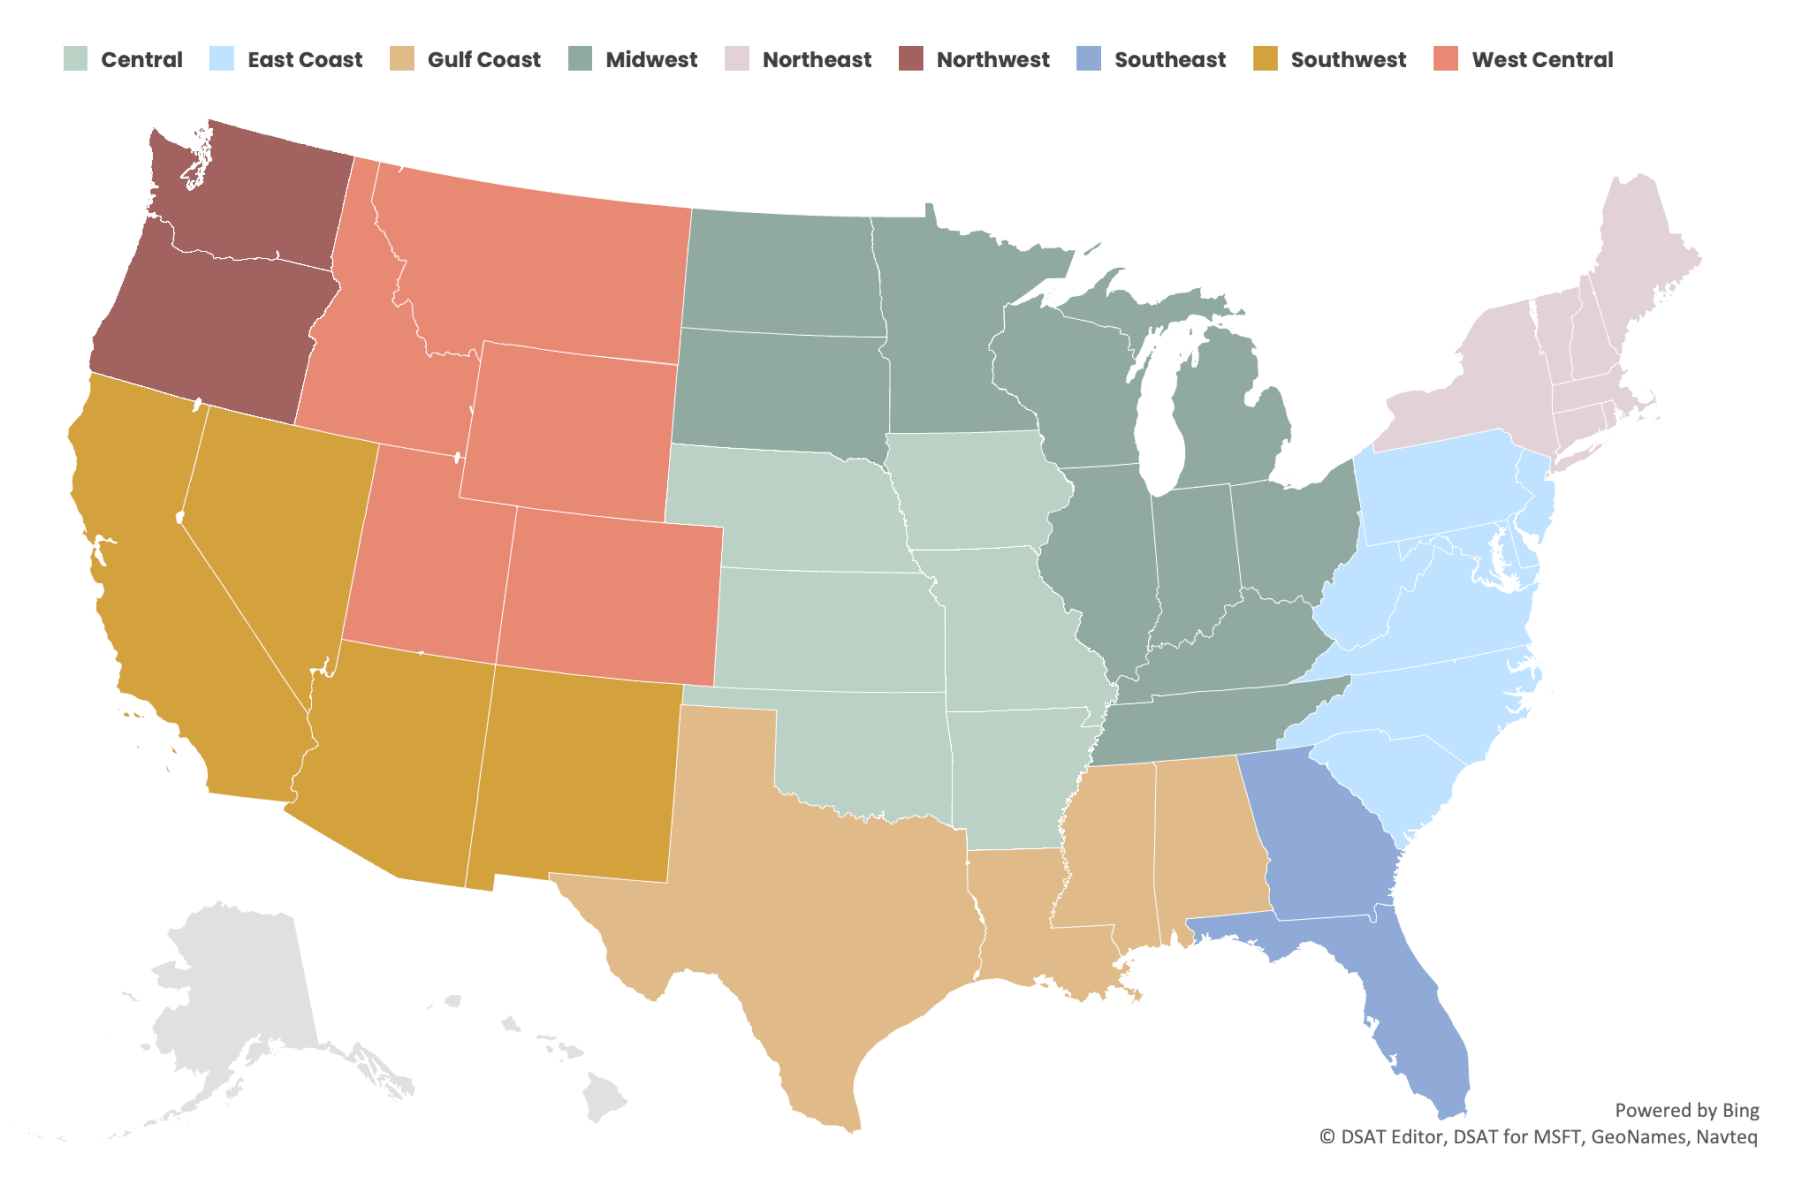
CoreLogic curates this monthly bulletin of regional construction cost insights, which are reflected in the CoreLogic Claims Pricing Database. We combine the current month’s pricing data with four common loss scenarios to create models illustrating market impacts that are applied across nine regions and compared month over month and year over year.
Our experts provide detailed analyses of changes and trends to provide additional insight into key drivers. View our Construction Database Pricing Methodology whitepaper to gain additional insight into how we populate cost values.
June Pricing Insights
CoreLogic’s Pricing Analysis & Delivery team continues to focus on material and equipment pricing as we enter storm and hurricane season. Through market surveys and valued feedback from customer focus groups, we continue to hone our pricing database on a monthly basis.
We invite you to contribute to our pricing team’s real-time data collection of labor rates.
Report Highlights
Material
Lumber-based components such as fencing, framing, and rough carpentry were the biggest downward movers this month.
- Overall, framing materials have declined by over 35% in all regions, but the Northwest, Southeast, and Southwest have declined by over 40%.
- Fencing materials have decreased by over 25% in all regions, with the East Coast, Southeast, and Southwest leading the way, declining by more than 30% when compared with 2022 highs.
- Drywall showed minimal increases versus the prior month, but materials remained 18.3% higher when compared to the same time period 12 months ago. The Central, East Coast, and Southeast regions of the U.S. all saw increases exceeding 20%.
Labor
According to market surveys, labor costs in most regions are nearly 20% higher than this time last year, with Central, Midwest, Northeast, and West-Central regions displaying significantly higher cost increases of 25.9%, 27.7%, 20.3%, and 23.7% respectively. June marks the first month in 2023 when no movement occurred in any region.
Several other categories, including carpenters, painters, and general laborers, are nearing similar labor rates to 12 months ago, but are still higher than the pricing from early 2022.
The Pricing Analysis & Delivery team will enhance claims labor rate formulas during the second half of this year. These changes will be published in a refreshed Construction Database Pricing Methodology whitepaper for release in the coming months.
Equipment
Based on your feedback, we are completing a holistic review of the claims equipment rental category this month and updates to line-items pricing will be reflected in upcoming pricing database releases.
Property Claim Scenarios
CoreLogic has replicated the estimating components found in the following most common loss scenarios to demonstrate how changes in pricing impact typical loss costs.
Fire/Lightning (Large Loss) Insights: 12-Month Trend
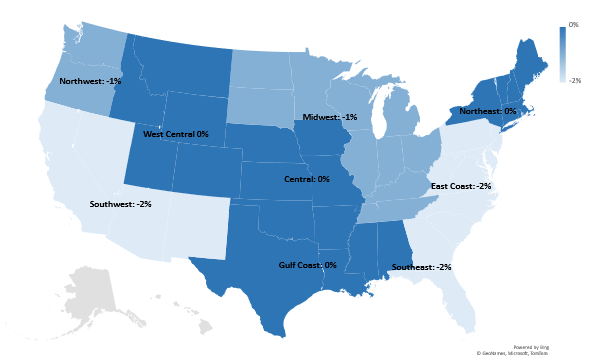
Fire/Lightning (Large Loss)
In this category, large loss claims from a fire are modeled for a scenario where all home construction components are affected and losses exceed $100,000.
- All regions continued seeing a downward trend this month, leading the large loss scenario to just below -0.9%, which was June 2022 pricing.
- Easing labor rates and declines in some material costs are key contributors to the movement seen in the large loss scenario.
- Three labor rate categories — drywallers, insulators, and plasterers — have stood out in elevation over the past 12 months. In contrast, labor rates for carpenters are closing in on June 2022 rates, remaining just 1.5% higher on average across all regions.
- Much like their labor counterparts, drywall and insulation materials remain elevated over the last year, while significant reductions in framing materials and cabinetry pricing have occurred to help ease this loss scenarios pricing.
Wind/Hail (Exterior/Roof) Insights: 12-Month Trend
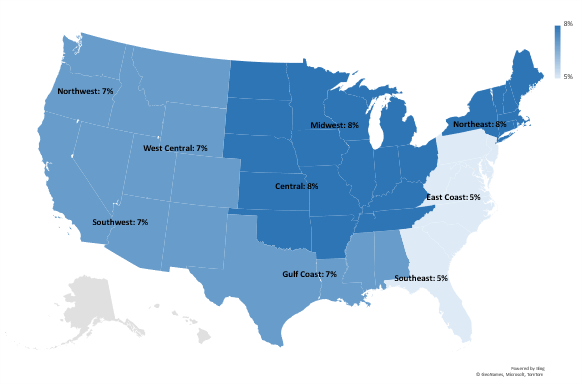
Wind/Hail (Exterior/Roof)
This category represents losses due to weather activity consisting of wind and/or hail. Restoration from this damage requires roof replacement, partial siding replacement, and accompanying accessories.
- On average, the wind/hail scenario remained unchanged month over month, which is consistent with the leveling of labor costs and the material pricing for roofing and windows over the past month.
- Looking at the past 12 months, this scenario is up 6.98% across all regions due to elevated roofing and window materials costs versus June of 2022. Roofing labor costs have increased by 20% compared to June 2022 pricing.
- Conversely, fencing prices continue a gradual month-over-month decline, widening the gap from the high prices we experienced a year ago. Siding remains on par with 2022 costs.
Water (Interior Reconstruction) Insights: 12-Month Trend
- Like the wind/hail scenario, there has been little movement in the interior reconstruction loss scenario compared to last month. Labor rates remained consistent month over month; however, it is worth noting that this scenario is up by 5.5% compared to 2022.
- Drywall and painting material driver rates both increased month over month, but the average increase was less than 1% for all regions. The Central U.S. and East Coast were the only two regions that experienced reportable drywall cost increases of 1.9% and 3.2%, respectively.
- We noted no monthly drywall or paint labor cost increases; however, over the previous 12 months, drywall and paint labor costs both remain elevated by 21.6% and 3.3%, respectively.
Water Mitigation (Drying) Insights: 12-Month Trend
Water Mitigation (Drying)
Typical drying costs for a residential structure include water extraction, removal of wet material, and use of drying equipment.
- There has been no significant movement in overall water mitigation costs month over month, and the stabilization of water remediation technician labor rates this month is a contributing factor.
- Water remediation technician labor rates have increased by 14.3% since this time last year. This remains the largest driver of the water mitigation pricing scenario and addresses the overall 10.3% cost increase over the last 12 months.
- CoreLogic’s pricing team is investigating water mitigation equipment rates to ensure that our pricing database reflects the pace of change we have observed in recent market trends.
About CoreLogic Data Research
CoreLogic develops this report using up-to-date materials and labor costs. CoreLogic’s team of analysts continuously researches hard costs such as labor, material and equipment – including mark-ups. CoreLogic updates its database every month accordingly.
Our research also covers soft costs such as taxes and fringe benefits for reconstruction work performed as part of the insurance industry. CoreLogic monitors demographics and econometric statistics, government indicators and localization requirements, including market trends from thousands of unique economies throughout the United States.
Other factors in this process include the following:
- Wage rates for more than 85 union and non-union trades
- Over 100,000 construction data points
- Productivity rates and crew sizes
- Building code requirements and localized cost variables
Additionally, we validate cost data by analyzing field inspection records, contractor estimates, phone surveys, and both partial and complete loss claim information.
Please complete the online form to provide feedback or request information on any items in our construction database. Please contact your sales executive or account manager for additional explanations or questions. A more detailed methodology explanation can be found in our Construction Database Pricing Methodology Whitepaper.
About CoreLogic
CoreLogic is the leading property insights and technology solutions provider enabling healthy housing markets and thriving communities. Through its enhanced property data solutions, services and technologies, CoreLogic enables real estate professionals, financial institutions, insurance carriers, government agencies and other housing market participants to help millions of people find, buy and restore their homes. For more information, please visit www.corelogic.com.
NOTE: The building material, labor and other cost information in this bulletin is generated using research, sources and methods current as of the date of this bulletin and is intended only to provide an estimated average of reconstruction cost trends in the specified general geographic regions of the United States. This cost information may vary further when adjusting claim values for specific property locations or specific business conditions.