Chat
Chat with Sales Hours: Monday-Friday 8:30 a.m. - 4:30 p.m. (CST)
Contact Sales
Call Sales Toll-Free 1-(866) 774-3282 Hours: Monday-Friday 7 a.m. - 5 p.m. (CST)
Product Login
Product Log-in
Product Support
Product Support
Email Sales
Contact Sales
After Hours
  • Support
  • Sign In Sign In
  • AUS NZ UK
CoreLogic - Home
  • Solutions
    view solutions by:

    Data Solutions

    • Lead Generation
    • Property Data
    • Location Intelligence

    Real Estate

    • Multiple Listing Enterprise
    • Agent & Broker

    Mortgage

    • Point of Sale
    • Origination
    • Servicing
    • Appraisal
    • Commercial Property Tax

    Insurance

    • Hazard Risk
    • Catastrophe Risk Management
    • Risk Evaluation
    • Underwriting Automation
    • Weather
    • Claims Automation
    • Restoration

    Mortgage Lenders

    • Point of Sale
    • Origination

    Mortgage Servicers

    • Residential Property Tax
    • Default & Loss Mitigation
    • Portfolio Insight & Monitoring

    Mortgage Appraisers

    • Appraisal

    Real Estate Agents & Brokers

    • Agents & Brokers

    Real Estate MLS

    • Multiple Listing Enterprises

    Commercial Real Estate Owners

    • Commercial Property Tax

    Marketing Departments

    • Property Data

    Insurance Underwriters

    • Risk Evaluation
    • Underwriting Automation
    • Hazard Risk
    • Catastrophe Risk Management

    Insurance Risk Managers

    • Risk Evaluation
    • Hazard Risk
    • Catastrophe Risk Management

    Insurance Claims

    • Claims Automation
    • Restoration Contractors
    • Weather Verification

    Construction Contractors

    • Restoration Contractors

    General

    • Location Intelligence
    • Lead Generation
    • Data Solutions
  • Resources

    Reports

    • Climate Change
    • Construction Claims Bulletin
    • Construction Cost Update
    • Construction Insights
    • Home Price Insights
    • Homeowner Equity Insights
    • Loan Performance Insight
    • Mortgage Fraud
    • Property Tax Delinquency
    • Single-Family Rent Index

    Insight Blogs

    • Hazard HQ
    • Office of Chief Economist
    • Affordable Housing
    • Homebuying
    • Insurance
    • Other Articles

    More Resources

    • Events
    • Case Studies
    • White Papers
    • Podcasts
    • Quick Takes
  • Company
    • About
    • Leadership
    • Newsroom
    • Contact
    • Careers
  • Search
CoreLogic - Home
  • Solutions
  • Resources
  • Company

    • About
    • Leadership
    • Newsroom
    • Contact
    • Careers
  • Accounts

    • Products Sign-in
  • Contact

    • Sales Contact
    • Product Support
  • Regions

    • Australia
    • New Zealand
    • United Kingdom
  • Social

    • Facebook
    • Instagram
    • Linkedin
    • Twitter
    • Youtube
Solutions
VIEW BY:
  • Data Solutions

    • Lead Generation
    • Property Data
    • Location Intelligence
  • Real Estate

    • Multiple Listing Enterprise
    • Agent & Broker
  • Mortgage

    • Point of Sale
    • Origination
    • Servicing
    • Appraisal
    • Commercial Property Tax
  • Insurance

    • Hazard Risk
    • Catastrophe Risk Management
    • Risk Evaluation
    • Underwriting Automation
    • Weather
    • Claims Automation
    • Restoration
  • Mortgage Lenders

    • Point of Sale
    • Origination
  • Mortgage Servicers

    • Residential Property Tax
    • Default & Loss Mitigation
    • Portfolio Insight & Monitoring
  • Mortgage Appraisers

    • Appraisal
  • Real Estate Agents & Brokers

    • Agents & Brokers
  • Real Estate MLS

    • Multiple Listing Enterprises
  • Commercial Real Estate Owners

    • Commercial Property Tax
  • Marketing Departments

    • Property Data
  • Insurance Underwriters

    • Risk Evaluation
    • Underwriting Automation
    • Hazard Risk
    • Catastrophe Risk Management
  • Insurance Risk Managers

    • Risk Evaluation
    • Hazard Risk
    • Catastrophe Risk Management
  • Insurance Claims

    • Claims Automation
    • Restoration Contractors
    • Weather Verification
  • Construction Contractors

    • Restoration Contractors
  • General

    • Location Intelligence
    • Lead Generation
    • Data Solutions
Resources
  • Reports

    • Climate Change
    • Construction Claims Bulletin
    • Construction Cost Update
    • Construction Insights
    • Home Price Insights
    • Homeowner Equity Insights
    • Loan Performance Insight
    • Mortgage Fraud
    • Property Tax Delinquency
    • Single-Family Rent Index
  • Insight Blogs

    • Hazard HQ
    • Office of Chief Economist
    • Affordable Housing
    • Homebuying
    • Insurance
    • Other Articles
  • More Resources

    • Events
    • Case Studies
    • White Papers
    • Podcasts
    • Quick Takes

Home / Intelligence / Blogs / Office of the Chief Economist / Millennials are Driving the Demand for Condos as Sales Increase in Certain Markets – 2019 Data Reveals

ABOUT THE AUTHOR
Archana Pradhan
Archana Pradhan
Principal, Economist, Office of the Chief Economist
View Profile
  • August 17, 2020

Millennials are Driving the Demand for Condos as Sales Increase in Certain Markets – 2019 Data Reveals

Austin, New York, and Naples experienced increase in condo sales in 2019


For millennials, first-time homebuyers (FTHBs), and down-sizing baby boomers, condos can be the most reasonable option when buying a property. Their values and lifestyle drive them toward buying condos because they tend to be more affordable than single-family homes and because condos typically come with a lower maintenance burden and are mostly located in urban cores.

Figure 1: Condo Share of Total Sales by States, 2019

Based on the top 25 markets, the average sale price of condos in 2019 was 16% lower than the average sale price of single-family residences.[1]

To support that point, CoreLogic Fraud Consortium Loan Application data shows that FTHBs gravitate toward condos. Last year, about 40% of all condo-purchase mortgage applications were submitted by FTHBs, compared to just 33% of all non-condo purchase mortgage applications by the same group. Additionally, the data shows condos were more popular with millennials – 47% of all condo-purchase mortgage applications were submitted by millennials in 2019, up 2% from 2018.

Figure 2: Condo Sales

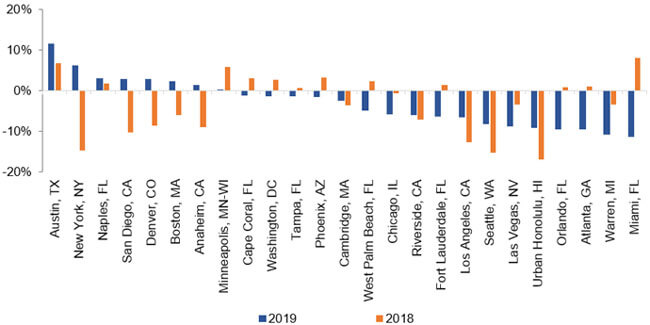
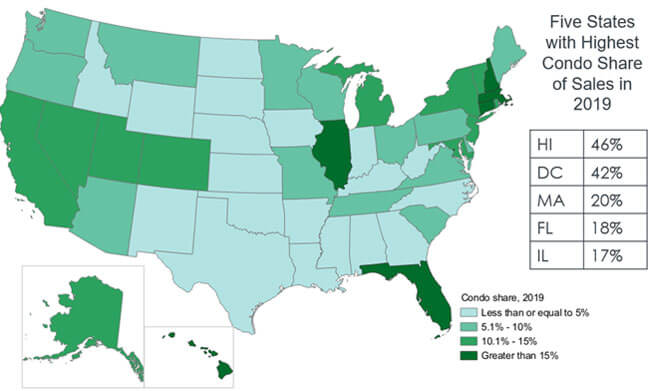
Geographically, in 2019, the condo share of sales activity by state was highest in Hawaii (46%), followed by Washington D.C. (42%), Massachusetts (20%), Florida (18%) and Illinois (17%) (Figure 1). At the metro level, condo sales activity also varied. In 2019, eight of the top 25 condo markets experienced increases in condo sales relative to the prior year (Figure 2).[2] However, in 2018, only 12 of those top 25 condo markets experienced increases in condo sales relative to the prior year.

Among the top 25 markets with the most condo sales, Austin, Texas, had the largest annual increase in condo sales in 2019, with a gain of 12%, followed by:

  • New York, N.Y. (6%)
  • Naples, Fla. (3%)
  • San Diego, Calif. (3%)
  • and Denver, Colo. (3%)

Miami, Fla. and Warren, Mich. experienced the largest annual drop in condo sales, with a decline of 11%, followed by:

  • Atlanta, Ga. (-9%)
  • Orlando, Fla. (-9%)
  • Honolulu, Hawaii (-9%)
  • and Las Vegas, Nev. (-9%)
Figure 3: Younger Millennials Are Adding To Condo Demand

Given worsening affordability challenges in many markets, condos could be a viable option for many. However, condo supply remains tight; according to CoreLogic MLS data, months’ supply for condos fell to four months in December 2019 – the lowest since 2006.[3]

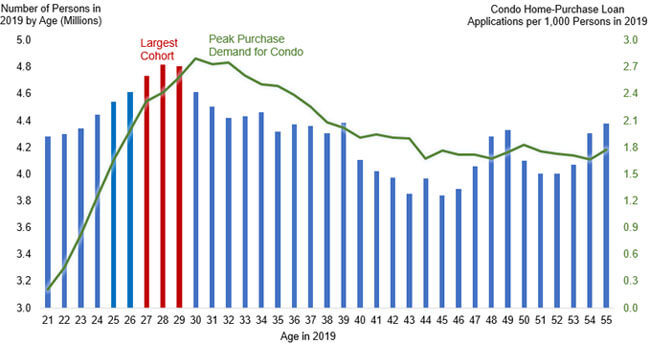
In the coming years, younger millennials (age 30 or below) are likely to drive much of the condo demand as they are a very large group (Figure 3). Still, there will be more condo demand than supply as young millennials approach peak household formation and homebuying age.

For more Insights from CoreLogic, check out our blog – delivering expanded perspective on the housing economy and property markets.

© 2020 CoreLogic, Inc. All rights reserved.

[1] Data Source: CoreLogic TrueStandings

[2] The 25 largest condo markets were defined at the Core Based Statistical Area (CBSA) level and determined based on total condominium sales between 2000 and 2019 according to CoreLogic.

[3] The months’ supply indicates how long it would take to sell all the current for-sale inventory (assuming no new supply hits the market) at the current sales rate.

  • Category: Blogs, Intelligence, Mortgage, Office of the Chief Economist, Real Estate
ABOUT THE AUTHOR
Archana Pradhan
Archana Pradhan
Principal, Economist, Office of the Chief Economist
View Profile

Related Posts

HPIAug2023Promo
Blogs

US Home Price Insights – October 2023

Annual U.S. home price growth regained steam again in August, with New England leading the charge.

October 3, 2023
family struggling with huge mortgage price tag and interest rate
Affordable Housing

US Rent Affordability Drops to Lowest Level in Decades

Renters now spend more than 40% of their incomes on the cost of housing.

October 2, 2023
2023-Mortage-Fraud-Report-Header
Blogs

Banking in 2023: Financial Crisis, Recession or Correction? 

Are we on the brink of another global financial crisis? The answer is complex, but uncertainty does not mean that a recession is brewing.  

September 29, 2023

About Corelogic

  • Newsroom
  • Leadership
  • Careers
  • Ethics & Compliance

Accounts

  • Products Sign-in

Contact

  • Sales Contact
  • Product Support

Regions

  • CoreLogic Australia
  • CoreLogic New Zealand
  • CoreLogic UK

Follow & Connect

  • Facebook
  • Instagram
  • Linkedin
  • Twitter
  • YouTube
© 2023 CoreLogic. All rights reserved.
  • Legal
  • Privacy Policy
  • CCPA
  • Cookie Preferences
  • Security
  • Sitemap
  • Accessibility
  • Legal
  • Privacy Policy
  • CCPA
  • Cookie Preferences
  • Security
  • Sitemap
  • Accessibility