Chat
Chat with Sales Hours: Monday-Friday 8:30 a.m. - 4:30 p.m. (CST)
Contact Sales
Call Sales Toll-Free 1-(866) 774-3282 Hours: Monday-Friday 7 a.m. - 5 p.m. (CST)
Product Login
Product Log-in
Product Support
Product Support
Email Sales
Contact Sales
After Hours
  • Support
  • Sign In Sign In
  • AUS NZ UK
CoreLogic - Home
  • Solutions
    view solutions by:

    Data Solutions

    • Lead Generation
    • Property Data
    • Location Intelligence

    Real Estate

    • Multiple Listing Enterprise
    • Agent & Broker

    Mortgage

    • Origination
    • Servicing
    • Appraisal
    • Commercial Property Tax

    Insurance

    • Hazard Risk
    • Catastrophe Risk Management
    • Risk Evaluation
    • Underwriting Automation
    • Weather
    • Claims Automation
    • Restoration
    • INTRCONNECT

    Mortgage Lenders

    • Origination

    Mortgage Servicers

    • Residential Property Tax
    • Default & Loss Mitigation
    • Portfolio Insight & Monitoring

    Mortgage Appraisers

    • Appraisal

    Real Estate Agents & Brokers

    • Agents & Brokers

    Real Estate MLS

    • Multiple Listing Enterprises

    Commercial Real Estate Owners

    • Commercial Property Tax

    Marketing Departments

    • Property Data

    Insurance Underwriters

    • Risk Evaluation
    • Underwriting Automation
    • Hazard Risk
    • Catastrophe Risk Management

    Insurance Risk Managers

    • Risk Evaluation
    • Hazard Risk
    • Catastrophe Risk Management

    Insurance Claims

    • Claims Automation
    • Restoration Contractors
    • Weather Verification

    Construction Contractors

    • Restoration Contractors

    General

    • Location Intelligence
    • Lead Generation
    • Data Solutions
  • Resources

    Reports

    • Climate Change
    • Construction Cost Update
    • Construction Insights
    • Home Price Insights
    • Homeowner Equity Insights
    • Loan Performance Insight
    • Mortgage Fraud
    • Property Tax Delinquency
    • Single-Family Rent Index

    Insight Blogs

    • Hazard HQ
    • Office of Chief Economist
    • Affordable Housing
    • Homebuying
    • Insurance
    • Other Articles

    More Resources

    • Events
    • Case Studies
    • White Papers
    • Podcasts
    • Quick Takes
  • Company
    • About
    • Leadership
    • Newsroom
    • Contact
    • Careers
  • Search
CoreLogic - Home
  • Solutions
  • Resources
  • Company

    • About
    • Leadership
    • Newsroom
    • Contact
    • Careers
  • Accounts

    • Products Sign-in
  • Contact

    • Sales Contact
    • Product Support
  • Regions

    • Australia
    • New Zealand
    • United Kingdom
  • Social

    • Facebook
    • Instagram
    • Linkedin
    • Twitter
    • Youtube
Solutions
VIEW BY:
  • Data Solutions

    • Lead Generation
    • Property Data
    • Location Intelligence
  • Real Estate

    • Multiple Listing Enterprise
    • Agent & Broker
  • Mortgage

    • Origination
    • Servicing
    • Appraisal
    • Commercial Property Tax
  • Insurance

    • Hazard Risk
    • Catastrophe Risk Management
    • Risk Evaluation
    • Underwriting Automation
    • Weather
    • Claims Automation
    • Restoration
    • INTRCONNECT
  • Mortgage Lenders

    • Origination
  • Mortgage Servicers

    • Residential Property Tax
    • Default & Loss Mitigation
    • Portfolio Insight & Monitoring
  • Mortgage Appraisers

    • Appraisal
  • Real Estate Agents & Brokers

    • Agents & Brokers
  • Real Estate MLS

    • Multiple Listing Enterprises
  • Commercial Real Estate Owners

    • Commercial Property Tax
  • Marketing Departments

    • Property Data
  • Insurance Underwriters

    • Risk Evaluation
    • Underwriting Automation
    • Hazard Risk
    • Catastrophe Risk Management
  • Insurance Risk Managers

    • Risk Evaluation
    • Hazard Risk
    • Catastrophe Risk Management
  • Insurance Claims

    • Claims Automation
    • Restoration Contractors
    • Weather Verification
  • Construction Contractors

    • Restoration Contractors
  • General

    • Location Intelligence
    • Lead Generation
    • Data Solutions
Resources
  • Reports

    • Climate Change
    • Construction Cost Update
    • Construction Insights
    • Home Price Insights
    • Homeowner Equity Insights
    • Loan Performance Insight
    • Mortgage Fraud
    • Property Tax Delinquency
    • Single-Family Rent Index
  • Insight Blogs

    • Hazard HQ
    • Office of Chief Economist
    • Affordable Housing
    • Homebuying
    • Insurance
    • Other Articles
  • More Resources

    • Events
    • Case Studies
    • White Papers
    • Podcasts
    • Quick Takes

Home / Intelligence / Private-Label RMBS Performance: Non-QM Focus

ABOUT THE AUTHOR
Patrick Kiser
Patrick Kiser
Principal, Mortgage Performance Solutions
View Profile
  • January 16, 2020

Private-Label RMBS Performance: Non-QM Focus


In early 2018, we reviewed how RMBS 2.0 issuance volumes in the Private-Label Residential Mortgage Backed Securities (PLRMBS) market had shifted towards the Non-Performing Loans (NPL) and Re-Performing Loans (RPL) along with emerging non-QM as early as 2015.  In less than two years since that first review, we’ve seen NPL and RPL issuance slow down while the non-QM volume has grown significantly.  Back then, there was a desire for a follow up review of the loan performance for each category.  Given the dynamics of how the market has changed and the strong interest in the growing non-QM segment, we’ll focus our update on a performance review of the non-QM book.  More specifically, for our analysis we’ve isolated non-QM identified loans within non-QM designated deals spanning from 2015 to present.  We’ll first review the active non-QM book then we’ll analyze the paidoff non-QM set for a comprehensive perspective.

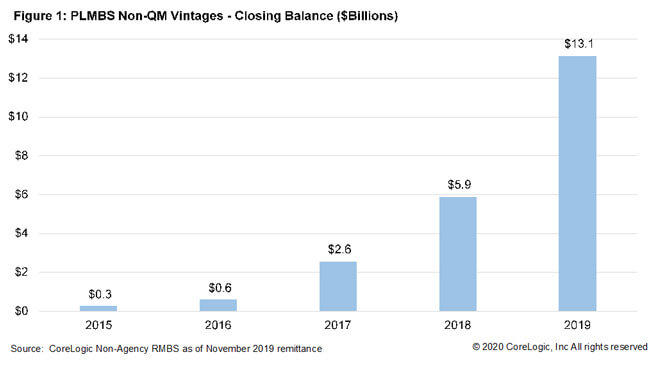
With a starting point of 2015, we see the non-QM volumes ramp up this year and last (Figure 1).

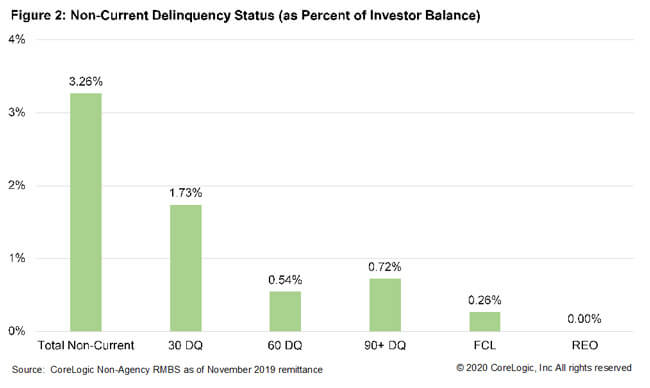
A performance review of the outstanding portfolio reveals that 96.7% of the unpaid principal balances in non-QM RMBS were in current status, or 3.3% were non-current (Figure 2).

In terms of the overall life of the active loans, almost 93% never experienced a delinquency and 5% were never worse than 30 days delinquent.

Turning to the collateral itself, not too surprisingly we see the Never Bad set of loans have stronger credit characteristics and lower initial and current interest rates.  Credit score is higher, and original loan-to-values (LTV) and back-end debt-to-income (DTI) ratios are lower for this cohort (Figure 3).

Figure 3: Worst Ever Performance Characteristics On Active Loans

Worst Ever PerformanceInitial RateCurrent Interest RateOrig CLTVCurrent CLTVOriginal Credit ScoreBack-End DTI
Never Bad6.176.0373.1768.5372037.04
Worst Ever 30 DQ6.806.7274.4569.6568637.58
Worst Ever 60 DQ7.157.1674.4469.1366738.24
Worst Ever 90 DQ7.217.1076.1170.9067138.39
Worst Ever FCL7.307.2275.12>67.4866138.35

Source:  CoreLogic Non-Agency RMBS as of November 2019 remittance

©2020 CoreLogic, Inc  All rights reserved

Not shown in the above collateral analysis but of importance is the owner occupancy.   Across all vintages for active non-QM loans, roughly 93% were owner occupied while almost 7% were second home and less than 1% was investor-owned.  Comparing loan performance, the owner occupied vs. second home and non-owner occupied/investor performing were at similar levels with a current status between 96% and 98%.  Only about 1% of the loans were in a serious delinquency status of 90 days-or-more or in foreclosure with 96% of these being owner occupied and almost 1% being non-owner occupied or investor.

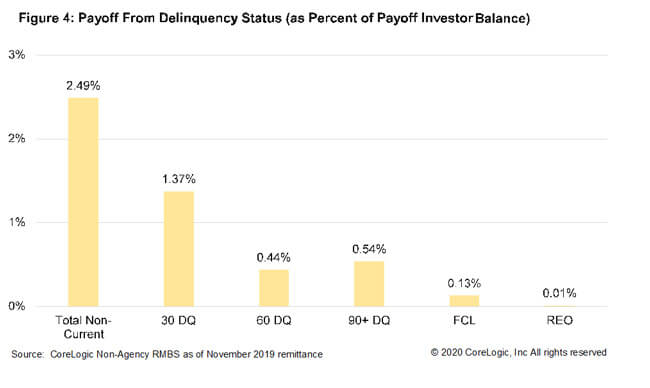
Delving into the pre-payment set of loans, we see a similar and consistent pattern to the active set where the performance was relatively strong.  Over 97% pre-paid from a current status (Figure 4).

Looking at the worst-ever status for those paid-off loans shows approximately 94% never went delinquent and nearly 99% never reached a status of 90 days late or worse.

As expected, the credit profile for the pre-paid is similar to that of the active set.  Not unlike what we saw in Figure 3, Figure 5 below shows the credit score to be a bigger driver for the performance along with the interest rate at the time of pre-paying.

Figure 5: Worst Ever Performance Characteristics On Paidoff Loans

Worst Ever PerformanceInitial RatePayoff Interest RateOriginal CLTVOriginal Credit ScoreBack-End DTI
Never Bad6.416.4673.4871338.52
Worst Ever 30 DQ6.956.9974.6168038.73
Worst Ever 60 DQ6.966.9675.4667140.07
Worst Ever 90 DQ7.227.0776.4366837.68
Worst Ever FCL7.487.5178.3965340.24

Source:  CoreLogic Non-Agency RMBS as of November 2019 remittance

©2020 CoreLogic, Inc  All rights reserved

A closer review by vintage from 2015 to present for the pre-paid set does seem to reveal a greater proportion of the loans are from earlier vintages.  Roughly 76% of the seriously delinquent pre-paid set came from 2015 to 2017 vintages. 

A quick note on the occupancy for the pre-paid shows the behavior in terms of the performance is rather consistent between owner occupied versus second home and non-owner/investor.  Overall, we see between 97% and 98% of the loans pre-paying from a current status whether they’re owner occupied or not.  However, roughly 95% of the pre-paying volumes were owner occupied homes.  Furthermore, for loans that pre-pay from a seriously delinquent state, CoreLogic data reveal about 99% of the volumes were owner occupied.

To date, the performance shows the segment has been doing relatively well overall across vintages.  Even at a deal level, there are only a handful of deals with any defaulting balances currently.  Nonetheless, should our economy experience a recession, keeping a close tab on loan performance will be increasingly important for investors.

Granted, the non-QM segment of the PLRMBS market is still relatively small and the sample to review is barely over $22 billion in closed deal balances starting from 2015 with the heaviest concentrations located in California (over 45%), Florida (over 13%), Texas (over 5%), and New York (almost 4%).  But the interest is quite high given the potential for the segment.  Going into 2020, home price and interest rate volatility is expected to remain stable and this should help drive the demand for non-QM even more.  Depending on what transpires with the QM Patch expiration slated for January 2021, a portion of the volumes could find a home through the private-label market.

Note:  The data compiled in the figured were taken from CoreLogic’s Non-Agency RMBS product with performance data through November 2019 remittance to bond holders.

©2020 CoreLogic, Inc  All rights reserved.

  • Category: Blogs, Homebuying, Intelligence
ABOUT THE AUTHOR
Patrick Kiser
Patrick Kiser
Principal, Mortgage Performance Solutions
View Profile

Related Posts

mississippi tornadoes
Blogs

March 24 EF-4 Tornado in Mississippi

CoreLogic estimates over 4,100 homes were within the path of the tornado that hit Mississippi on March 24, 2023.

March 29, 2023
California Atmospheric Rivers
Core Conversations

What Was it Really Like to Live Through the California Floods? Our Team Spills | Part 2

In Part 2, host Maiclaire Bolton Smith talks about the atmospheric rivers and the snow that has made headlines and headway in altering California’s natural hazard landscape.

March 29, 2023
CSI_Promo_Mar2023
Blogs

US CoreLogic S&P Case-Shiller Index Gain Slows to Pre-Pandemic Low, Up by 3.8% Year Over Year in January

The index continued to decline year over year in January, again posting a single-digit gain.

March 28, 2023

About Corelogic

  • Newsroom
  • Leadership
  • Careers
  • Ethics & Compliance

Accounts

  • Products Sign-in

Contact

  • Sales Contact
  • Product Support

Regions

  • CoreLogic Australia
  • CoreLogic New Zealand
  • CoreLogic UK

Follow & Connect

  • Facebook
  • Instagram
  • Linkedin
  • Twitter
  • YouTube
© 2023 CoreLogic. All rights reserved.
  • Legal
  • Privacy Policy
  • CCPA
  • Cookie Preferences
  • Security
  • Sitemap
  • Accessibility
  • Legal
  • Privacy Policy
  • CCPA
  • Cookie Preferences
  • Security
  • Sitemap
  • Accessibility