


360 Property Data
CoreLogic powers businesses with unrivaled property data, insights and technology.
Explore Our DataCoreLogic powers businesses with unrivaled property data, insights and technology.
Explore Our DataDifferentiate with insights and analysis from CoreLogic property data.
Know MoreProperty. People. Potential. CoreLogic unlocks value for the entire property ecosystem.
Learn More| United States | Canada | |||
| Quarter | Year | Quarter | Year | |
| Aluminum Conduit | 2.1% | 3.1% | 0.1% | 2.0% |
| Asphalt Shingles | 0.4% | 2.1% | 0.1% | 1.3% |
| Concrete Block | 0.2% | 2.2% | 0.8% | 2.5% |
| Drywall | 0.2% | 0.1% | 0.4% | 1.1% |
| Felt Paper | 0.1% | 0.7% | 0.4% | 3.4% |
| Galvanized Pipe | 0.0% | 1.6% | 1.5% | 6.0% |
| Lumber | 35.4% | 48.0% | 62.7% | 72.8% |
| Plywood | 27.1% | 32.5% | 30.8% | 28.9% |
| Ready Mix | 1.8% | 3.8% | 3.0% | 7.5% |
| Rebar | 0.4% | 1.2% | -0.2% | -1.5% |
| Steel Deck | 0.5% | 1.8% | 1.3% | 5.0% |
| Steel Stud | 0.7% | 2.1% | 0.8% | 3.8% |
| Structural Steel | 0.7% | -0.7% | 0.1% | 1.8% |
| 1/2″ Copper Pipe | 1.0% | 0.1% | 0.4% | 3.6% |
| Quarterly Variance | |
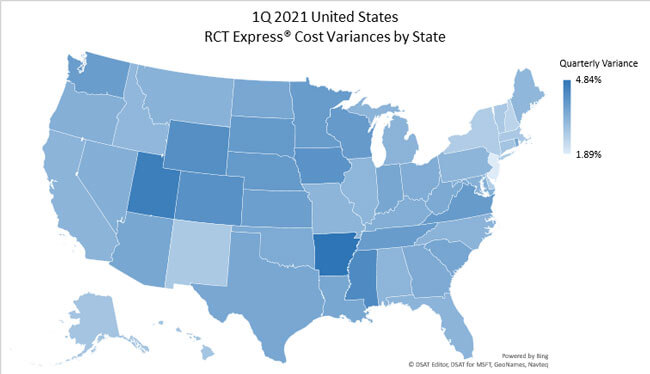
| United States | 3.46% |
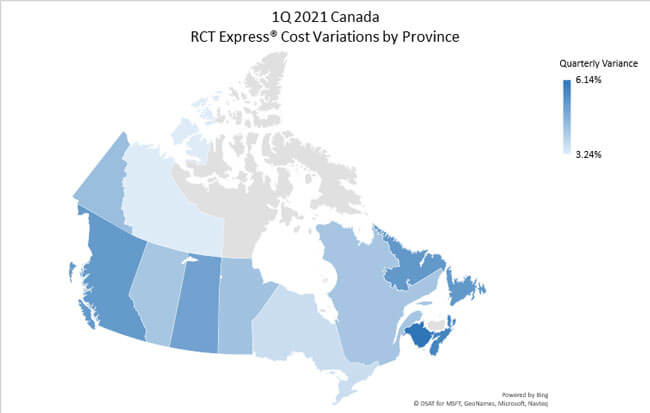
| Canada | 4.45% |
To ensure that our clients receive the most current building material and labor costs, the CoreLogic data team continuously researches hard costs such as labor, material and equipment, including mark-ups. Our research also covers soft costs such as taxes and fringes for reconstruction work performed for the insurance industry in the United States and Canada. We monitor demographics and econometric statistics, government indicators, and localization requirements, including market trends from nearly 3,000 unique economies in the United States, and over 100 in Canada.
Other factors in this process include the following:
In addition, we validate cost data by analyzing field inspection records, contractor estimates, phone surveys and partial and full loss claim information. For more information, or for further explanation, please contact your sales consultant or account manager.
NOTE: The cost information in this bulletin is only intended to give you a general sense of reconstruction cost trends in North America. You should NOT advocate using these factors when adjusting renewal values for specific locations or across your book of business. Please note that the building material and labor cost trends presented in this bulletin are broad averages derived from our research of construction trades and building materials.
| United States | 1Q19 | 2Q19 | 3Q19 | 4Q19 | 1Q20 | 2Q20 | 3Q20 | 4Q20 |
| 1/2″ Drywall | -0.2% | 0.0% | 0.4% | 0.4% | -0.6% | 0.0% | 0.5% | 0.2% |
| Asphalt Shingles | 2.4% | 0.7% | 1.0% | 0.4% | 0.7% | 0.5% | 0.5% | 0.4% |
| Romex Wire | -2.4% | -0.5% | -1.6% | -3.0% | -1.1% | -0.8% | 1.2% | 2.4% |
| 1/2″ Plywood | -6.9% | -5.0% | -4.5% | -3.0% | -1.9% | 1.4% | 4.7% | 27.1% |
| 2×4 Lumber | -8.2% | -5.7% | -2.8% | -1.0% | 1.2% | 3.3% | 4.6% | 35.4% |
| R-13 Fiber Batt Insulation | 0.5% | 1.6% | 0.8% | 1.7% | 1.7% | 2.6% | 1.8% | 1.7% |
| 1/2″ Copper Pipe | -0.5% | 0.5% | -1.0% | -1.2% | -0.1% | -0.7% | 0.0% | 1.0% |
| Ready Mix | 0.3% | 2.3% | 1.1% | 0.7% | 0.6% | 0.9% | 0.5% | 1.8% |
| Felt Paper | -0.1% | -0.7% | -0.1% | 0.4% | 0.1% | 0.2% | 0.3% | 0.1% |
| State | Quarterly Variance |
| Alabama | 3.24% |
| Alaska | 2.87% |
| Arizona | 3.60% |
| Arkansas | 4.84% |
| California | 3.27% |
| Colorado | 4.14% |
| Connecticut | 2.88% |
| Delaware | 2.62% |
| Florida | 3.27% |
| Georgia | 3.51% |
| Hawaii | 2.85% |
| Idaho | 3.19% |
| Illinois | 3.23% |
| Indiana | 3.60% |
| Iowa | 4.09% |
| Kansas | 3.79% |
| Kentucky | 3.41% |
| Louisiana | 3.60% |
| Maine | 3.20% |
| Maryland | 3.37% |
| Massachusetts | 2.76% |
| Michigan | 3.29% |
| Minnesota | 3.87% |
| Mississippi | 4.29% |
| Missouri | 3.25% |
| Montana | 3.32% |
| Nebraska | 3.92% |
| Nevada | 3.39% |
| New Hampshire | 2.47% |
| New Jersey | 1.89% |
| New Mexico | 2.75% |
| New York | 2.67% |
| North Carolina | 3.29% |
| North Dakota | 3.59% |
| Ohio | 3.46% |
| Oklahoma | 3.50% |
| Oregon | 3.38% |
| Pennsylvania | 3.25% |
| Rhode Island | 3.62% |
| South Carolina | 3.62% |
| South Dakota | 3.92% |
| Tennessee | 3.86% |
| Texas | 3.58% |
| Utah | 4.61% |
| Vermont | 2.76% |
| Virginia | 3.89% |
| Washington | 3.84% |
| West Virginia | 3.52% |
| Wisconsin | 3.91% |
| Wyoming | 4.19% |
| Canada | 1Q19 | 2Q19 | 3Q19 | 4Q19 | 1Q20 | 2Q20 | 3Q20 | 4Q20 |
| 1/2″ Drywall | 1.3% | 2.7% | 1.1% | 0.4% | 0.2% | 0.3% | 0.2% | 0.4% |
| Asphalt Shingles | 0.8% | 1.0% | 1.5% | 1.9% | 0.9% | 0.2% | 0.1% | 0.1% |
| Romex Wire | 0.7% | -0.2% | 0.6% | -0.6% | 0.0% | 0.4% | 0.6% | 0.5% |
| 1/2″ Plywood | -4.4% | -3.1% | -3.2% | -2.1% | -1.4% | -1.3% | 1.3% | 30.8% |
| 2×4 Lumber | -6.6% | -5.9% | -4.4% | -2.4% | 0.3% | 2.0% | 3.8% | 62.7% |
| R-13 Fiber Batt Insulation | 1.5% | 1.5% | 2.1% | 2.3% | 2.3% | 1.7% | 2.6% | 1.9% |
| 1/2″ Copper Pipe | 2.2% | 1.8% | 0.4% | 1.4% | 1.7% | 1.2% | 0.4% | 0.4% |
| Ready Mix | 0.7% | 2.5% | 1.0% | 0.8% | 0.7% | 2.1% | 1.5% | 3.0% |
| Felt Paper | 0.6% | 0.8% | 1.3% | 1.5% | 1.2% | 1.1% | 0.6% | 0.4% |
| Province | Quarterly Variance |
| Alberta | 4.16% |
| British Columbia | 5.24% |
| Manitoba | 4.25% |
| New Brunswick | 6.14% |
| Newfoundland | 5.27% |
| Northwest Territory | 3.24% |
| Nova Scotia | 5.74% |
| Ontario | 3.58% |
| Prince Edward Is. | 6.07% |
| Quebec | 4.17% |
| Saskatchewan | 5.04% |
| Yukon Territory | 4.34% |
Note: CoreLogic recommends a full program install whenever possible to ensure use of latest data and program enhancements.
The 1st quarter 2021 cost data update reflects reconstruction cost changes in both labor and material for all versions of RCT. Standardized costs in this release reflect localized, updated costs representing the impact of emerging markets and economic trends on construction costs.
Note: The changes below are for Sherwood Park, Alberta, Postal Codes T8B1Ax-T8B1Nx only.
NOTE: These new material selections are not available for Mobile/Manufactured Homes.
NOTE: No GUI changes were made for Mobile/Manufactured homes.
Included in cost: Solar roof tiles, equipment for a 5-kWh system, roof felt, flashing, conduit and wiring, and installation labor. Note that this system supports direct consumption of energy and no batteries for storage. If batteries are present, the user can find the appropriate selection in the “Roof Cover” drop down menu. Optional selections include, “Solar Roof Tile Battery, 13kWh”, “Solar Roof Tile Battery, 27kWh”, and “Solar Roof Tile Battery, 40kWh”.
Enter the percentage of the home with solar roof tile between 0 and 100.
Note: Although the description below is for the 5 kWh system, the language in the help files is the same for the 8 kWh and 10 kWh systems with the exception of the system output (i.e., 8 kWh and 10 kWh).
Included in cost: Battery, wiring to grid, and installation labor.
Enter the number of solar roof tile batteries between 0 and 10.
Note: Although the description above is for the 13 kWh battery, the language in the help files is the same for the 27 kWh and 40 kWh batteries with the exception of the battery capacity (i.e., 27 kWh and 40 kWh).