


CoreLogic estimates 358,000 homes may have sustained damage from the hail and/or tornadoes on March 31
A band of severe thunderstorms crossed the central U.S. on Friday, March 31. According to the National Oceanic and Atmospheric Administration (NOAA) Storm Prediction Center (SPC) Filtered Storm Report for March 31, the severe thunderstorm system was responsible for more than 500 reports of tornadoes, large hail and high winds from Texas to Ohio. The severe thunderstorms were responsible for extensive property damage across the impacted states, most notably tornado damage in Little Rock, Arkansas.
The devastation across the U.S. Midwest and South comes a week after a deadly EF-4 tornado caused widespread destruction in Mississippi.
CoreLogic Identifies Approximately 358,000 Homes Worth an Estimated $83.2B Potentially Within Tornado Paths and Hail Boundaries
CoreLogic’s Weather Verification Services (WVS) and Reactor™ Platform captured tornado paths and hail swaths across the U.S. on March 31. More than 358,000 single- (SFR) and multifamily (MFR) homes may have sustained damage due to the combined effects of tornadoes and hail.
March 31 Tornadoes
CoreLogic® estimates that approximately 75,000 SFR and MFR properties with a combined reconstruction value (RCV) of $22.0 billion were potentially within the tornado paths across the country. Table 1.1 and 1.2 provide the number and total reconstruction value of residential properties by both state and probability of tornadic damage.
|
Probability of Damage |
||||||
| State | >10% | >30% | >50% | >70% | >90% | Total |
| AL | 73 | 82 | 67 | 53 | – | 275 |
| AR | 6,640 | 5,162 | 4,850 | 985 | 9 | 17,646 |
| GA | 5,034 | 1,565 | 369 | 15 | – | 6,983 |
| IA | 4,629 | 1,919 | 1,875 | 1,155 | 4 | 9,582 |
| IL | 8,482 | 1,760 | 265 | 102 | 3 | 10,612 |
| IN | 6,506 | 3,488 | 2,078 | 39 | – | 12,111 |
| KY | 1,556 | 95 | 1 | – | – | 1,652 |
| MS | 5,737 | 1,011 | 614 | 93 | – | 7,455 |
| TN | 6,354 | 1,268 | 620 | 387 | 105 | 8,734 |
| Grand Total | 45,011 | 16,350 | 10,739 | 2,829 | 121 | 75,050 |
Table 1.1: Residential Property Count
Number of SFR and MFR Properties Within the Tornado Footprints by State and Probability of Tornado Damage
|
Probability of Damage |
||||||
| State | > 10% | > 30% | > 50% | > 70% | > 90% | Total |
| AL | 20 | 18 | 17 | 11 | 0 | 67 |
| AR | 1,817 | 1,412 | 1,262 | 212 | 3 | 4,706 |
| GA | 2,373 | 790 | 127 | 5 | 0 | 3,294 |
| IA | 1,413 | 568 | 591 | 294 | 1 | 2,868 |
| IL | 2,628 | 430 | 80 | 35 | 1 | 3,174 |
| IN | 1,840 | 1,107 | 616 | 13 | 0 | 3,576 |
| KY | 457 | 25 | 0 | 0 | 0 | 482 |
| MS | 1,277 | 264 | 152 | 19 | 0 | 1,712 |
| TN | 1,526 | 307 | 164 | 98 | 19 | 2,114 |
| Grand Total | 13,351 | 4,921 | 3,008 | 688 | 24 | 21,993 |
Table 1.2: Residential Property Total Reconstruction Value ($USD Millions)
Total Reconstruction Value of SFR and MFR Properties Within the Tornado Footprints by State and Probability of Tornado Damage
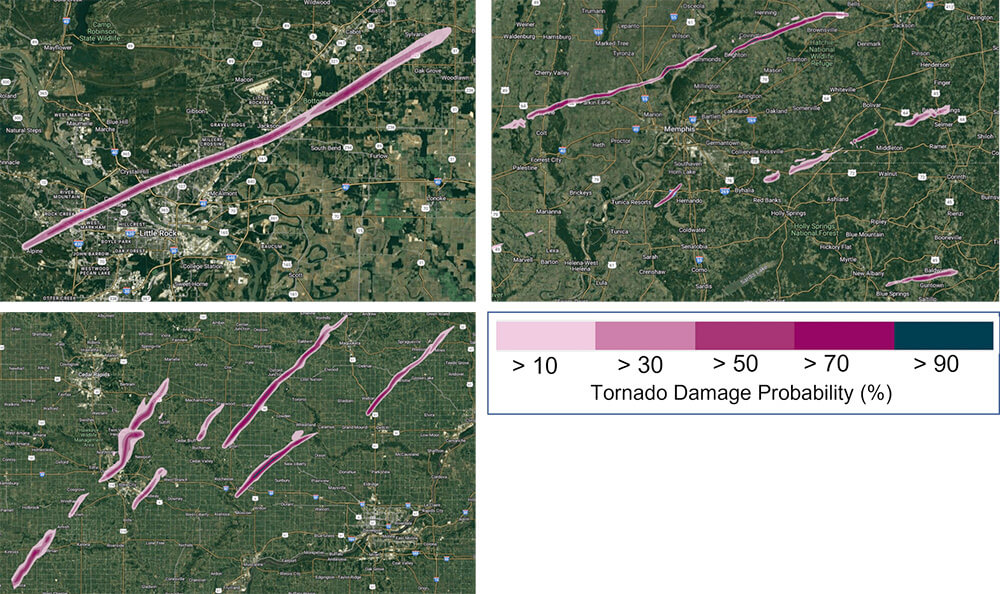
It is important to clarify that probability values do not indicate the severity of the damage. Instead, they reflect the likelihood that a property was within the tornado’s path. Figure 1 provides a map, as visualized in CoreLogic’s Reactor Platform, of the tornado paths accompanied by the probability of damage.
Storms Lead to Potential Widespread Hail Damage
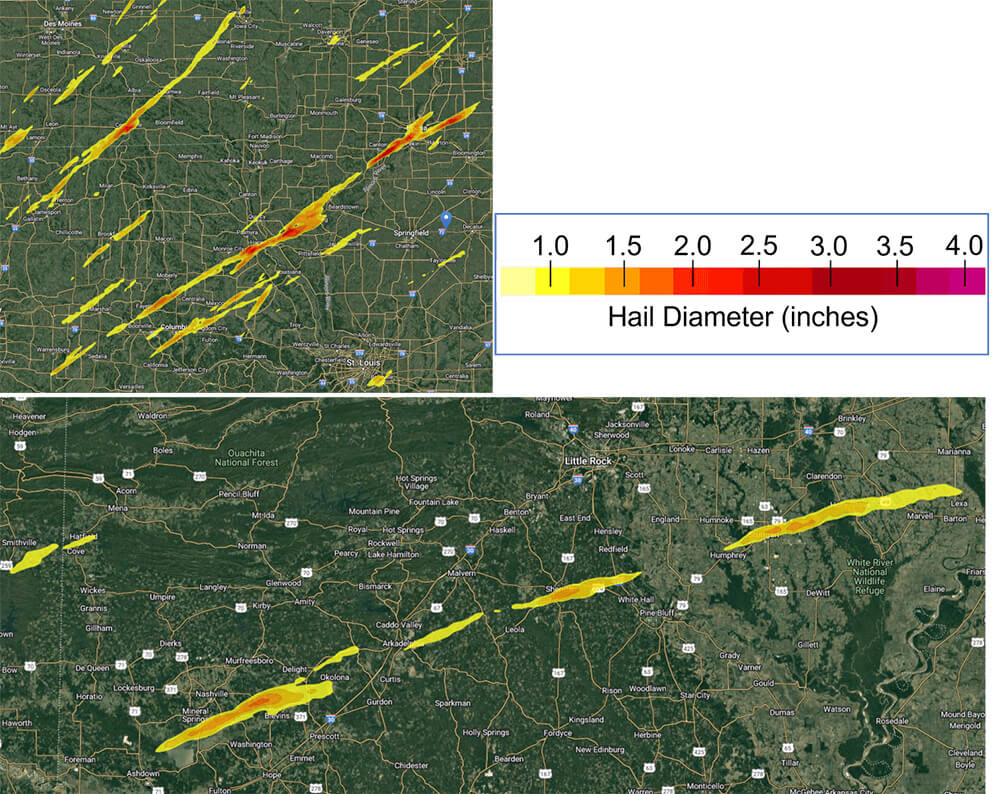
CoreLogic estimates that approximately 280,000 SRFs and MRFs with a combined reconstruction value (RCV) of $61.2 billion were potentially impacted by hailstones with diameters greater than 1 inch. Table 2 provides the number and total reconstruction value of residential properties by state and hailstone diameter. Figure 2.1 and 2.2 provide a map of the hail swath boundaries and intensity (i.e. hailstone diameter), as visualized in CoreLogic’s Reactor Platform.
| Hail Stone Diameter | ||||||||
| State | 1″ | 1.25″ | 1.5″ | 1.75″ | 2″ | 2.25″ | 2.5″ | Total |
| IL | 61,627 | 29,283 | 28,776 | 11,284 | 4,080 | 1,709 | 51 | 136,810 |
| MO | 20,058 | 17,254 | 7,811 | 3,374 | 2,302 | 924 | 40 | 51,763 |
| IA | 25,043 | 6,797 | 2,993 | 371 | 497 | 1,599 | 872 | 38,172 |
| IN | 22,486 | 3,476 | 1,479 | – | – | – | – | 27,441 |
| AR | 2,432 | 4,746 | 1,283 | 63 | – | – | – | 8,524 |
| MI | 5,030 | 1,283 | 119 | – | – | – | – | 6,432 |
| OH | 5,512 | 331 | – | – | – | – | – | 5,843 |
| TN | 3,806 | 777 | – | – | – | – | – | 4,583 |
| TX | 654 | 364 | 368 | 42 | – | – | – | 1,428 |
| GA | 1,039 | 44 | – | – | – | – | – | 1,083 |
| KY | 539 | 123 | 13 | – | – | – | – | 675 |
| WI | 127 | – | – | – | – | – | – | 127 |
| LA | 37 | 25 | – | – | – | – | – | 62 |
| OK | 30 | – | – | – | – | – | – | 30 |
| Grand Total | 148,420 | 64,503 | 42,842 | 15,134 | 6,879 | 4,232 | 963 | 282,973 |
Table 2.2: Residential Property Count
Number of SFR and MFR Properties Within the Hail Swath Footprints by State and Hailstone Diameter
| Hail Stone Diameter | ||||||||
| State | 1″ | 1.25″ | 1.5″ | 1.75″ | 2″ | 2.25″ | 2.5″ | Total |
| IL | 10,077 | 3,959 | 6,410 | 3,385 | 1,223 | 564 | 17 | 25,634 |
| MO | 5,537 | 4,794 | 2,555 | 807 | 681 | 262 | 11 | 14,648 |
| IA | 4,426 | 466 | 155 | 73 | 113 | 404 | 224 | 5,861 |
| IN | 7,991 | 1,067 | 403 | 0 | 0 | 0 | 0 | 9,461 |
| AR | 343 | 389 | 177 | 13 | 0 | 0 | 0 | 922 |
| MI | 1,010 | 47 | 0 | 0 | 0 | 0 | 0 | 1,058 |
| OH | 1,612 | 131 | 0 | 0 | 0 | 0 | 0 | 1,743 |
| TN | 927 | 215 | 0 | 0 | 0 | 0 | 0 | 1,142 |
| TX | 132 | 62 | 61 | 7 | 0 | 0 | 0 | 263 |
| GA | 258 | 8 | 0 | 0 | 0 | 0 | 0 | 266 |
| KY | 158 | 35 | 4 | 0 | 0 | 0 | 0 | 197 |
| WI | 36 | 0 | 0 | 0 | 0 | 0 | 0 | 36 |
| LA | 7 | 5 | 0 | 0 | 0 | 0 | 0 | 12 |
| OK | 5 | 0 | 0 | 0 | 0 | 0 | 0 | 5 |
| Grand Total | 32,519 | 11,179 | 9,766 | 4,286 | 2,017 | 1,229 | 252 | 61,247 |
Table 2.2: Residential Property Total Reconstruction Value ($USD Millions)
Total Reconstruction Value of SFR and MFR Properties Within the Hail Swath Footprints by State and Hailstone Diameter
Please note that not all properties within the tornado footprints or hail swaths sustained damage and the degree of the damage to structures may vary. A damaged structure may not have incurred a total loss equal to the full RCV. The number of damaged properties will be a subset of the total homes within tornado paths and hail swaths.
Clients with a CoreLogic Weather Verification Services subscription can download the hail swath or straight-line wind speed maps from the March 31 severe weather outbreak.
Why Were the Storms and Tornadoes of 2023 So Severe?
The strong storm system that developed on March 31 pulled unseasonably warm and moist conditions from the Gulf of Mexico across the central U.S. The combination of moisture and a favorable wind profile created a volatile environment in which tornadoes could easily develop.
Two separate supercell systems spawned tornadoes Arkansas (Figure 1, Top Left). According to the National Weather Service (NWS), the first storm was an EF-3 tornado that extended nearly 32 miles east from West Little Rock, Arkansas, in Pulaski County to Cabot, Arkansas, in Lonoke County. The NWS estimated 165 mph peak wind speeds near Little Rock. Further east, a separate supercell spawned another tornado of at least EF-3 strength that destroyed additional homes in Wynn, Arkansas, and uprooted trees near Parkin and Earl, Arkansas.
In Iowa, several tornadoes caused damage to properties across the state (Figure 1, Bottom Left). According to the NWS, the tornado intensities ranged from EF-0 to EF-4. Estimated wind speeds ranged from 74 to 170 mph.
Visualize Hazard Footprints and Manage Your Portfolio With Reactor
CoreLogic Reactor is an interactive, geospatial mapping solution that provides forecasting, as well as real-time and forensic weather data to users all from a single platform. Users can visualize storm warnings, watches and alerts, as well as impacts in the aftermath of activity. Such data includes tropical storm and hurricane wind speeds at the parcel level.
Tornado paths and hail swaths are powered by CoreLogic Weather Verification Services (WVS). CoreLogic WVS combines the best aspects of point observations — providing a high degree of accuracy — and radar technology (high-resolution patterns) using its proprietary algorithms to generate wind speed maps with neighborhood-level detail (500-meter resolution). These digital tools offer 100% coverage of the continental U.S.
To learn more about severe convective storm risk in the U.S., download the CoreLogic 2023 Severe Convective Storm Report.
Please email [email protected] with questions regarding the March 31 severe weather outbreak, Weather Verification Services, the Reactor Platform or any CoreLogic Event Response notifications.
Visit www.hazardhq.com for updates and information on catastrophes across the globe.


