


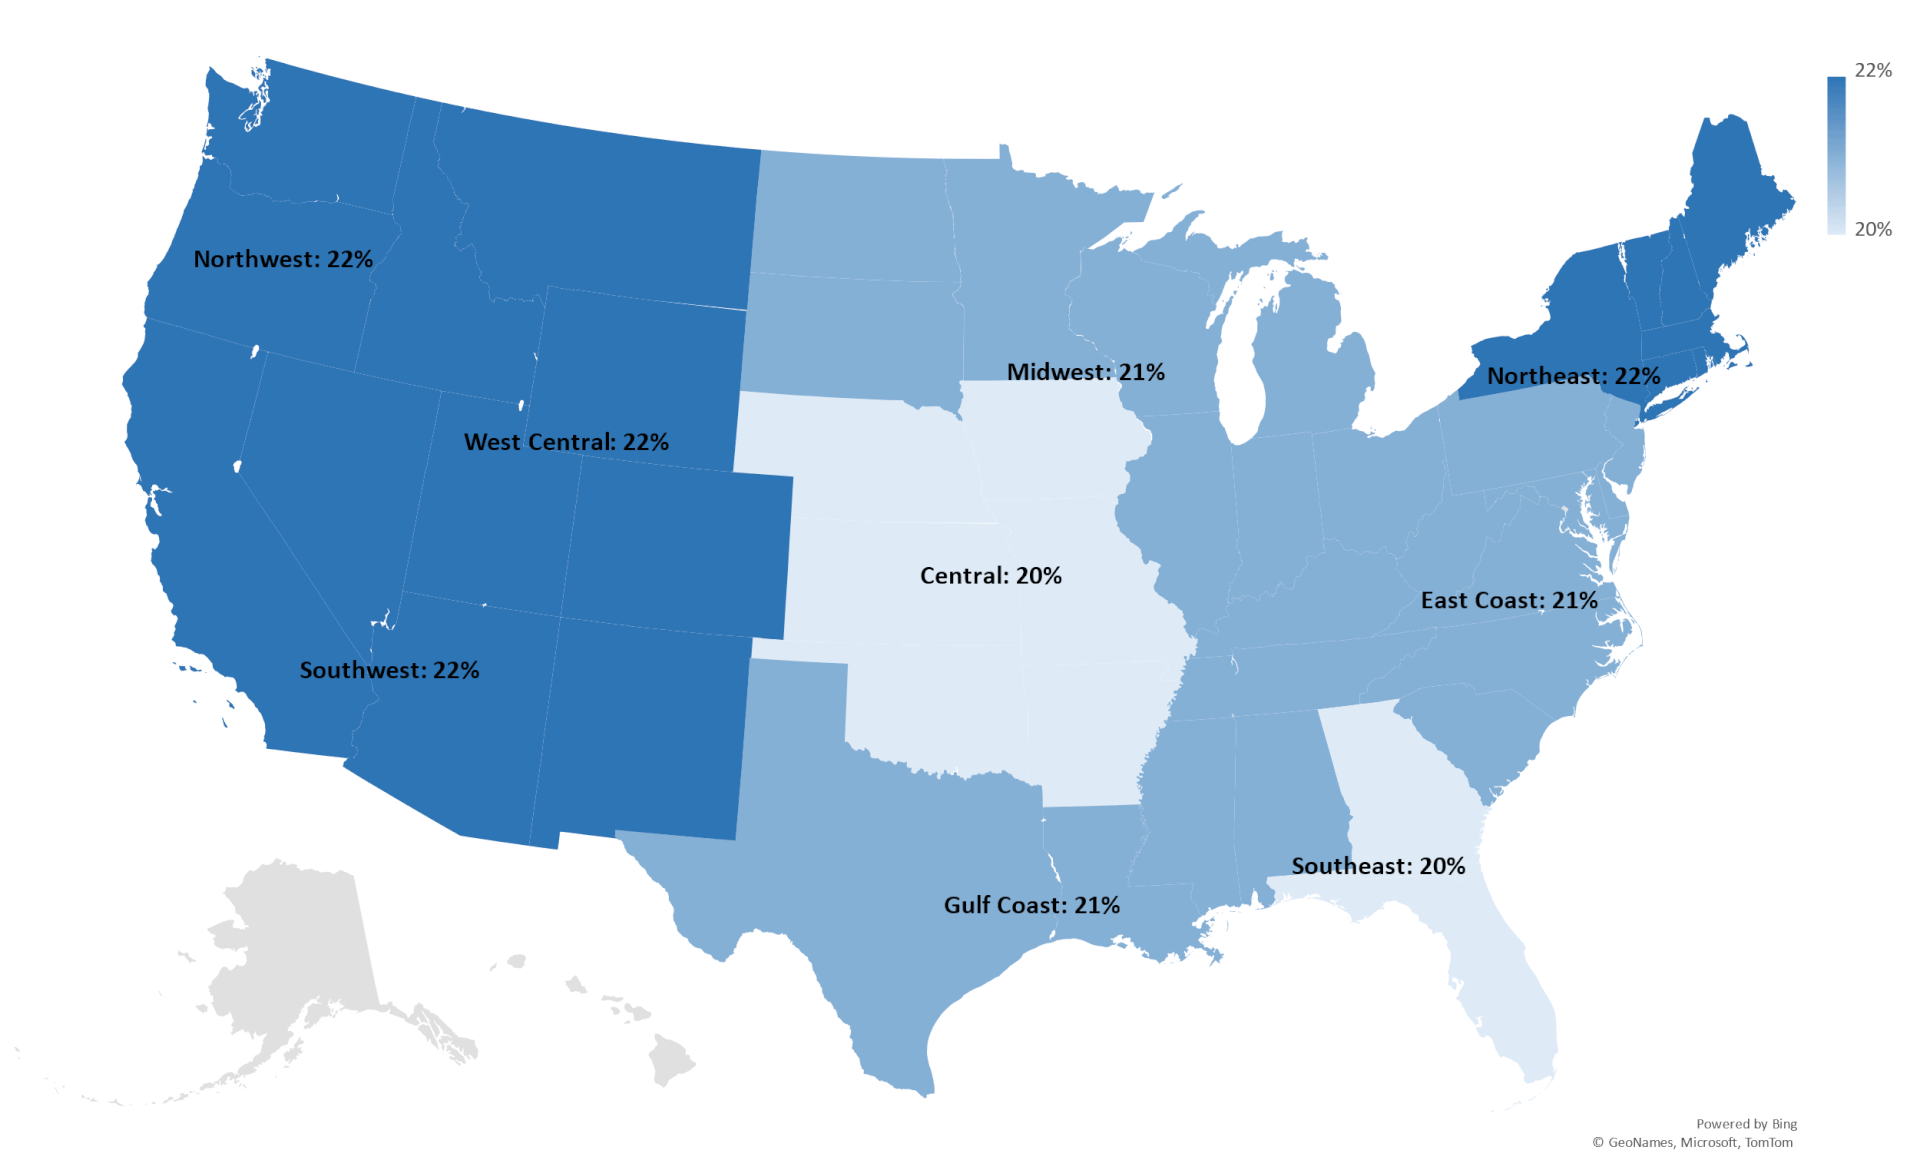
Defined Regions
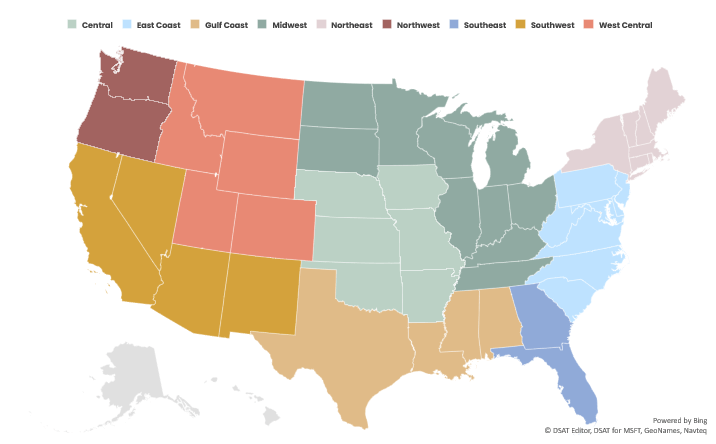
To keep our clients informed of current market trends, CoreLogic® has curated a monthly bulletin of regional construction cost insights that are reflected in the CoreLogic Claims Pricing Database. CoreLogic’s experts combine current month pricing data with four common loss scenarios creating a model to illustrate the impact.
These data models are then applied across the nine regions noted above and compared to both the prior month and the year to date. Expert analysis is provided to supplement these data trends and provide additional insight into key drivers.
February Pricing Insights
CoreLogic’s pricing team has been working overtime since the turn of the new year, their activities focused on wholistically improving the engine of CoreLogic’s estimating systems. Market surveys and client feedback have collided with traditional pricing processes and what is shaping up is exciting. The team is energized with the feedback being received from our Pricing Database Feedback loop. If you haven’t checked it out, you should.
Overview
Analysis of February’s pricing data shows Labor and Material continue to take divergent paths. Material costs continue to recede from 2022’s inflation, while labor costs have been much more reactive and remain on the rise. Combined, the two offset and most line-item components that include a traditional mix of labor and materials are holding somewhat steady as we pass the mid-point of Q1.
Material
Overall, material components declined approximately 1.5% from January but remain up 15.5% from where they were a year ago in February 2022. Materials associated with the mechanical trades saw some of the largest increases in 2022 and thus far in 2023, show higher levels of resiliency, declining less than half of a percent compared to the prior month. Other materials such as cabinetry and raw lumber continue their recovery trend and are at or near Q1 2022 values.
Labor
In February, a few notable changes drove increased labor costs among the basket of goods. These changes were initiated through deep dive analysis completed by the pricing team as well as client feedback derived from our Pricing Database Feedback loop. Textile cleaning and Electronics restoration labor rates increased in every region and across almost all categories. The deep dive into Roofing is still underway and changes are expected to continue through the end of Q1. With February’s release, all markets see an increase in the Roofing labor rate with the overall average near 3%.
Property Claim Scenarios
To demonstrate how changes in pricing impact typical loss costs, CoreLogic has replicated the estimating components found in the following most common loss scenarios. The sum of these materials is referred to as “The Basket of Goods”.
Fire/Lightning (Large Loss)
Large loss claims are modeled from a typical fire loss where all components of a home’s construction are affected. These losses typically exceed $100k.
Wind/Hail (Exterior/Roof)
Losses represented within this group are typical of event activity consisting of wind and/or hail damage requiring roof replacement, partial siding replacement and accompanying accessories.
Water (Interior Multi-Room Losses)
Moderately complex losses are modeled using the bathroom as the origin of loss. A combination of replacement and repair of common household finishes are included.
Water Mitigation (Drying)
Typical drying costs for a residential structure including water extraction, removal of wet material and use of drying equipment is included.
Fire/Lightning (Large Loss) Insights: 12 Month Trend
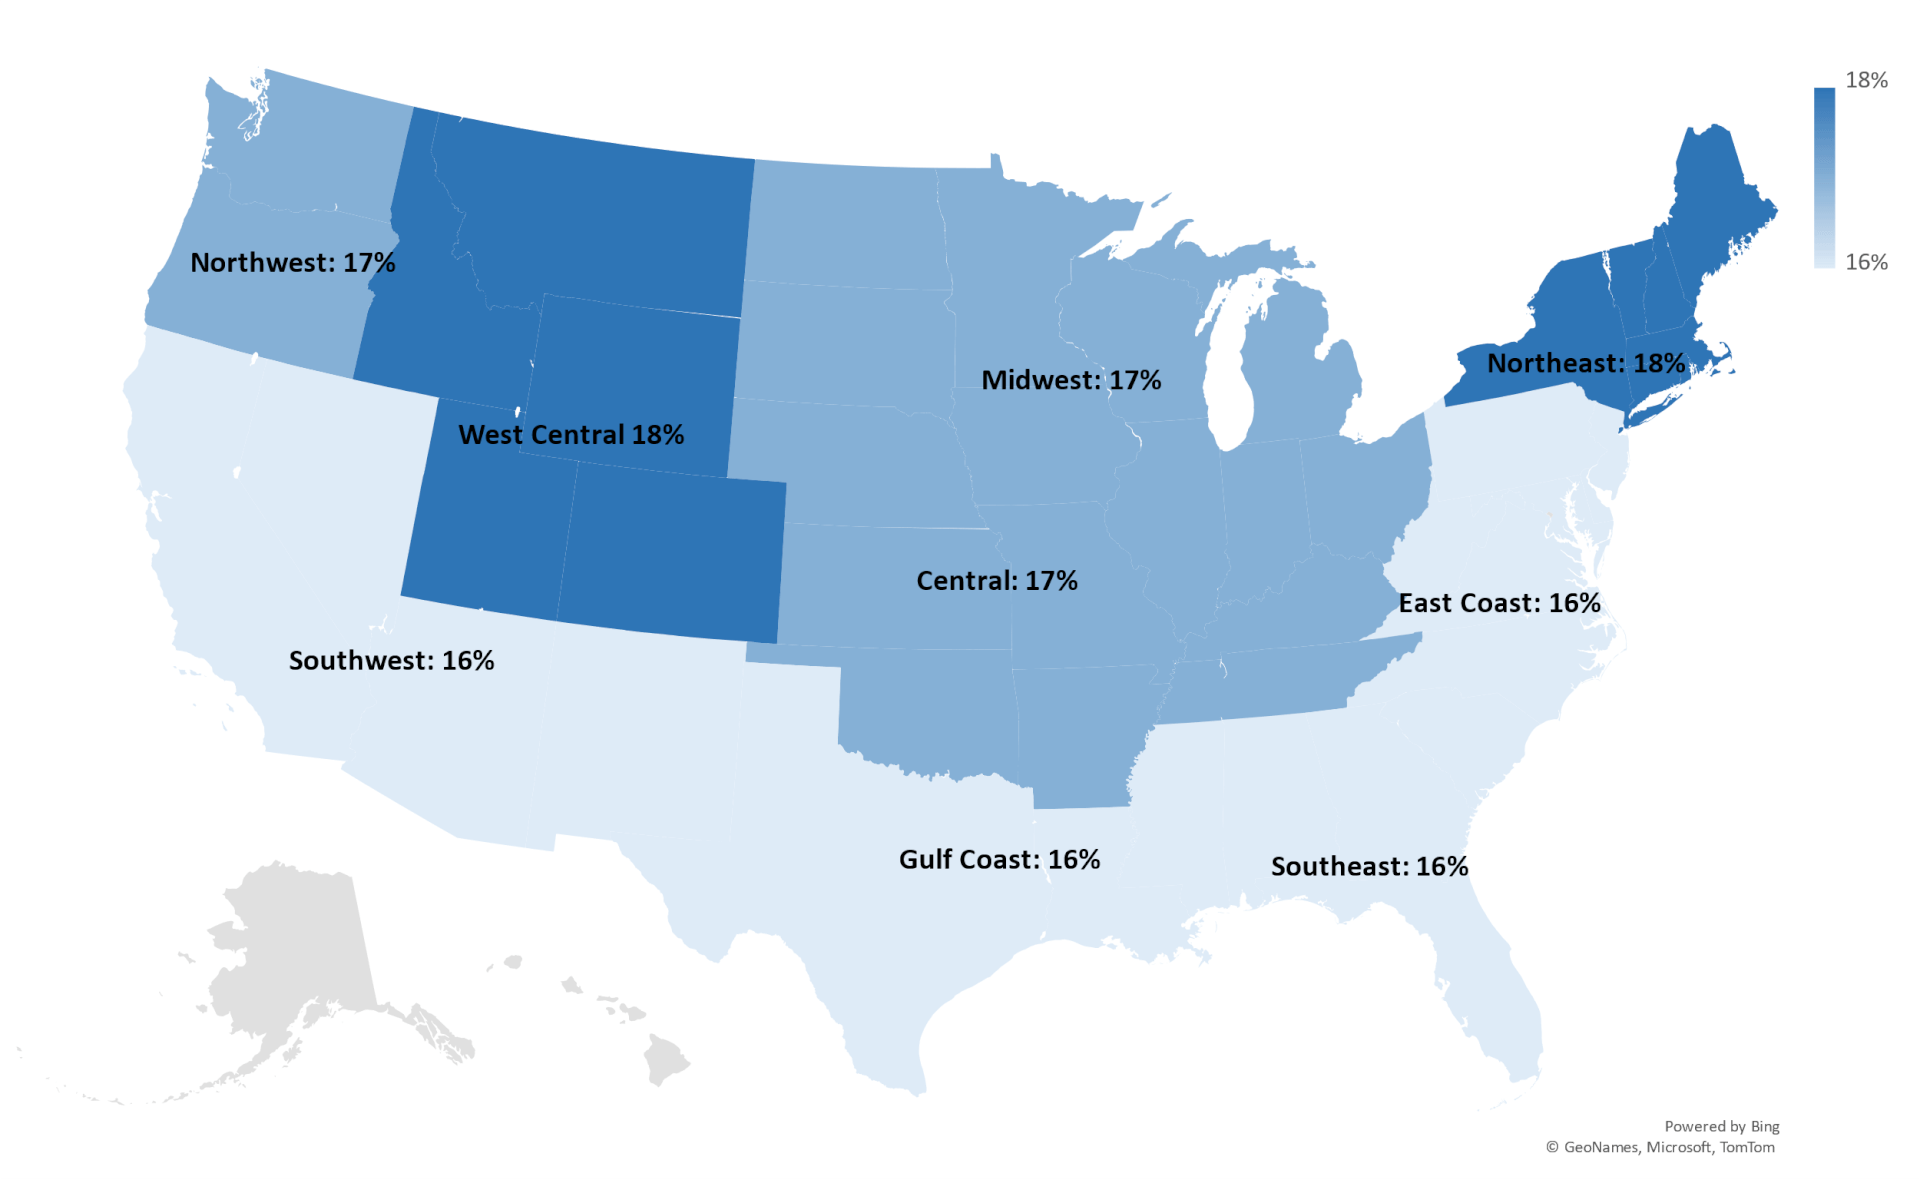
- With a ½ % decrease compared to prior month, the Large Loss scenario saw the largest decline of all estimating scenarios with the February release, however as compared to February of 2022, the scenario remains almost 17% elevated overall.
- The largest single driver continues to be the deflation of raw lumber components that are required to fully restore a typical fire damaged home.
- Working as a counterbalance to the decline of some components is the insulation category which is up 1% month over month and 22% compared to prior year, and the mechanical trades which remain elevated nearly 40% in the 12-month analysis.
Wind/Hail (Exterior/Roof) Insights: 12 Month Trend
- The Wind and Hail scenario saw the only month / month increase at +1% and continues to increase from February 2022, up 15% overall.
- These increases are fueled by materials and labor
- Roofing materials remain up 15.2% from the prior year and flat to prior month.
- Roofing labor costs have continued to rise month over month and are expected to continue through Q1. Cumulatively roofing labor is up 27% on average compared to prior year.
- Natural wood related siding and fencing products are trending like raw lumber, declining in February, and continuing the path to prior year values.
Water (Interior Reconstruction) Insights: 12 Month Trend
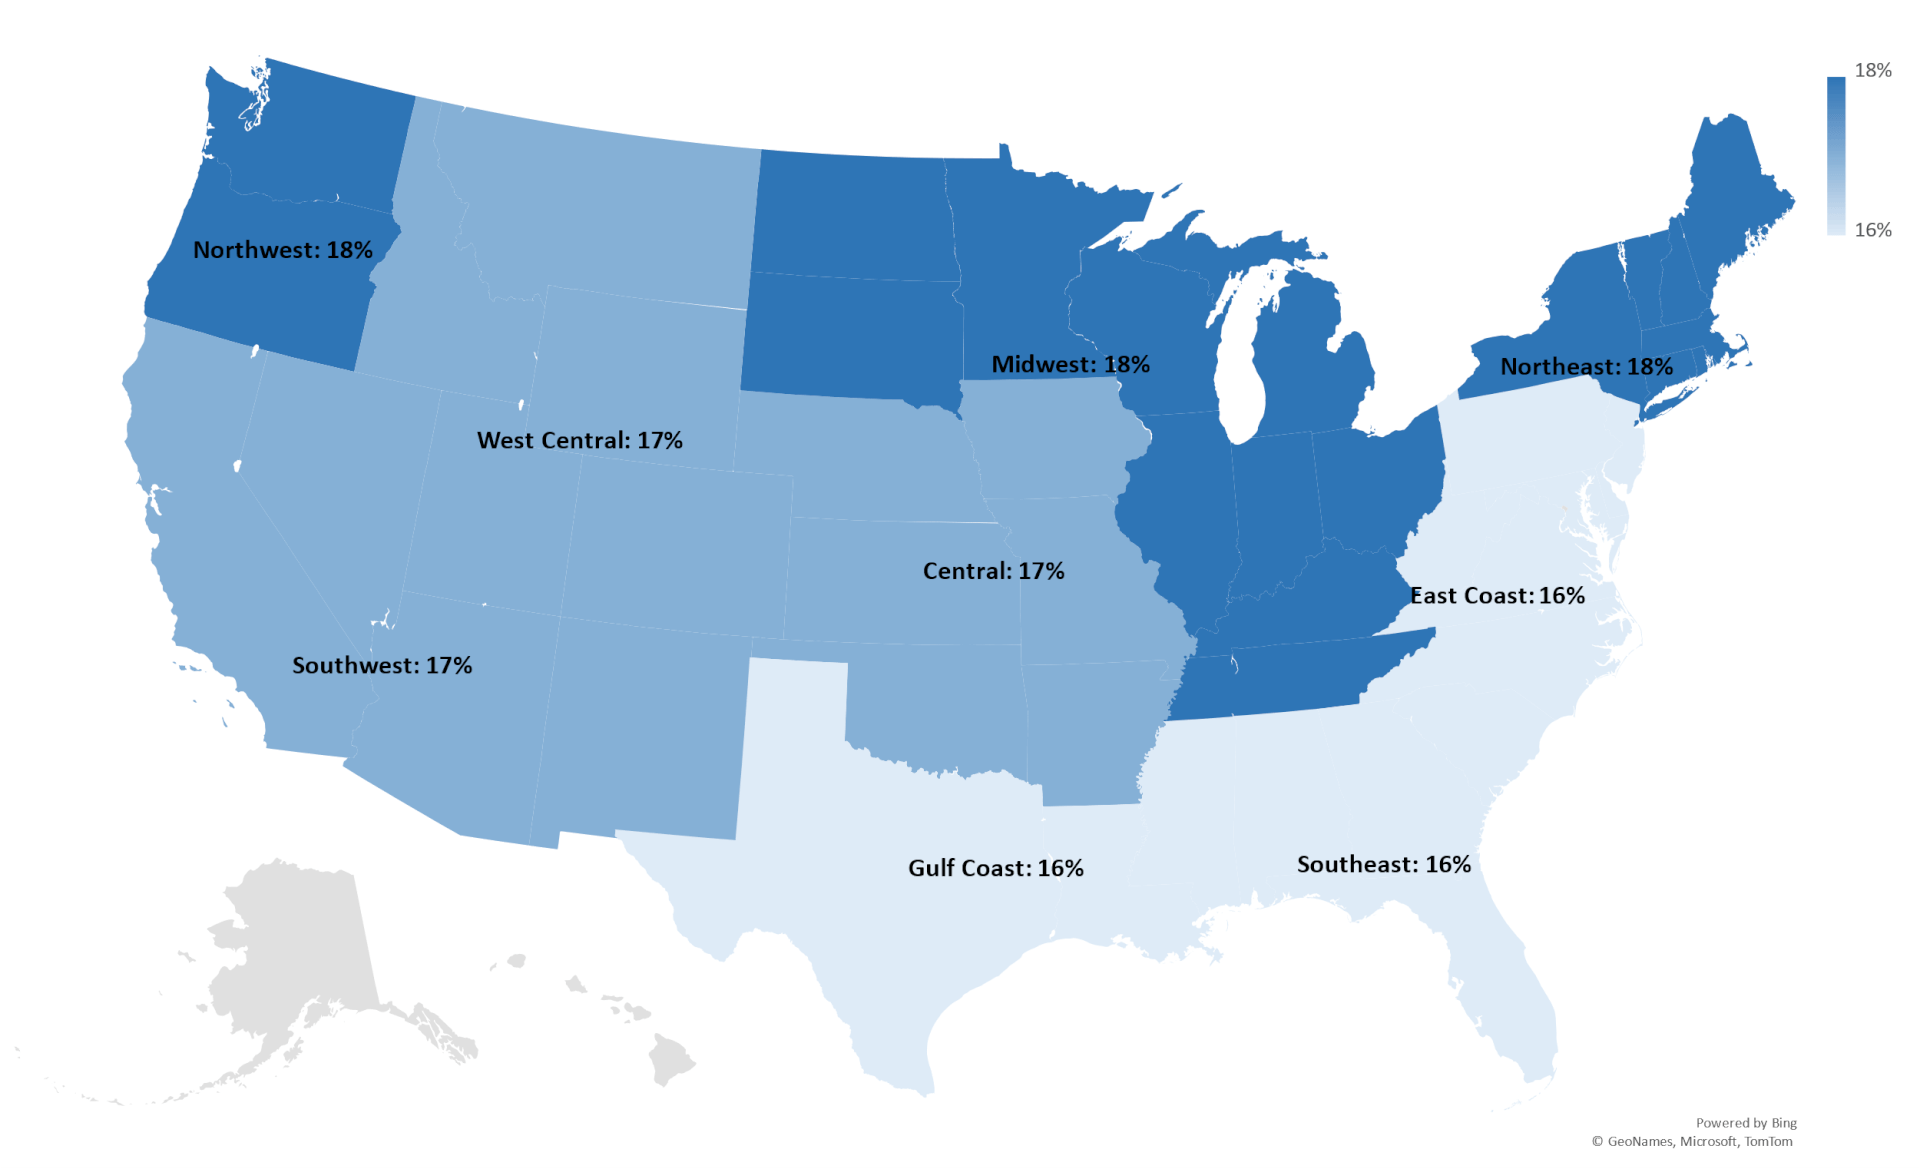
- On average, up 17% over prior year and flat to prior month, the water scenario is experiencing some interesting opposing pressures.
- Materials associated with drywall and painting continue to increase and month over month both are up nearly 2% on average. Looking at their development over the last 12 months, they have climbed to 19% with the February release.
- Opposing these increases are month over month decreases in materials associated with floor coverings, finish trim work and most notably cabinetry which is down 11% compared to January.
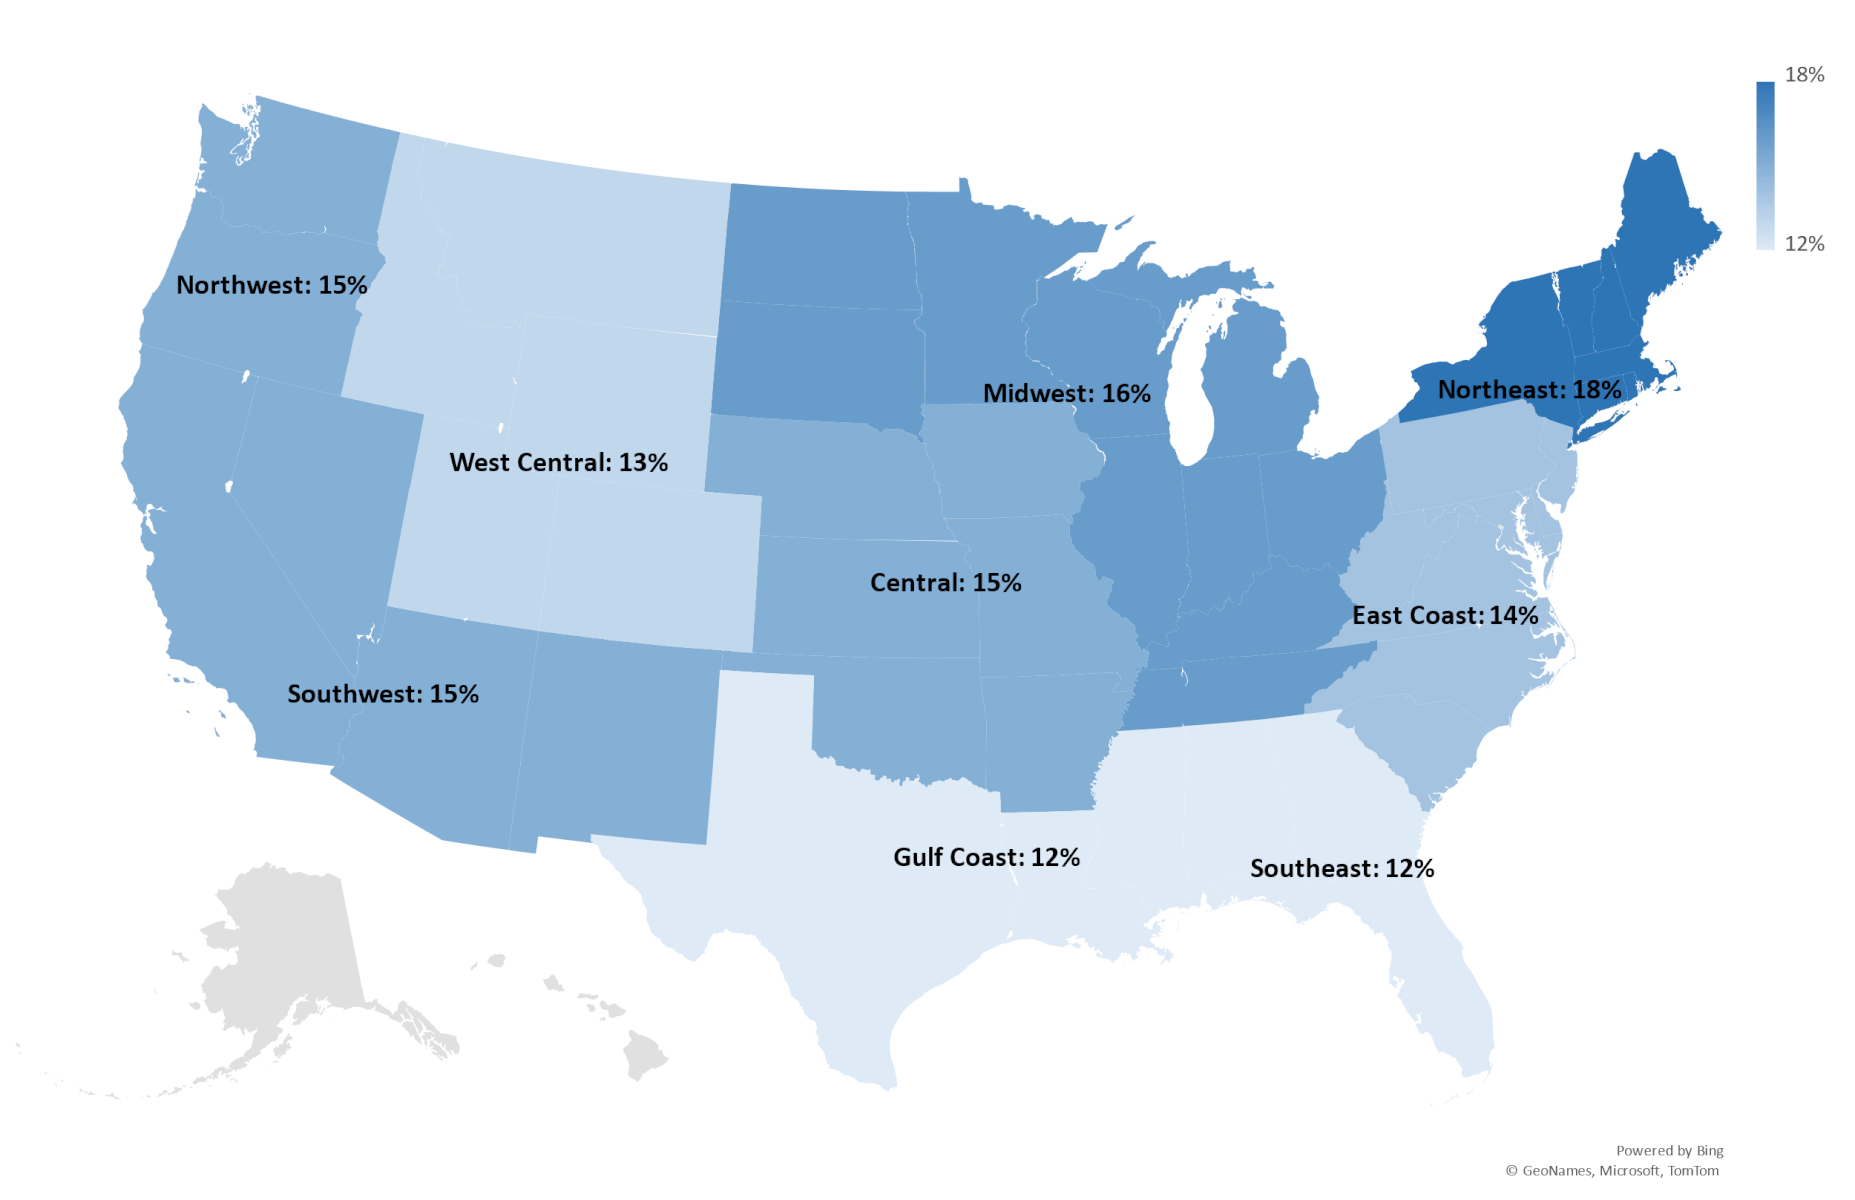
Water Mitigation (Drying) Insights: 12 Month Trend
- Water remediation technician labor rates were re-baselined in 2022. Comparing today’s labor rates to where they were 1 year ago, there has been a 32% increase on average overall. This remains the largest driver of the water mitigation scenario.
- Only minor fluctuations have been seen in materials associated with drying and remediation efforts and this remains a small component of this scenario.
- Equipment rates on the other hand are a substantial factor and are currently being investigated by CoreLogic’s pricing team to ensure our pricing database reflects the pace of change seen in recent months in the market.
About CoreLogic Data Research
CoreLogic develops this report using up-to-date materials and labor costs. CoreLogic’s team of analysts continuously researches hard costs such as labor, material, and equipment, including mark-ups, and updates its database every month. Our research also covers soft costs such as taxes and fringe benefits for reconstruction work performed in the United States for the insurance industry. CoreLogic monitors demographics and econometric statistics, government indicators, and localization requirements, including market trends from thousands of unique economies throughout the United States.
Other factors in this process include the following:
- Wage rates for more than 85 union and non-union trades
- Over 100,000 construction data points
- Productivity rates and crew sizes
- Building code requirements and localized cost variables
In addition, we validate cost data by analyzing field inspection records, contractor estimates, phone surveys, and partial and complete loss claim information. Please complete the online form to provide feedback or request information on any items in our construction database. For further explanation or questions, please contact your sales executive or account manager.
About CoreLogic
CoreLogic is the leading property insights and technology solutions provider enabling healthy housing markets and thriving communities. Through its enhanced property data solutions, services, and technologies, CoreLogic enables real estate professionals, financial institutions, insurance carriers, government agencies, and other housing market participants to help millions of people find, buy, and restore their homes. For more information, please visit www.corelogic.com.
NOTE: The building material, labor, and other cost information in this bulletin is generated using research, sources and methods current as of the date of this bulletin and is intended only to provide an estimated average of reconstruction cost trends in the specified general geographic regions of the United States. This cost information may vary further when adjusting claim values for specific property locations or specific business conditions.


