Chat
Chat with Sales Hours: Monday-Friday 8:30 a.m. - 4:30 p.m. (CST)
Contact Sales
Call Sales Toll-Free 1-(866) 774-3282 Hours: Monday-Friday 7 a.m. - 5 p.m. (CST)
Product Login
Product Log-in
Product Support
Product Support
Email Sales
Contact Sales
After Hours
  • Support
  • Sign In Sign In
  • AUS NZ UK
CoreLogic - Home
  • Solutions
    view solutions by:

    Data Solutions

    • Lead Generation
    • Property Data
    • Location Intelligence

    Real Estate

    • Multiple Listing Enterprise
    • Agent & Broker

    Mortgage

    • Point of Sale
    • Origination
    • Servicing
    • Appraisal
    • Commercial Property Tax

    Insurance

    • Hazard Risk
    • Catastrophe Risk Management
    • Risk Evaluation
    • Underwriting Automation
    • Weather
    • Claims Automation
    • Restoration
    • INTRCONNECT

    Mortgage Lenders

    • Point of Sale
    • Origination

    Mortgage Servicers

    • Residential Property Tax
    • Default & Loss Mitigation
    • Portfolio Insight & Monitoring

    Mortgage Appraisers

    • Appraisal

    Real Estate Agents & Brokers

    • Agents & Brokers

    Real Estate MLS

    • Multiple Listing Enterprises

    Commercial Real Estate Owners

    • Commercial Property Tax

    Marketing Departments

    • Property Data

    Insurance Underwriters

    • Risk Evaluation
    • Underwriting Automation
    • Hazard Risk
    • Catastrophe Risk Management

    Insurance Risk Managers

    • Risk Evaluation
    • Hazard Risk
    • Catastrophe Risk Management

    Insurance Claims

    • Claims Automation
    • Restoration Contractors
    • Weather Verification

    Construction Contractors

    • Restoration Contractors

    General

    • Location Intelligence
    • Lead Generation
    • Data Solutions
  • Resources

    Reports

    • Climate Change
    • Construction Claims Bulletin
    • Construction Cost Update
    • Construction Insights
    • Home Price Insights
    • Homeowner Equity Insights
    • Loan Performance Insight
    • Mortgage Fraud
    • Property Tax Delinquency
    • Single-Family Rent Index

    Insight Blogs

    • Hazard HQ
    • Office of Chief Economist
    • Affordable Housing
    • Homebuying
    • Insurance
    • Other Articles

    More Resources

    • Events
    • Case Studies
    • White Papers
    • Podcasts
    • Quick Takes
  • Company
    • About
    • Leadership
    • Newsroom
    • Contact
    • Careers
  • Search
CoreLogic - Home
  • Solutions
  • Resources
  • Company

    • About
    • Leadership
    • Newsroom
    • Contact
    • Careers
  • Accounts

    • Products Sign-in
  • Contact

    • Sales Contact
    • Product Support
  • Regions

    • Australia
    • New Zealand
    • United Kingdom
  • Social

    • Facebook
    • Instagram
    • Linkedin
    • Twitter
    • Youtube
Solutions
VIEW BY:
  • Data Solutions

    • Lead Generation
    • Property Data
    • Location Intelligence
  • Real Estate

    • Multiple Listing Enterprise
    • Agent & Broker
  • Mortgage

    • Point of Sale
    • Origination
    • Servicing
    • Appraisal
    • Commercial Property Tax
  • Insurance

    • Hazard Risk
    • Catastrophe Risk Management
    • Risk Evaluation
    • Underwriting Automation
    • Weather
    • Claims Automation
    • Restoration
    • INTRCONNECT
  • Mortgage Lenders

    • Point of Sale
    • Origination
  • Mortgage Servicers

    • Residential Property Tax
    • Default & Loss Mitigation
    • Portfolio Insight & Monitoring
  • Mortgage Appraisers

    • Appraisal
  • Real Estate Agents & Brokers

    • Agents & Brokers
  • Real Estate MLS

    • Multiple Listing Enterprises
  • Commercial Real Estate Owners

    • Commercial Property Tax
  • Marketing Departments

    • Property Data
  • Insurance Underwriters

    • Risk Evaluation
    • Underwriting Automation
    • Hazard Risk
    • Catastrophe Risk Management
  • Insurance Risk Managers

    • Risk Evaluation
    • Hazard Risk
    • Catastrophe Risk Management
  • Insurance Claims

    • Claims Automation
    • Restoration Contractors
    • Weather Verification
  • Construction Contractors

    • Restoration Contractors
  • General

    • Location Intelligence
    • Lead Generation
    • Data Solutions
Resources
  • Reports

    • Climate Change
    • Construction Claims Bulletin
    • Construction Cost Update
    • Construction Insights
    • Home Price Insights
    • Homeowner Equity Insights
    • Loan Performance Insight
    • Mortgage Fraud
    • Property Tax Delinquency
    • Single-Family Rent Index
  • Insight Blogs

    • Hazard HQ
    • Office of Chief Economist
    • Affordable Housing
    • Homebuying
    • Insurance
    • Other Articles
  • More Resources

    • Events
    • Case Studies
    • White Papers
    • Podcasts
    • Quick Takes

Home / Intelligence / Expiration of the CFPB’s Qualified Mortgage “GSE Patch” – Part 2

ABOUT THE AUTHOR
Archana Pradhan
Archana Pradhan
Principal, Economist, Office of the Chief Economist
View Profile
  • July 19, 2019

Expiration of the CFPB’s Qualified Mortgage “GSE Patch” – Part 2

Younger millennials and retirees, Non-W-2 earners, and low-income borrowers more frequent in the “GSE Patch”


This blog is a continuation of Part I of our blog series – Expiration of the CFPB’s Qualified Mortgage “GSE Patch”. As discussed in our first blog, roughly 16% or $260B of 2018 mortgage loan origination volume was QM-eligible due to the GSE Patch.[1] Roughly 75.5% of that volume we estimate to be QM Safe Harbor loans, with a Debt-to-Income (DTI) ratio over 43%, covering borrowers of all employment types (W-2 and non-W-2 wage earners). About 3.6% were the same, except they were QM Rebuttable Presumption loans.

The focus of this blog is to empirically demonstrate the various profiles of borrowers that the data tells us is most prevalent in this above 43% DTI group. This blog reviews borrowers age, income, employment type and home sales price in the high DTI group. Additional attributes will be covered in Part 3 of this series.

Above 43% DTI Temporal Trend

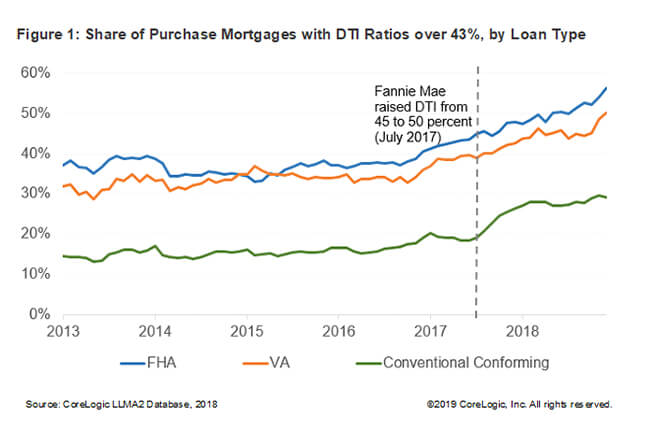
CoreLogic loan servicing data were used to track the percentage of borrowers with loans that were in the above 43% segment of the GSE patch. About 32% of all purchase loans originated in 2018 had DTI ratios greater than 43%, an increase of 12 percentage points from 20% in 2014. The share of loans with DTI ratio above 43% has increased for all conventional, FHA and VA products (Figure 1). The share of conventional purchase mortgages with DTI ratios greater than 43% has risen steadily since early 2014, and started to rise sharply after Fannie Mae raised its maximum DTI ratio level from 45% to 50% in July 2017 (an increase of 13 percentage points to 28% in 2018).

Impact on Borrowers Population – By Age, Employment Type, Income, and Home Sales Price

CoreLogic loan application data were used to analyze the impact of the GSE Patch on borrower population.[2] Loan application data illustrates that the current GSE Patch disproportionately benefits younger millennials and retirees, Non-W-2 borrowers, low-income borrowers, and borrowers purchasing low-to-mid priced homes. Thus, these groups are disproportionately represented within the GSE Patch and will switch to Non-QM, absent additional policymaking by the CFPB.

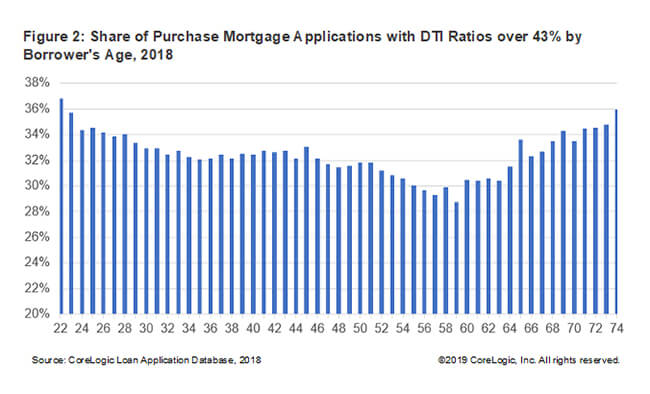
Data reveal that the younger millennials and retirees are likely to be impacted by the removal of GSE Patch (Figure 2). Borrowers aged below 33 (younger millennials) and aged 65 or above (mostly retires) had the highest share of purchase mortgage applications with DTI ratio over 43% in 2018. Younger millennials tend to be first-time buyers, often have student or other debt, and are early in their working careers (hence, have lower earnings than more experienced workers). On average, earnings typically peak for workers aged in their 50s, helping to lower DTI.[3] The borrowers aged above 65 mostly consists of retirees with low current income; this fact elevates their DTI ratios even though they may not be carrying substantial amounts of debt.

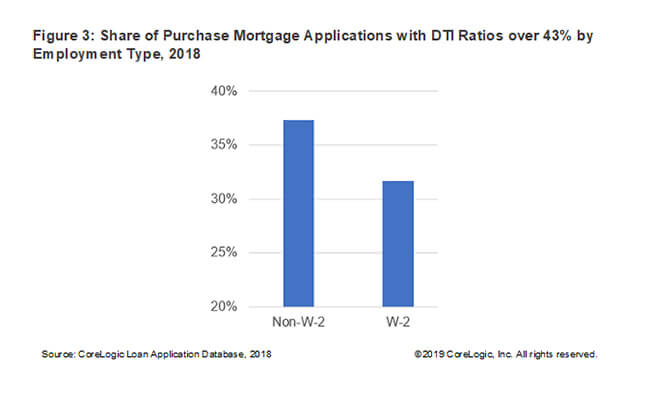
The impact is also likely to be pronounced for Non-W-2 wage earners. Non-W-2 borrowers represent self-employed, retired, seasonal, and part-time/gig-economy employment. Non-W-2 wage earners had a higher share of above 43% DTI loans than W-2 wage earners (Figure 3). About 37% of these borrowers had purchase mortgage applications with DTI ratio over 43% in 2018 compared to just 32% for W-2 borrowers.

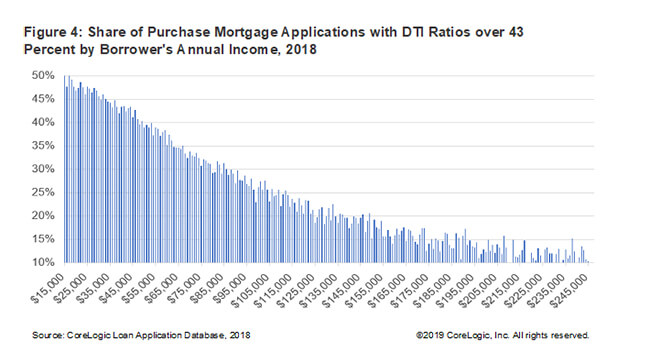
Similarly, borrowers at the lower end of income levels are most likely to be impacted by the removal of GSE Patch. They accounted the highest share of purchase mortgage applications with DTI ratio over 43% in 2018. Figure 4 illustrates that as income increases the share of applications with DTI over 43% declines.

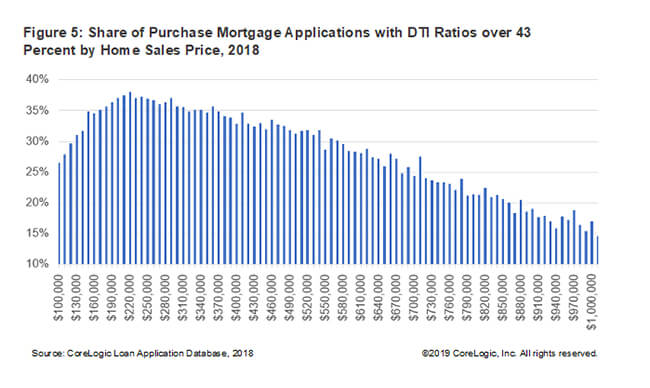
Likewise, the impact is likely to be evident for borrowers purchasing low-to-mid priced homes (Figure 5). Borrowers purchasing low-to-mid priced homes accounted for the highest share of above 43% DTI loans in 2018.

In the next blog (Part 3) we will discuss the GSE Patch impact by loan applicant’s race/ethnicity, income category, and property location neighborhood income level and minority population.

[1] See analysis assumption and caveats, including range of estimates in Part 1.

[2] All 2018 home-purchase mortgage applications, whether approved or not, were included in the analysis. We analyzed and compared 2017 applications and originations trend for all the charts in this blog and they looked very similar.

[3] Mincer, Jacob (1974) Schooling, Experience and Earnings, New York: National Bureau of Economic Research.

 © 2019 CoreLogic, Inc. All rights reserved.

  • Category: Blogs, Homebuying, Intelligence
  • Tags: GSE Patch, Mortgage, Qualified Mortgages
ABOUT THE AUTHOR
Archana Pradhan
Archana Pradhan
Principal, Economist, Office of the Chief Economist
View Profile

Related Posts

Wildfire Banner - Hazard HQ
Blogs

Wildfires in Canada Spreading, New Fires in Additional Provinces

Canada wildfires continue to burn across Alberta and new fires ignite in Nova Scotia, damaging homes near Halifax.

June 2, 2023
National flood insurance program coverage requirements
Blogs

Top Three Myths About Mandatory Purchase of Flood Insurance Coverage in Special Flood Hazard Areas Debunked

Just because national flood insurance program coverage is not required on a home, doesn’t mean a house should be uninsured.

June 2, 2023
Eye of the storm
Blogs

2023 Hurricane Risk Report

The 2023 Hurricane Risk Report provides insight into property risk, both nationally and by metro area, across single-family homes and multifamily homes from hurricane-driven wind and storm surge.

May 31, 2023

About Corelogic

  • Newsroom
  • Leadership
  • Careers
  • Ethics & Compliance

Accounts

  • Products Sign-in

Contact

  • Sales Contact
  • Product Support

Regions

  • CoreLogic Australia
  • CoreLogic New Zealand
  • CoreLogic UK

Follow & Connect

  • Facebook
  • Instagram
  • Linkedin
  • Twitter
  • YouTube
© 2023 CoreLogic. All rights reserved.
  • Legal
  • Privacy Policy
  • CCPA
  • Cookie Preferences
  • Security
  • Sitemap
  • Accessibility
  • Legal
  • Privacy Policy
  • CCPA
  • Cookie Preferences
  • Security
  • Sitemap
  • Accessibility