Chat
Chat with Sales Hours: Monday-Friday 8:30 a.m. - 4:30 p.m. (CST)
Contact Sales
Call Sales Toll-Free 1-(866) 774-3282 Hours: Monday-Friday 7 a.m. - 5 p.m. (CST)
Product Login
Product Log-in
Product Support
Product Support
Email Sales
Contact Sales
After Hours
  • Support
  • Sign In Sign In
  • AUS NZ UK
CoreLogic - Home
  • Solutions
    view solutions by:

    Data Solutions

    • Lead Generation
    • Property Data
    • Location Intelligence

    Real Estate

    • Multiple Listing Enterprise
    • Agent & Broker

    Mortgage

    • Origination
    • Servicing
    • Appraisal
    • Commercial Property Tax

    Insurance

    • Hazard Risk
    • Catastrophe Risk Management
    • Risk Evaluation
    • Underwriting Automation
    • Weather
    • Claims Automation
    • Restoration
    • INTRCONNECT

    Mortgage Lenders

    • Origination

    Mortgage Servicers

    • Residential Property Tax
    • Default & Loss Mitigation
    • Portfolio Insight & Monitoring

    Mortgage Appraisers

    • Appraisal

    Real Estate Agents & Brokers

    • Agents & Brokers

    Real Estate MLS

    • Multiple Listing Enterprises

    Commercial Real Estate Owners

    • Commercial Property Tax

    Marketing Departments

    • Property Data

    Insurance Underwriters

    • Risk Evaluation
    • Underwriting Automation
    • Hazard Risk
    • Catastrophe Risk Management

    Insurance Risk Managers

    • Risk Evaluation
    • Hazard Risk
    • Catastrophe Risk Management

    Insurance Claims

    • Claims Automation
    • Restoration Contractors
    • Weather Verification

    Construction Contractors

    • Restoration Contractors

    General

    • Location Intelligence
    • Lead Generation
    • Data Solutions
  • Resources

    Reports

    • Climate Change
    • Construction Cost Update
    • Construction Insights
    • Home Price Insights
    • Homeowner Equity Insights
    • Loan Performance Insight
    • Mortgage Fraud
    • Property Tax Delinquency
    • Single-Family Rent Index

    Insight Blogs

    • Hazard HQ
    • Office of Chief Economist
    • Affordable Housing
    • Homebuying
    • Insurance
    • Other Articles

    More Resources

    • Events
    • Case Studies
    • White Papers
    • Podcasts
    • Quick Takes
  • Company
    • About
    • Leadership
    • Newsroom
    • Contact
    • Careers
  • Search
CoreLogic - Home
  • Solutions
  • Resources
  • Company

    • About
    • Leadership
    • Newsroom
    • Contact
    • Careers
  • Accounts

    • Products Sign-in
  • Contact

    • Sales Contact
    • Product Support
  • Regions

    • Australia
    • New Zealand
    • United Kingdom
  • Social

    • Facebook
    • Instagram
    • Linkedin
    • Twitter
    • Youtube
Solutions
VIEW BY:
  • Data Solutions

    • Lead Generation
    • Property Data
    • Location Intelligence
  • Real Estate

    • Multiple Listing Enterprise
    • Agent & Broker
  • Mortgage

    • Origination
    • Servicing
    • Appraisal
    • Commercial Property Tax
  • Insurance

    • Hazard Risk
    • Catastrophe Risk Management
    • Risk Evaluation
    • Underwriting Automation
    • Weather
    • Claims Automation
    • Restoration
    • INTRCONNECT
  • Mortgage Lenders

    • Origination
  • Mortgage Servicers

    • Residential Property Tax
    • Default & Loss Mitigation
    • Portfolio Insight & Monitoring
  • Mortgage Appraisers

    • Appraisal
  • Real Estate Agents & Brokers

    • Agents & Brokers
  • Real Estate MLS

    • Multiple Listing Enterprises
  • Commercial Real Estate Owners

    • Commercial Property Tax
  • Marketing Departments

    • Property Data
  • Insurance Underwriters

    • Risk Evaluation
    • Underwriting Automation
    • Hazard Risk
    • Catastrophe Risk Management
  • Insurance Risk Managers

    • Risk Evaluation
    • Hazard Risk
    • Catastrophe Risk Management
  • Insurance Claims

    • Claims Automation
    • Restoration Contractors
    • Weather Verification
  • Construction Contractors

    • Restoration Contractors
  • General

    • Location Intelligence
    • Lead Generation
    • Data Solutions
Resources
  • Reports

    • Climate Change
    • Construction Cost Update
    • Construction Insights
    • Home Price Insights
    • Homeowner Equity Insights
    • Loan Performance Insight
    • Mortgage Fraud
    • Property Tax Delinquency
    • Single-Family Rent Index
  • Insight Blogs

    • Hazard HQ
    • Office of Chief Economist
    • Affordable Housing
    • Homebuying
    • Insurance
    • Other Articles
  • More Resources

    • Events
    • Case Studies
    • White Papers
    • Podcasts
    • Quick Takes

Home / Intelligence / The Long-View of Housing Appreciation

ABOUT THE AUTHOR
Thomas Malone
Thomas Malone
Professional, Economist
View Profile
  • December 13, 2021

The Long-View of Housing Appreciation

It is easy to say that 2021 was the hottest real estate market ever. According to the S&P CoreLogic Case-Shiller Home Price Index (HPI), annual U.S. appreciation rates from April to September have been at their highest since the inception of the index. March through June produced the highest ever monthly appreciation rates, and CoreLogic’s public records data shows 2021 is easily on pace to be the first year where total residential housing transactions will exceed $2 trillion1. 

Figure 1: one, two, three, four, five and 10-year appreciation in S&P CoreLogic Case Shiller Index, Not Seasonally Adjusted
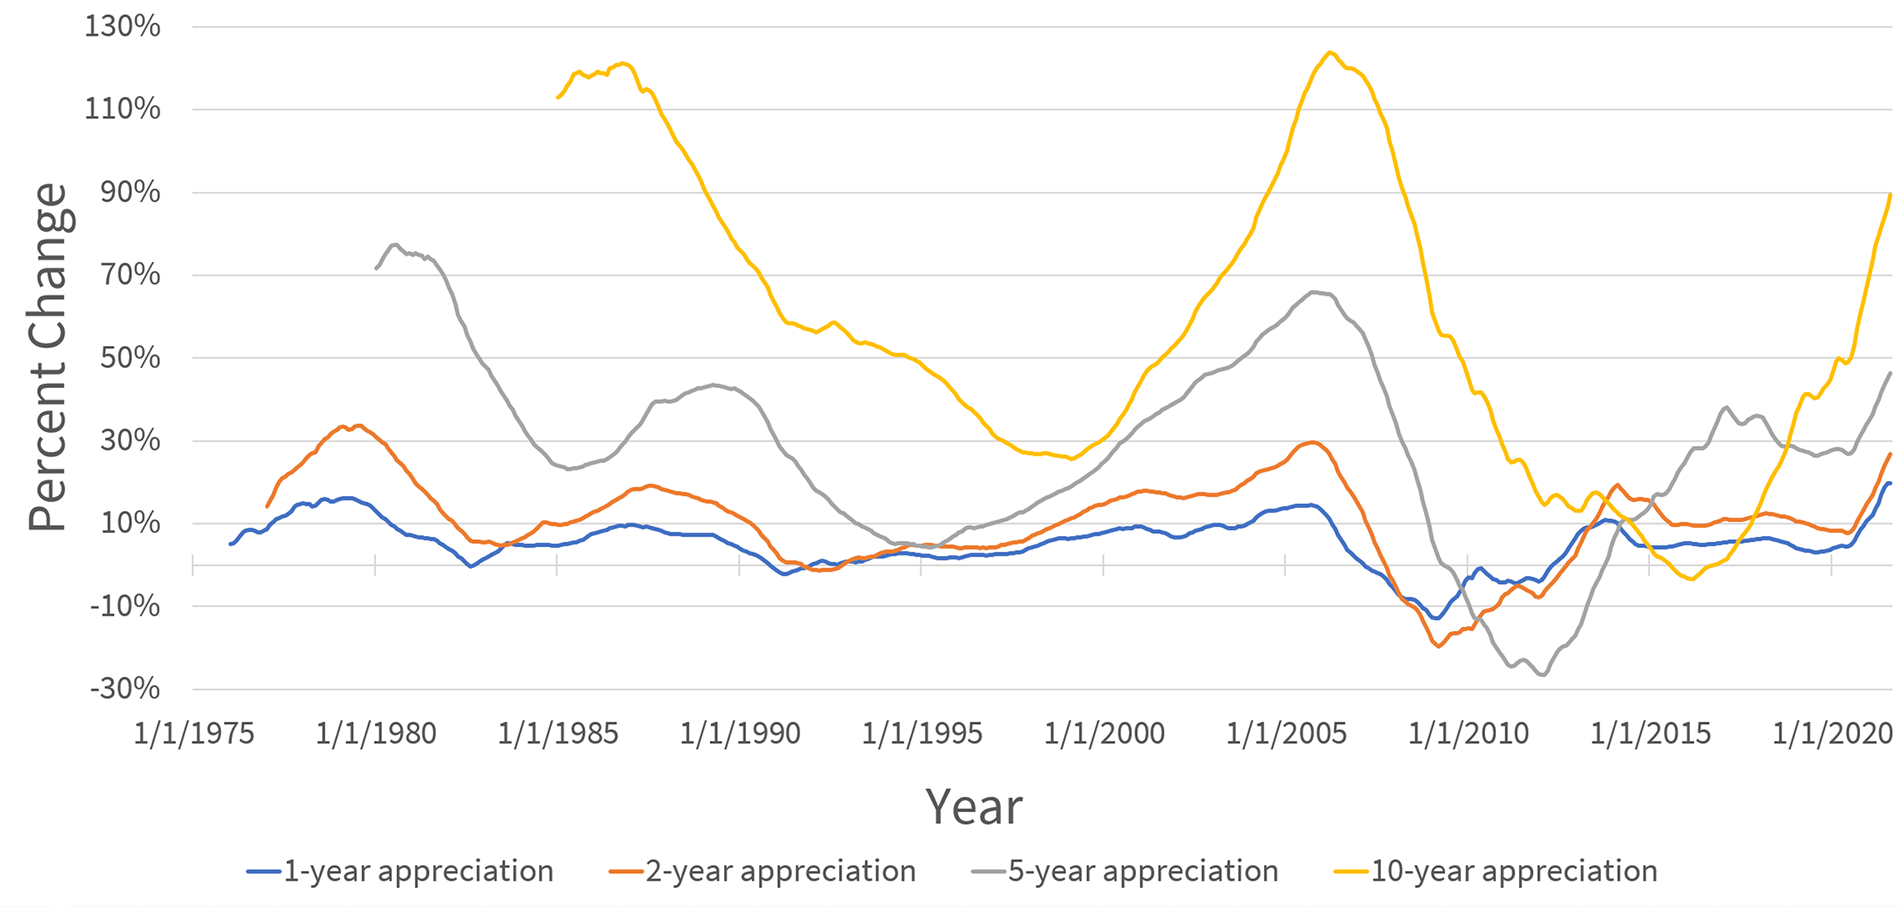
, two, three, four, five and 10-year appreciation in S&P CoreLogic Case Shiller Index, Not Seasonally Adjusted
Source: CoreLogic, Inc.
© 2021 CoreLogic,Inc., All rights reserved.

Real estate values change more slowly than stock and bond prices to new market information. Keeping that in mind, when we take a view of price appreciation longer than one year, the recent surge loses its position. Figure 1 plots one, two, five and 10-year appreciation in the market. The red line, showing one-year appreciation, is highest at the end of the series, marking the current record appreciation. Looking at any of the other lines, we can see that they peak in late 2006, at the zenith of the previous boom. For two-year appreciation, the difference is close at 29 percent in 2006 vs. 27 percent now. Beyond that, the difference grows as the period is extended; five-year-67 vs 47, and 10-year 123 percent vs. 93 percent. 

Figure 2: One, two, three, four, five and 10-year Appreciation in S&P CoreLogic Case Shiller Index, Not Seasonally Adjusted, Adjusted for Inflation
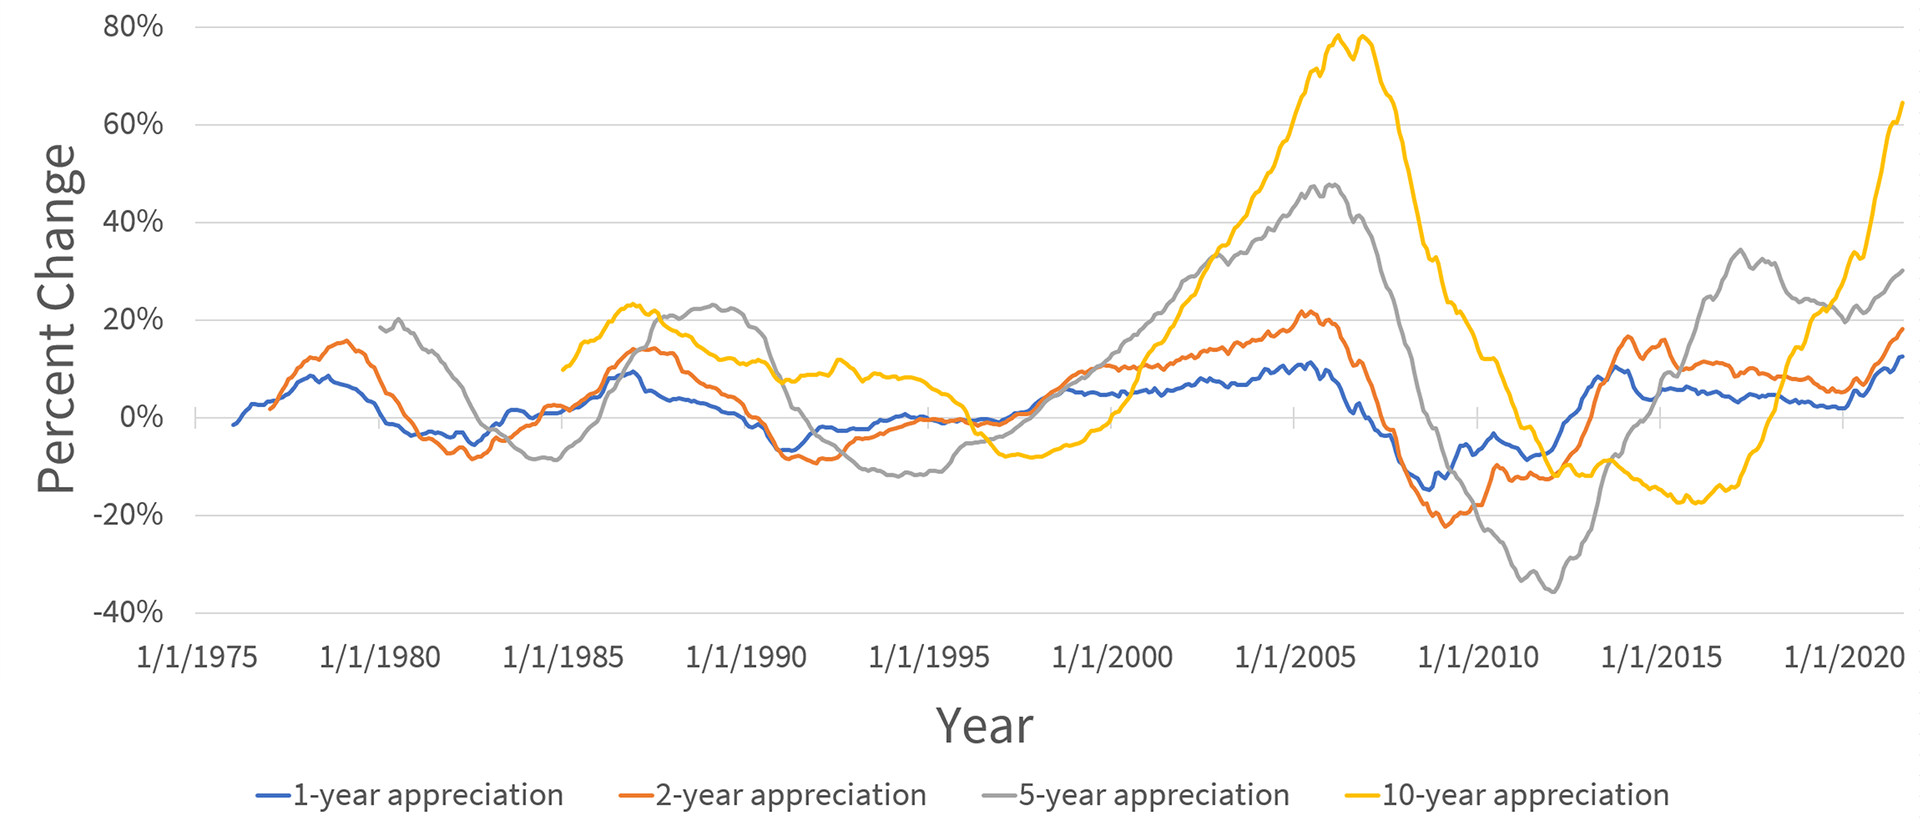
Figure 2: One two three four five and 10 year Appreciation in SP CoreLogic Case Shiller Index Not Seasonally Adjusted Adjusted for Inflation
Source: CoreLogic, Inc.
© 2021 CoreLogic,Inc., All rights reserved.

The difference remains when we look at real home prices. Figure 2 shows the same series adjusted for inflation2. The peaks in the 1970s and 1980s are muted, but from the 1990s onwards we see minor differences between the two figures. The difference in one-year appreciation has shrunk, now 12.5 percent in September 2021 vs 11.5 percent in June 2005, and in every other series, the 2021s boom is outstripped by the previous one3. While the current appreciation is an unprecedented event in terms of short-run appreciation, it is not the long, sustained growth that we saw in the 2000s bubble. 

Though prices have taken off over the past year, we are in an extended period of appreciation. Starting in 2011, prices have begun growing, and have not looked back. Since July 2012, prices have been higher every month than they were at the same time last year, a streak now stretching nine years and two months. This is not a record, but it is close. Starting March 1997 there was positive year-over-year appreciation for every month until November 2006, a streak of nine years and eight months. It is possible that this streak will be eclipsed next year. CoreLogic’s forecast predicts that year over year appreciation will remain positive this long, though the rate of appreciation will taper sustainably, down to about two percent4.

Figure 3: Monthly Appreciation in S&P CoreLogic Case Shiller Index, not seasonally adjusted, adjusted for inflation.
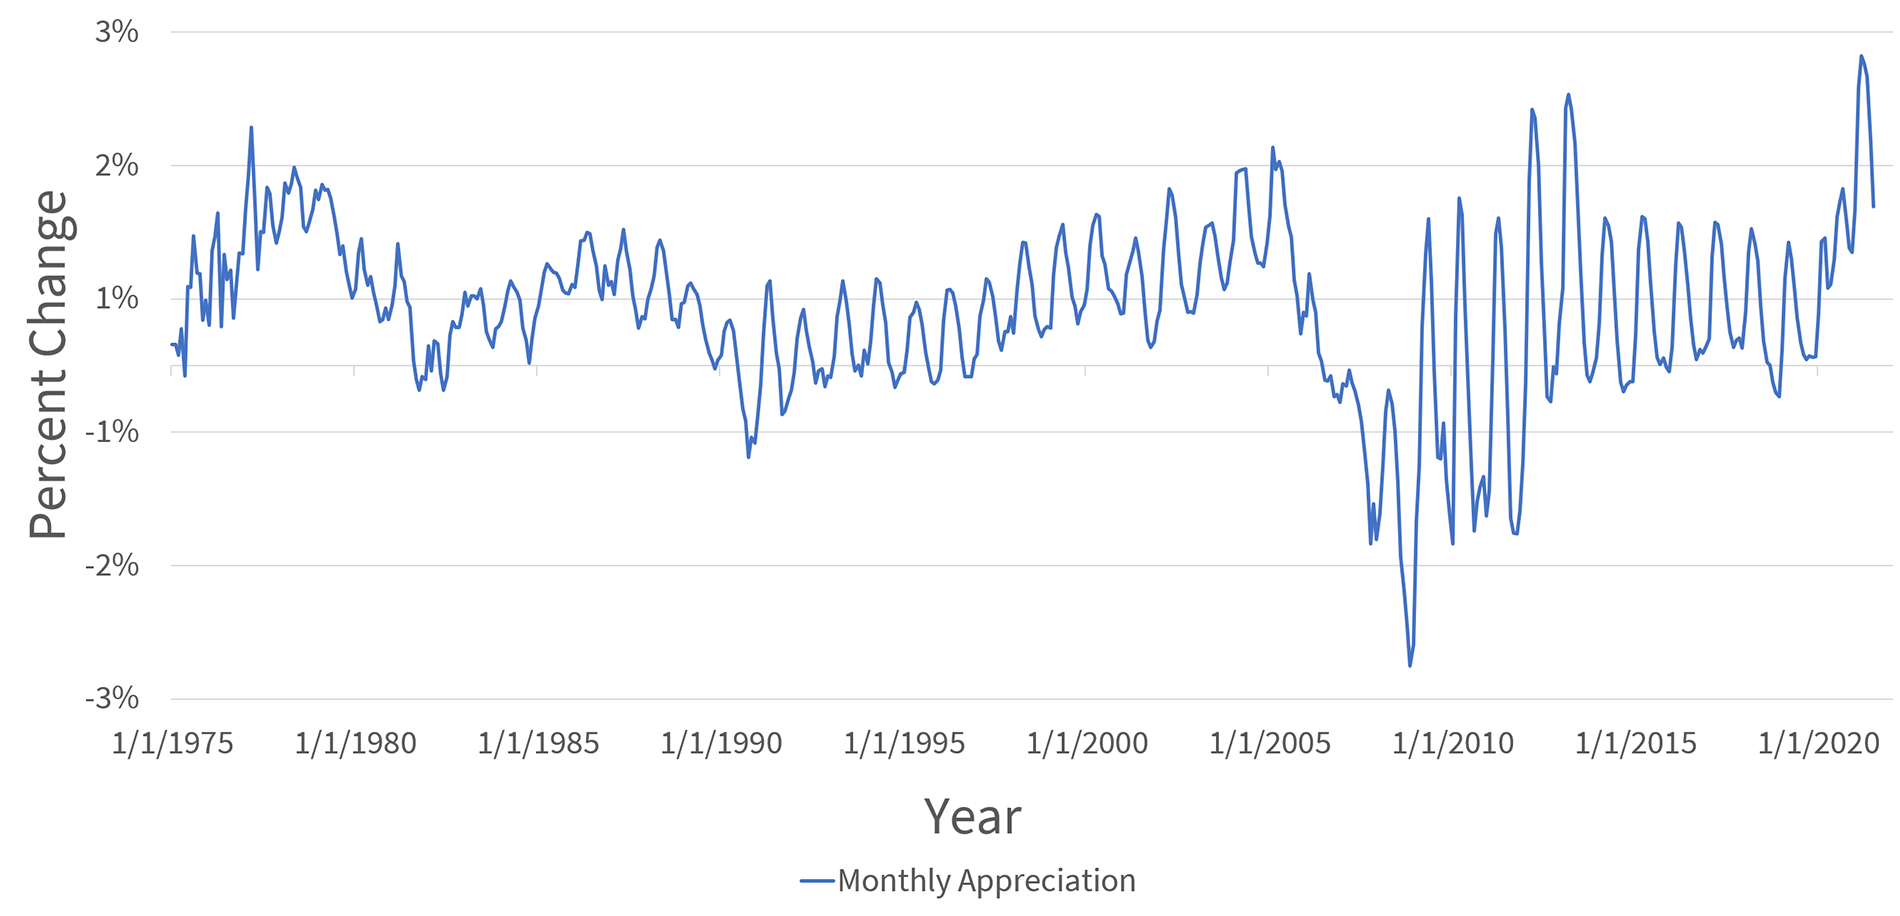
Figure 3: Monthly Appreciation in S&P CoreLogic Case Shiller Index, not seasonally adjusted, adjusted for inflation.
Source: CoreLogic, Inc.
© 2021 CoreLogic,Inc., All rights reserved.

If we consider month over month appreciation, the 2000s boom holds a streak that is unlikely to be broken anytime soon. Beginning in January 1997, prices were higher every month than they were in the previous month until July 2006, a nine-year and six-month streak. Although the year over year streak is more than nine years long as of August this year, the current month over month streak only began in February 2019. 

Another point of comparison is the level of appreciation across the streaks. During the current yearly appreciation streak, prices have gone up 86 percent (that converts to an annualized rate of 6.8 percent). During the 2000s streak, the annualized rate of appreciation was 8.1 percent. 

Although the current level of 1-year appreciation is higher than during the 2000s bubble, a longer view of that appreciation shows that it does not compare to the long, sustained increases in prices that were seen in the bubble.

1 https://www.corelogic.com/intelligence/2021-is-on-pace-to-be-the-first-multi-trillion-dollar-real-estate-market/

2 We use the CPI less shelter to adjust for inflation. This is important because house prices and the cost of shelter are attempting to capture the same thing and are highly correlated.

3 Interesting the 10-year appreciation rate difference shrinks. This is because adjusting for inflation shrinks current appreciation rates, it raises the rates of appreciation from 2012-19, where we saw reasonably strong prices, and very low inflation.

4 https://www.corelogic.com/intelligence/u-s-home-price-insights/

  • Category: Blogs, Intelligence, Office of the Chief Economist
  • Tags: Home Value, Housing Outlook
ABOUT THE AUTHOR
Thomas Malone
Thomas Malone
Professional, Economist
View Profile

Related Posts

Header Intelligence Protect storm HHQ hazard
Climate Change

2023 Severe Convective Storm Risk Report

As rising global temperatures continue to contribute to increasingly hazardous wildfire seasons, it is more important than ever for homeowners, insurers, and governments to understand the risk these hazards pose to their communities.

March 31, 2023
Construction worker framing a house
Construction Insight

Quarterly Construction Insights – Q1 2023

CoreLogic tracks construction cost for commercial, residential and agricultural construction of all types of goods (labor and materials) throughout the United States and Canada.

March 30, 2023
Jan23LPIPromo
Blogs

Loan Performance Insights – March 2023

U.S. mortgage delinquency and foreclosure rates continued to hold near record lows in January.

March 30, 2023

About Corelogic

  • Newsroom
  • Leadership
  • Careers
  • Ethics & Compliance

Accounts

  • Products Sign-in

Contact

  • Sales Contact
  • Product Support

Regions

  • CoreLogic Australia
  • CoreLogic New Zealand
  • CoreLogic UK

Follow & Connect

  • Facebook
  • Instagram
  • Linkedin
  • Twitter
  • YouTube
© 2023 CoreLogic. All rights reserved.
  • Legal
  • Privacy Policy
  • CCPA
  • Cookie Preferences
  • Security
  • Sitemap
  • Accessibility
  • Legal
  • Privacy Policy
  • CCPA
  • Cookie Preferences
  • Security
  • Sitemap
  • Accessibility