Chat
Chat with Sales Hours: Monday-Friday 8:30 a.m. - 4:30 p.m. (CST)
Contact Sales
Call Sales Toll-Free 1-(866) 774-3282 Hours: Monday-Friday 7 a.m. - 5 p.m. (CST)
Product Login
Product Log-in
Product Support
Product Support
Email Sales
Contact Sales
After Hours
  • Support
  • Sign In Sign In
  • AUS NZ UK
CoreLogic - Home
  • Solutions
    view solutions by:

    Data Solutions

    • Lead Generation
    • Property Data
    • Location Intelligence

    Real Estate

    • Multiple Listing Enterprise
    • Agent & Broker

    Mortgage

    • Point of Sale
    • Origination
    • Servicing
    • Appraisal
    • Commercial Property Tax

    Insurance

    • Hazard Risk
    • Catastrophe Risk Management
    • Risk Evaluation
    • Underwriting Automation
    • Weather
    • Claims Automation
    • Restoration
    • INTRCONNECT

    Mortgage Lenders

    • Point of Sale
    • Origination

    Mortgage Servicers

    • Residential Property Tax
    • Default & Loss Mitigation
    • Portfolio Insight & Monitoring

    Mortgage Appraisers

    • Appraisal

    Real Estate Agents & Brokers

    • Agents & Brokers

    Real Estate MLS

    • Multiple Listing Enterprises

    Commercial Real Estate Owners

    • Commercial Property Tax

    Marketing Departments

    • Property Data

    Insurance Underwriters

    • Risk Evaluation
    • Underwriting Automation
    • Hazard Risk
    • Catastrophe Risk Management

    Insurance Risk Managers

    • Risk Evaluation
    • Hazard Risk
    • Catastrophe Risk Management

    Insurance Claims

    • Claims Automation
    • Restoration Contractors
    • Weather Verification

    Construction Contractors

    • Restoration Contractors

    General

    • Location Intelligence
    • Lead Generation
    • Data Solutions
  • Resources

    Reports

    • Climate Change
    • Construction Claims Bulletin
    • Construction Cost Update
    • Construction Insights
    • Home Price Insights
    • Homeowner Equity Insights
    • Loan Performance Insight
    • Mortgage Fraud
    • Property Tax Delinquency
    • Single-Family Rent Index

    Insight Blogs

    • Hazard HQ
    • Office of Chief Economist
    • Affordable Housing
    • Homebuying
    • Insurance
    • Other Articles

    More Resources

    • Events
    • Case Studies
    • White Papers
    • Podcasts
    • Quick Takes
  • Company
    • About
    • Leadership
    • Newsroom
    • Contact
    • Careers
  • Search
CoreLogic - Home
  • Solutions
  • Resources
  • Company

    • About
    • Leadership
    • Newsroom
    • Contact
    • Careers
  • Accounts

    • Products Sign-in
  • Contact

    • Sales Contact
    • Product Support
  • Regions

    • Australia
    • New Zealand
    • United Kingdom
  • Social

    • Facebook
    • Instagram
    • Linkedin
    • Twitter
    • Youtube
Solutions
VIEW BY:
  • Data Solutions

    • Lead Generation
    • Property Data
    • Location Intelligence
  • Real Estate

    • Multiple Listing Enterprise
    • Agent & Broker
  • Mortgage

    • Point of Sale
    • Origination
    • Servicing
    • Appraisal
    • Commercial Property Tax
  • Insurance

    • Hazard Risk
    • Catastrophe Risk Management
    • Risk Evaluation
    • Underwriting Automation
    • Weather
    • Claims Automation
    • Restoration
    • INTRCONNECT
  • Mortgage Lenders

    • Point of Sale
    • Origination
  • Mortgage Servicers

    • Residential Property Tax
    • Default & Loss Mitigation
    • Portfolio Insight & Monitoring
  • Mortgage Appraisers

    • Appraisal
  • Real Estate Agents & Brokers

    • Agents & Brokers
  • Real Estate MLS

    • Multiple Listing Enterprises
  • Commercial Real Estate Owners

    • Commercial Property Tax
  • Marketing Departments

    • Property Data
  • Insurance Underwriters

    • Risk Evaluation
    • Underwriting Automation
    • Hazard Risk
    • Catastrophe Risk Management
  • Insurance Risk Managers

    • Risk Evaluation
    • Hazard Risk
    • Catastrophe Risk Management
  • Insurance Claims

    • Claims Automation
    • Restoration Contractors
    • Weather Verification
  • Construction Contractors

    • Restoration Contractors
  • General

    • Location Intelligence
    • Lead Generation
    • Data Solutions
Resources
  • Reports

    • Climate Change
    • Construction Claims Bulletin
    • Construction Cost Update
    • Construction Insights
    • Home Price Insights
    • Homeowner Equity Insights
    • Loan Performance Insight
    • Mortgage Fraud
    • Property Tax Delinquency
    • Single-Family Rent Index
  • Insight Blogs

    • Hazard HQ
    • Office of Chief Economist
    • Affordable Housing
    • Homebuying
    • Insurance
    • Other Articles
  • More Resources

    • Events
    • Case Studies
    • White Papers
    • Podcasts
    • Quick Takes

Home / Intelligence / U.S. Home Supply Tightest Since 2000

ABOUT THE AUTHOR
Shu Chen
Shu Chen
Senior Professional, Statistical Analysis, Office of the Chief Economist
View Profile
  • May 28, 2021

U.S. Home Supply Tightest Since 2000

National Supply of Homes for Sale Fell to 2.2 Months in March 2021

Months into 2021, housing supply remains at historically low levels while the impact from the pandemic and low mortgage interest rates linger. This has meant that some potential sellers are still holding on to their properties in fear of the virus while homebuyers are flooding the market, trying to capture the benefits of low mortgage interest rates. Together, these have shrunk the already small supply of available homes.

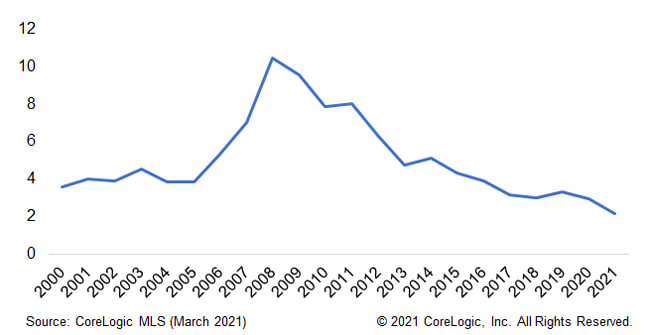
Nationally, the number of homes for sale equated to a 2.2-month supply[1] in March 2021, falling from a supply of 3 months in March 2020, the lowest months’ supply since 2000 (Figure 1).

Figure 1: Tightest Supply Since 2000
 

With demand strong and supply tight, many homes didn’t spend long on the market in in the first three months of 2021. Figure 2 shows that over the past two years, the share of homes selling within 30 days of the initial list date[2] has been at the highest level since 2000. In March 2021, the share selling within 30 days was 26.4%, higher than the pre-pandemic peak of 23.6% in May 2019 and more than four times of the level during the January 2011 trough.
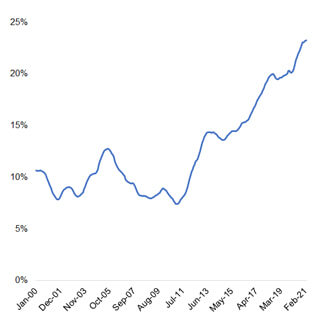
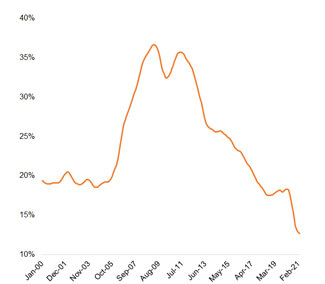
Figure 2: Homes Sold Fast

Figure 3: For-Sale Inventory Low

Source: CoreLogic TrueStandings® Servicing© 2021 CoreLogic,Inc., All rights reserved.

Figure 3 shows the share of the for-sale inventory that was on the market for more than 180 days, an indicator of the homes that are hard to sell. In March 2021, that share was 11.3%, which was about half of the share in March 2020, and a quarter of the January 2009 peak of 41.4%.
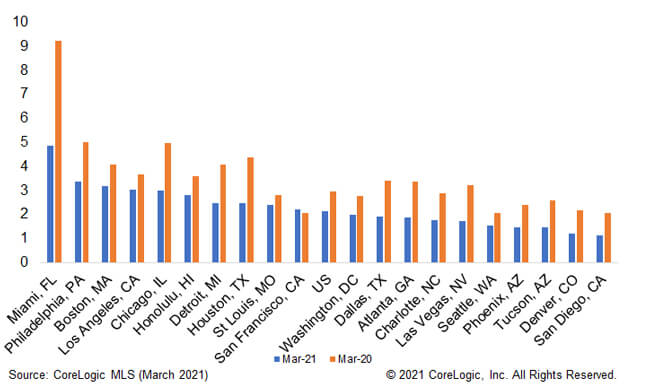
Figure 4: Supply is Down in Most Large Metros US and CBSA Months of Supply

Figure 4 shows the months of supply in the U.S. (based on data for 68 metropolitan areas) and selected metropolitan areas in March 2021 and March 2020. Nationwide, the inventory decreased 22.5% year-over-year in March, with the supply at 2.2 months in March 2021 compared with 3 months in March 2020.

Out of 20 metropolitan areas, 19 showed declines in months’ supply in March 2021 compared with a year earlier. Miami had the largest drop in supply, decreasing 4.3 months, from 9.2 in March 2021 to 4.9 in March 2020. San Francisco was the only metro that showed an increase in supply compared to a year ago. It’s also one of the five metros that showed declined in home price year-over-year change in March.

With the increase in COVID-19 vaccine availability and strong home price growth, potential home sellers might be more willing to put their homes on the market for a good price in the coming months, which would help release supply and reduce the shortage in for-sale homes.

© 2021 CoreLogic, Inc. , All rights reversed.


[1] The months of supply, or months of inventory, is calculated as the ratio of the for-sale inventory at the end of the month to the number of homes sold during the same month, and represents the number of months it would take to sell the inventory at that month’s sales pace. The U.S. statistics are based on data for 68 metropolitan areas.

[2] Figures 2 and 3 show a rolling 12-month average.

  • Category: Blogs, Intelligence, Office of the Chief Economist
  • Tags: Affordability, Real Estate
ABOUT THE AUTHOR
Shu Chen
Shu Chen
Senior Professional, Statistical Analysis, Office of the Chief Economist
View Profile

Related Posts

Wildfire Banner - Hazard HQ
Blogs

Wildfires in Canada Spreading, New Fires in Additional Provinces

Canada wildfires continue to burn across Alberta and new fires ignite in Nova Scotia, damaging homes near Halifax.

June 2, 2023
National flood insurance program coverage requirements
Blogs

Top Three Myths About Mandatory Purchase of Flood Insurance Coverage in Special Flood Hazard Areas Debunked

Just because national flood insurance program coverage is not required on a home, doesn’t mean a house should be uninsured.

June 2, 2023
Eye of the storm
Blogs

2023 Hurricane Risk Report

The 2023 Hurricane Risk Report provides insight into property risk, both nationally and by metro area, across single-family homes and multifamily homes from hurricane-driven wind and storm surge.

May 31, 2023

About Corelogic

  • Newsroom
  • Leadership
  • Careers
  • Ethics & Compliance

Accounts

  • Products Sign-in

Contact

  • Sales Contact
  • Product Support

Regions

  • CoreLogic Australia
  • CoreLogic New Zealand
  • CoreLogic UK

Follow & Connect

  • Facebook
  • Instagram
  • Linkedin
  • Twitter
  • YouTube
© 2023 CoreLogic. All rights reserved.
  • Legal
  • Privacy Policy
  • CCPA
  • Cookie Preferences
  • Security
  • Sitemap
  • Accessibility
  • Legal
  • Privacy Policy
  • CCPA
  • Cookie Preferences
  • Security
  • Sitemap
  • Accessibility