Chat
Chat with Sales Hours: Monday-Friday 8:30 a.m. - 4:30 p.m. (CST)
Contact Sales
Call Sales Toll-Free 1-(866) 774-3282 Hours: Monday-Friday 7 a.m. - 5 p.m. (CST)
Product Login
Product Log-in
Product Support
Product Support
Email Sales
Contact Sales
After Hours
  • Support
  • Sign In Sign In
  • AUS NZ UK
CoreLogic - Home
  • Solutions
    view solutions by:

    Data Solutions

    • Lead Generation
    • Property Data
    • Location Intelligence

    Real Estate

    • Multiple Listing Enterprise
    • Agent & Broker

    Mortgage

    • Origination
    • Servicing
    • Appraisal
    • Commercial Property Tax

    Insurance

    • Hazard Risk
    • Catastrophe Risk Management
    • Risk Evaluation
    • Underwriting Automation
    • Weather Verification
    • Claims Automation
    • Restoration
    • INTRCONNECT

    Mortgage Lenders

    • Origination

    Mortgage Servicers

    • Residential Property Tax
    • Default & Loss Mitigation
    • Portfolio Insight & Monitoring

    Mortgage Appraisers

    • Appraisal

    Real Estate Agents & Brokers

    • Agents & Brokers

    Real Estate MLS

    • Multiple Listing Enterprises

    Commercial Real Estate Owners

    • Commercial Property Tax

    Marketing Departments

    • Property Data

    Insurance Underwriters

    • Risk Evaluation
    • Underwriting Automation
    • Hazard Risk
    • Catastrophe Risk Management

    Insurance Risk Managers

    • Risk Evaluation
    • Hazard Risk
    • Catastrophe Risk Management

    Insurance Claims

    • Claims Automation
    • Restoration Contractors
    • Weather Verification

    Construction Contractors

    • Restoration Contractors

    General

    • Location Intelligence
    • Lead Generation
    • Data Solutions
  • Resources

    Reports

    • Climate Change
    • Construction Cost Update
    • Construction Insights
    • Home Price Insights
    • Homeowner Equity Insights
    • Loan Performance Insight
    • Mortgage Fraud
    • Property Tax Delinquency
    • Single-Family Rent Index

    Insight Blogs

    • Hazard HQ
    • Office of Chief Economist
    • Affordable Housing
    • Homebuying
    • Insurance
    • Other Articles

    More Resources

    • Case Studies
    • White Papers
    • Podcasts
    • Quick Takes
  • Company
    • About
    • Leadership
    • Newsroom
    • Contact
    • Careers
  • Search
CoreLogic - Home
  • Solutions
  • Resources
  • Company

    • About
    • Leadership
    • Newsroom
    • Contact
    • Careers
  • Accounts

    • Products Sign-in
  • Contact

    • Sales Contact
    • Product Support
  • Regions

    • Australia
    • New Zealand
    • United Kingdom
  • Social

    • Facebook
    • Instagram
    • Linkedin
    • Twitter
    • Youtube
Solutions
VIEW BY:
  • Data Solutions

    • Lead Generation
    • Property Data
    • Location Intelligence
  • Real Estate

    • Multiple Listing Enterprise
    • Agent & Broker
  • Mortgage

    • Origination
    • Servicing
    • Appraisal
    • Commercial Property Tax
  • Insurance

    • Hazard Risk
    • Catastrophe Risk Management
    • Risk Evaluation
    • Underwriting Automation
    • Weather Verification
    • Claims Automation
    • Restoration
    • INTRCONNECT
  • Mortgage Lenders

    • Origination
  • Mortgage Servicers

    • Residential Property Tax
    • Default & Loss Mitigation
    • Portfolio Insight & Monitoring
  • Mortgage Appraisers

    • Appraisal
  • Real Estate Agents & Brokers

    • Agents & Brokers
  • Real Estate MLS

    • Multiple Listing Enterprises
  • Commercial Real Estate Owners

    • Commercial Property Tax
  • Marketing Departments

    • Property Data
  • Insurance Underwriters

    • Risk Evaluation
    • Underwriting Automation
    • Hazard Risk
    • Catastrophe Risk Management
  • Insurance Risk Managers

    • Risk Evaluation
    • Hazard Risk
    • Catastrophe Risk Management
  • Insurance Claims

    • Claims Automation
    • Restoration Contractors
    • Weather Verification
  • Construction Contractors

    • Restoration Contractors
  • General

    • Location Intelligence
    • Lead Generation
    • Data Solutions
Resources
  • Reports

    • Climate Change
    • Construction Cost Update
    • Construction Insights
    • Home Price Insights
    • Homeowner Equity Insights
    • Loan Performance Insight
    • Mortgage Fraud
    • Property Tax Delinquency
    • Single-Family Rent Index
  • Insight Blogs

    • Hazard HQ
    • Office of Chief Economist
    • Affordable Housing
    • Homebuying
    • Insurance
    • Other Articles
  • More Resources

    • Case Studies
    • White Papers
    • Podcasts
    • Quick Takes

Home / Intelligence / U.S. S&P CoreLogic Case-Shiller Home Price Index Finishes the Year of Novels at Double-Digit Rate

ABOUT THE AUTHOR
Selma Hepp
Selma Hepp
Chief Economist
View Profile
  • February 23, 2021

U.S. S&P CoreLogic Case-Shiller Home Price Index Finishes the Year of Novels at Double-Digit Rate

Home prices up 10.4% in December as buyer competition reached new highs

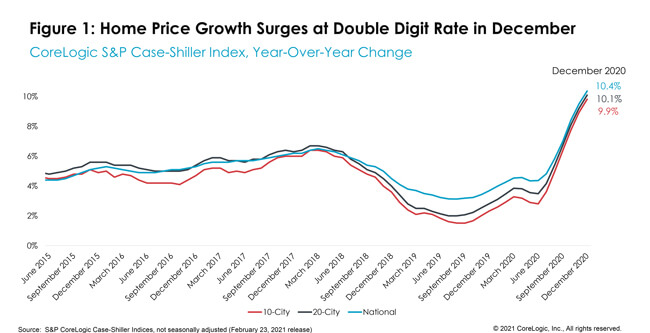
With a full year of data, S&P CoreLogic Case-Shiller Index once again proved that 2020 was an unprecedented year in many ways, especially for the housing market. In December, the index surged at 10.4% – the first double-digit increase since January 2014. The month-to-month index also increased 0.85%, making it the strongest November- to-December increase since the data series began. 

As mortgage rates continued to dip to record lows through the end of 2020, homebuyers persisted with their purchases, leading to the strongest fourth-quarter sales activity since 2009, up about 19% nationally from the last quarter of 2019.[1] However, buyers were competing for dwindling inventory of for-sale homes, which averaged less than two months’ supply in the last quarter of 2020. As a result, CoreLogic Buyer/Seller Market Indicator[2], which measures the ratio between sold price and list price and proxies buyer competition, maintained at 0.996 — the highest level since 2008, when the data series began. At almost a ratio of 1, the Indicator suggests that sellers are generally getting their full asking price. The Buyer/Seller Market Indicator typically follows housing market seasonality and troughs in the winter months, a trend that was upended in the last quarter of 2020.  

The 10- and 20-city composite indexes continued the rapid upward trajectory, up 9.8% and 10.1% year over year, respectively. Both indices continue to surge at the fastest pace since early 2014, when home prices were experiencing a similar rate of haste (Figure 1). Compared to the prior peak, the 10-city composite is now 12% higher, while the 20-city composite is 17% higher than the previous peak both indexes reached in 2006.

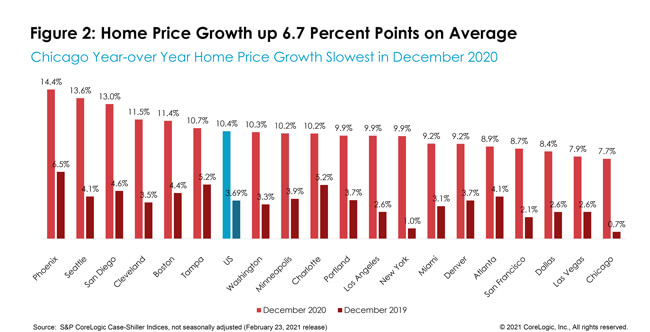
For the 18th consecutive month, Phoenix remains the city with fastest home price growth, experiencing a surge of 14.4% in December – the fastest acceleration since December 2013. Seattle remained in second place, with an annual increase of 13.6%. The city also had the largest acceleration in index growth compared to a year ago — up 9.5 percentage points. Twelve of the 19 cities* with data available had double-digit home price growth in December.  

Las Vegas, with a 7.9% annual increase, has picked up pace since November when it ranked on the bottom of the price growth list. Conversely, Chicago fell to the bottom with just a 7.7% increase, although it still maintained rapid price growth, especially compared to a year ago when its index only increased at 0.7%. New York, which also lagged over the last year, has now moved up with a 9.9% surge in home prices. (Figure 2)

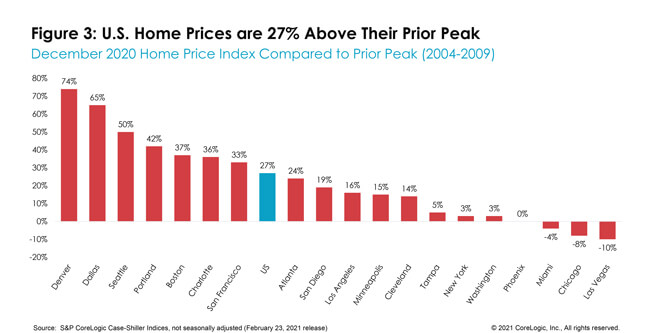
In December, national home prices were 27% higher than the previous peak. Three cities remain below their previous peaks: Las Vegas, Chicago and Miami. Phoenix prices have now recovered to their prior peak. Las Vegas, now experiencing some slowdown in home price acceleration, is still 10% below its previous peak. By contrast, Denver’s prices have leapt 74% above its 2006 peak, followed by Dallas at 65% (Figure 3).

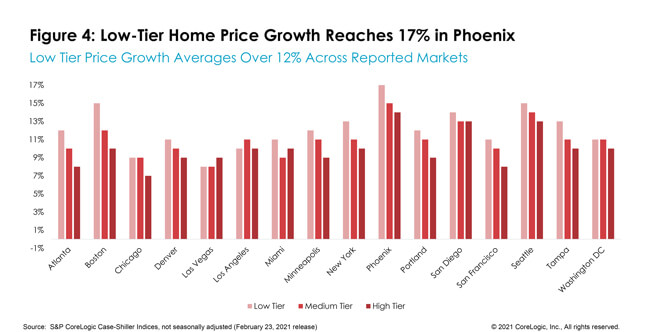
Prices of homes in the lower one-third of the price distribution continued the steep uphill course as millennial buyers compete for fewer homes on the market. Prices in the lower one-third jumped by 12% on average in December, with Phoenix showing a 17% jump, followed by a 15% jump in both Seattle and Boston. The average growth among medium-tier priced homes was 10.9%, and prices in the highest-tier were up 9.9% on average. While low-tier homes are experiencing strong year-over-year index acceleration, medium- and high-tier homes have had faster pick-up in acceleration since the onset of the pandemic, when high-tier prices had the highest acceleration with 6.2 percentage points, compared to a 4.9 percentage point increase among low tiers (Figure 4).

While a lack of distressed sales activity in December helped with the index acceleration, persistent buyer demand amid the severely undersupplied housing market has undeniably pushed home prices to new highs. However, a continual decline in mortgage rates that led to new record lows has helped expand the affordability box for some buyers, allowing some to bid on higher prices than they would have likely been able to if rates were higher. In looking ahead, pressure on home prices is not likely to wane until mortgage rates significantly rise and/or more homes are available for sale. The CoreLogic HPI Forecast predicts continually strong price growth through December 2021.

*Due to the COVID-19 crisis, S&P Dow Jones Indices and CoreLogic are unable to generate a valid December 2020 update of the Detroit S&P CoreLogic Case-Shiller indices for the December release; thus, Detroit was excluded from the analysis.

©2021 CoreLogic, Inc., All rights reserved.

[1] Source: CoreLogic ListingTrends, January 25, 2020 release

[2] Ibid.

  • Category: Home Price Insights, Intelligence, Reports
  • Tags: Case Shiller Index, Home Value
ABOUT THE AUTHOR
Selma Hepp
Selma Hepp
Chief Economist
View Profile

Related Posts

Jan23CSIPromo
Home Price Insights

US CoreLogic S&P Case-Shiller Index Growth Rate Cools Further in November, Up by 7.7%

Annual U.S. home price growth continued to relax in November for the seventh straight month.

January 31, 2023
CoreLogic Reactor Tordado
Hazard HQ

January 24 EF-3 Tornado in Harris County, Texas

CoreLogic Tornado Forensics Technology captured the EF-3 tornado path that ripped through southeastern Harris County on Jan. 24 to damage homes and disrupt industrial operations.

January 31, 2023
Appraisal Waiver
Blogs

How New Appraisal Waiver Policies Affect Old Homebuying Practices

Electing to accept an appraisal waiver may make the difference between closing on a loan and getting stuck in a repeat bidding cycle.

January 27, 2023

About Corelogic

  • Newsroom
  • Leadership
  • Careers
  • Ethics & Compliance

Accounts

  • Products Sign-in

Contact

  • Sales Contact
  • Product Support

Regions

  • CoreLogic Australia
  • CoreLogic New Zealand
  • CoreLogic UK

Follow & Connect

  • Facebook
  • Instagram
  • Linkedin
  • Twitter
  • YouTube
© 2023 CoreLogic. All rights reserved.
  • Legal
  • Privacy Policy
  • CCPA
  • Security
  • Sitemap
  • Accessibility
  • Legal
  • Privacy Policy
  • CCPA
  • Security
  • Sitemap
  • Accessibility