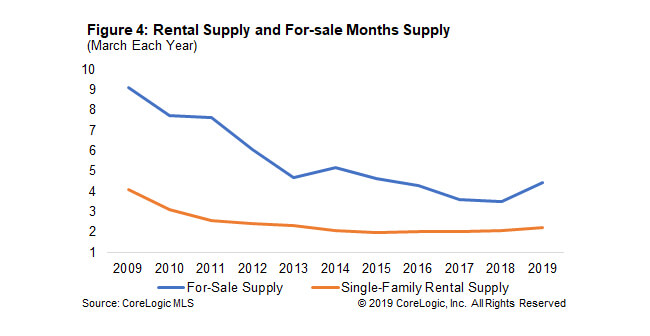
The number of homes for sale Inventory has been at a historical low in the U.S. In March 2019, there was 4.5 months’ supply of homes for sale[1]. While up from the prior March’s 3.5 months, the months of supply of homes for sale this March was less than half of what it was ten years ago, 9.1 months in March 2009. Not only is new construction and mobility – two traditional drivers of inventory – at low levels, but some potential inventory shifted to the rental market over the past ten years.

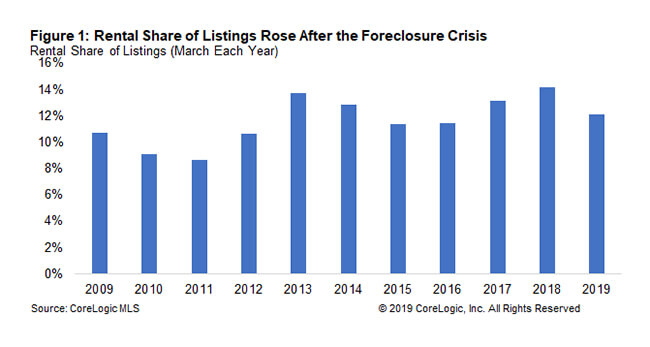
During the Great Recession and 2006-2011 home-price drop, many homes were foreclosed upon or traded as short sales and ended up being purchased by investors, with a number of these houses eventually becoming rental properties. Figure 1 shows the rental share of all listings, meaning all homes available for sale or to rent, over the past decade using the 48 metro areas out of the largest 100 for which CoreLogic has both for-sale and rental Multiple Listing Service coverage. The share of rental inventory increased from 8.7 percent of all homes available for sale or rent in March 2011 to 14.2 percent in March 2018 – a gain of 5.5 percentage points.

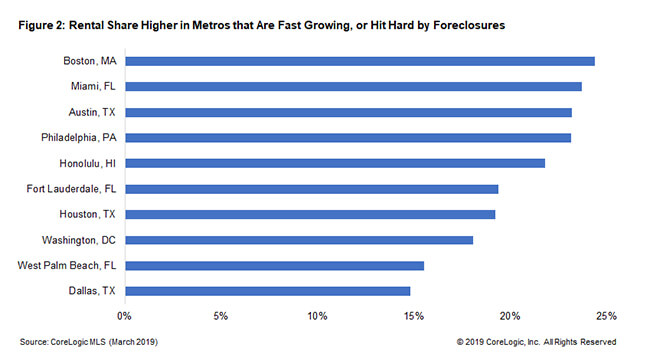
While the average rental share of listings for all 48 CBSAs was 12.1 percent this March, some individual metro areas showed much higher shares. Figure 2 shows the 10 metro areas with the highest share of listings that were rentals. The list is made up of fast-growing cities, such as those in Texas, expensive cities like Boston, and cities like Miami that were hit particularly hard during the foreclosure crisis.

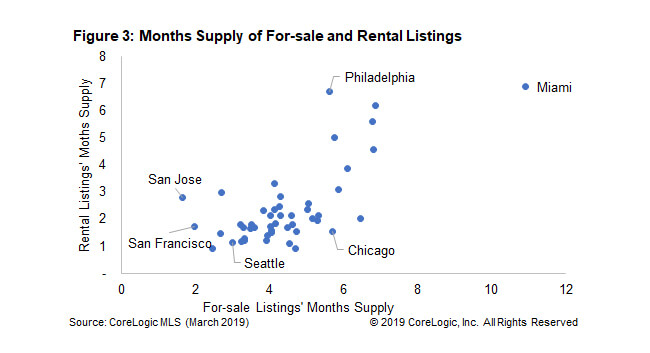
A relatively high rental share of available inventory doesn’t necessarily equate to having a large housing supply overall, as the rental market in many regions has low inventory just like the for-sale market. For example, while Austin had a high for-rent listing share, there was only 1.7 months of supply for rent in that city. Figure 3 shows the 48 markets’ months supplies for both for-sale and rental listings in March 2019. 17 out of these 48 markets’ supply were less than the US average of 4.5 months.

The for-sale housing undersupply may have been exacerbated by increases in the single-family rental supply. By 2018, the rental share of total listings has increased by about a third since the foreclosure crisis. However, as Figure 4 shows, like the for-sale market, the months’ supply for rental single-family is at very low levels. Low levels of supply put upward pressure on the cost of both for-sale and for-rent homes. Home prices, while increasing at a slower pace over the past year, are still rising, as are single-family rents.
[1] The months of supply, or months of inventory, is calculated as the ratio of the for-sale inventory at the end of the month to the number of homes sold during the same month, and represents the number or months it would take to sell the inventory at that month’s sales pace. The U.S. statistics are based on data for 48 Core Based Statistical Areas (CBSAs).
© 2019 CoreLogic, Inc. All rights reserved.


