Home prices nationally are down by 4% from June’s peak, with double-digit declines seen in San Francisco and Seattle
Housing market conditions deteriorated considerably at the end of 2022. Home price growth continued its rapid deceleration, as homebuyers and sellers decided to wait out the winter, with some fazed by high mortgage rates. The 2022 surge in rates from 3% to 7% wiped out about 30% of homebuyers’ purchasing power, thus significantly eroding affordability. Seller withdrawal was similarly evident by a large drop in new listings on the market, causing for-sale inventory to decline to yet another all-time low.
Nevertheless, falling mortgage rates in December brought about some renewed optimism among buyers. And if mortgage rates continue trending lower, the 2023 spring homebuying season may prove busier than initially expected.
In November, the CoreLogic S&P Case-Shiller Index posted a 7.7% year-over-year increase, down from a 9.2% gain in October, marking the seventh straight month of decelerating annual home price gains. The rapid decline in home price growth puts this November’s annual gain as the slowest since September 2020 (Figure 1).
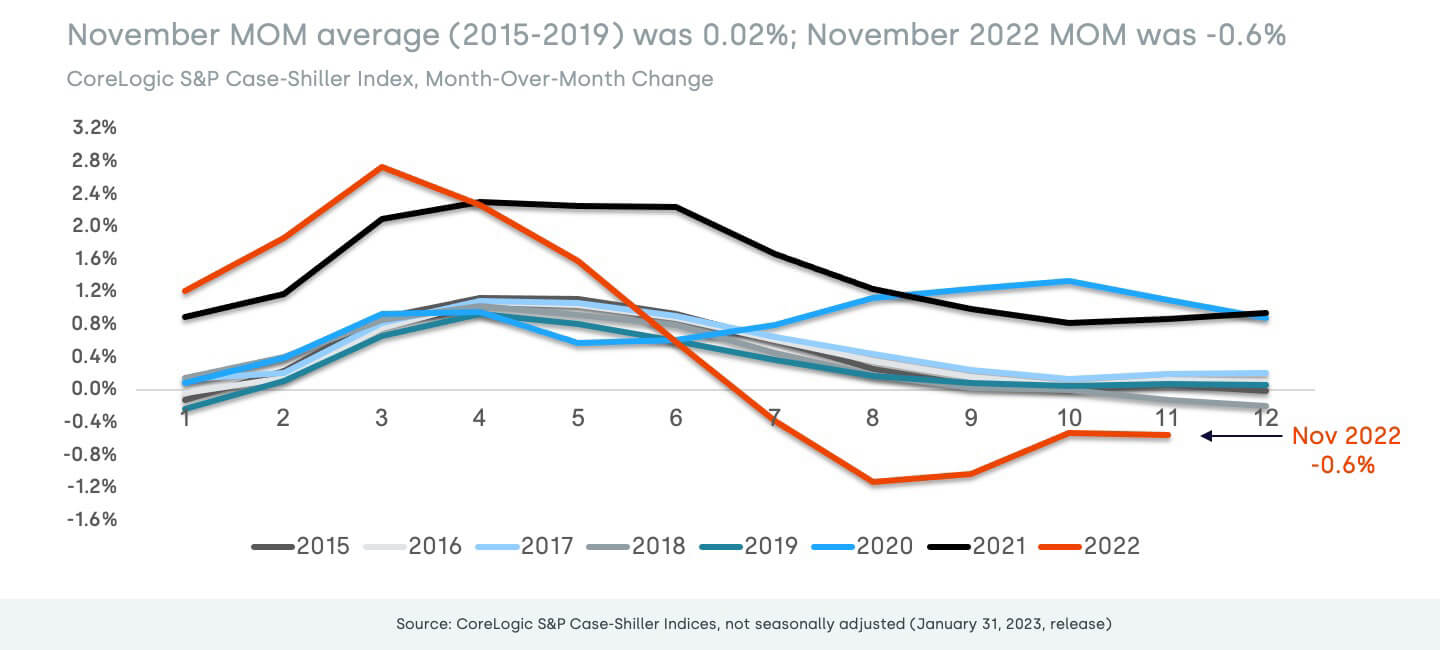
In addition, the non-seasonally adjusted month-to-month index posted its fifth month of declines, down by 0.56% in November from a 0.53% decrease in October. Between 2014 and 2019, the monthly index changes from October to November have been generally flat, averaging about a 0.02% gain (Figure 2). Following the rapid monthly declines in the summer of 2022, the rate of deceleration has slowed in recent readings, suggesting that the overall price decline from last spring’s peak may be stabilizing. Cumulatively, home prices in the national index are down by 4% from the 2022 high point.
At this pace, and according CoreLogic’s Home Price Index forecast, annual home price growth is expected to slow further and post annual declines by the spring of 2023. Some markets will see more notable price slowing and declines in 2023, though decreases are expected to remain regionalized and specific to metro areas that saw relatively more price growth during the pandemic, such as Las Vegas and Phoenix. Based on CoreLogic’s latest HPI, eight metro areas recorded year-over-year price declines in November, with most of them located in California’s Bay Area and second-home markets that boomed during the pandemic, such as Boise, Idaho and Bloomsburg, Pennsylvania.
The 10- and 20-city composite indexes followed the same decelerating trend in November — up by 6.3% and 6.8% year over year, respectively. And while the overall trend of stronger price gains in smaller markets continued to drive the 20-city index’s growth, slowing appreciation was slightly more evident in those are as they tend to include more affordable markets that are being hit harder by declining buyer purchasing power.
Compared with the 2006 peak, the 10-city composite price index is now 38% higher, while the 20-city composite is up by 46%. Adjusted for inflation, which continues to remain concerningly elevated, the 10-city index is now down by 4%, while the 20-city index is up by 2% compared with its 2006 high point.
Figure 1: November Home Price Appreciation Shrinking Quickly
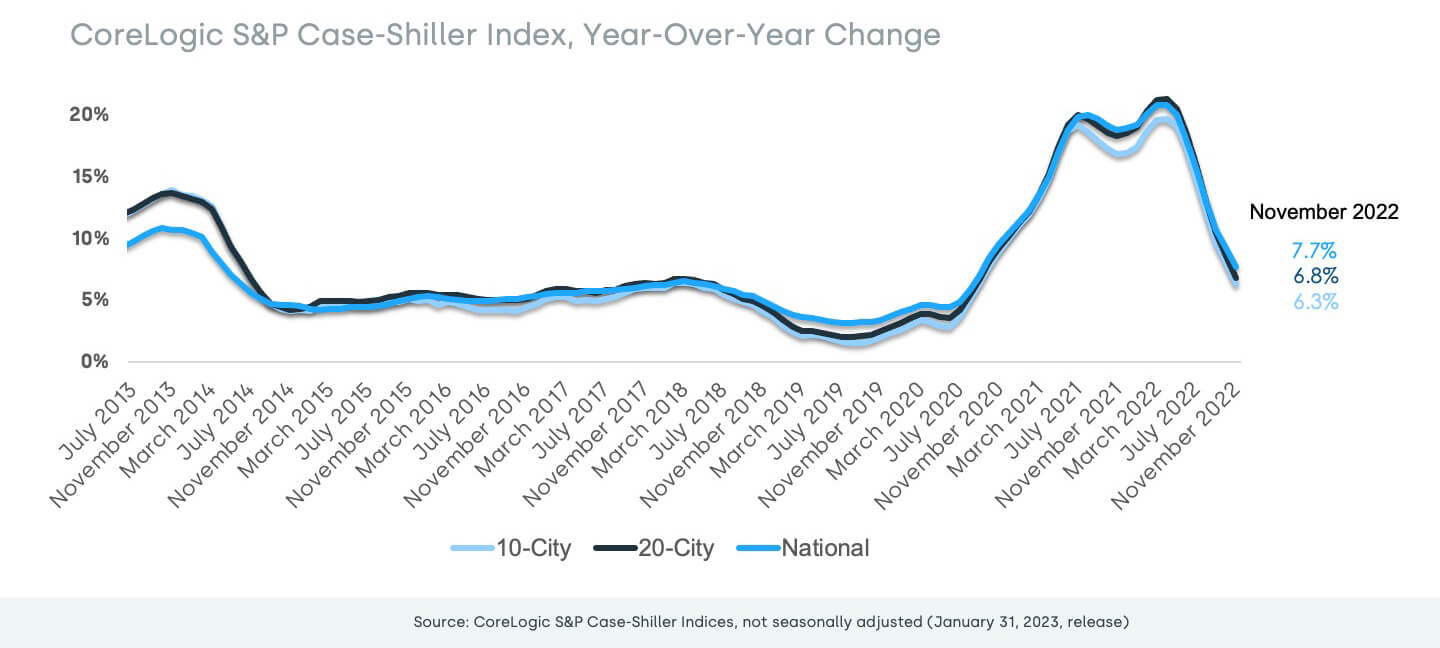
Figure 2: Month-to-Month Price Declines Stabilized in November
Miami posted the strongest annual home price growth among the 20 tracked markets for the fourth straight month, surging by 18.4% in November but down from October’s non-seasonally adjusted rate of 21%. Tampa, Florida again ranked second, recording a 16.9% year-over-year gain in November, down from 20.5% in October.
Atlanta posted the third-highest increase, 12.7% in November. Charlotte, North Carolina and Dallas rounded out the metros that continued to post double-digit annual increases in November. Phoenix’s rapidly slowing housing market pulled the metro down to the 11th position with a 6.3% increase — down from its peak gain of 32.9% in February 2022.
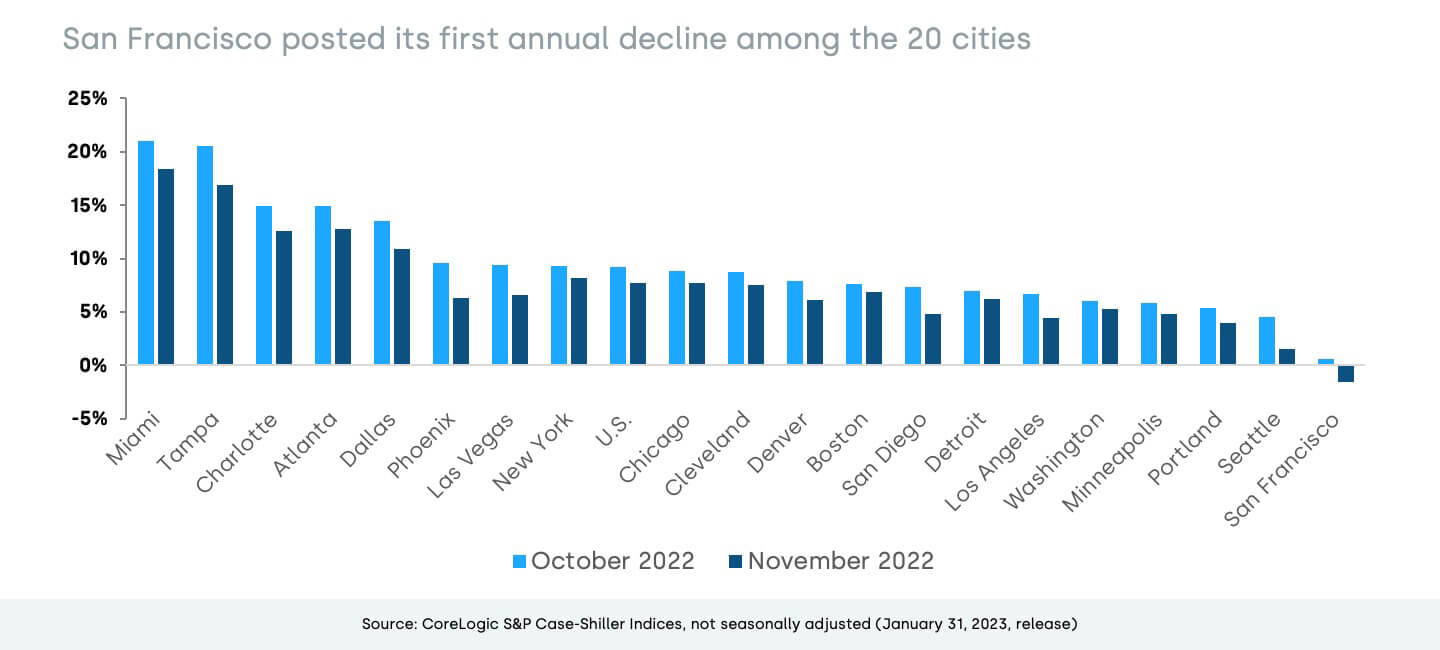
For the first time in the data series since the onset of the pandemic, San Francisco home prices posted an annual decline, down by 1.6% in November.
In November, all 20 metros continued to experience decelerating annual gains (Figure 3). Tampa and Phoenix posted the largest monthly price drops, both down by about 3.5 percentage points. Seattle showed the third-largest slowdown, down by 3 percentage points, followed by Las Vegas, which was down by 2.8 percentage points since October. Washington, Boston and Detroit saw the smallest declines in year-over-year gains compared with October.
Figure 3: Deceleration in Year-Over-Year Home Price Growth Seen in All 20 Metros
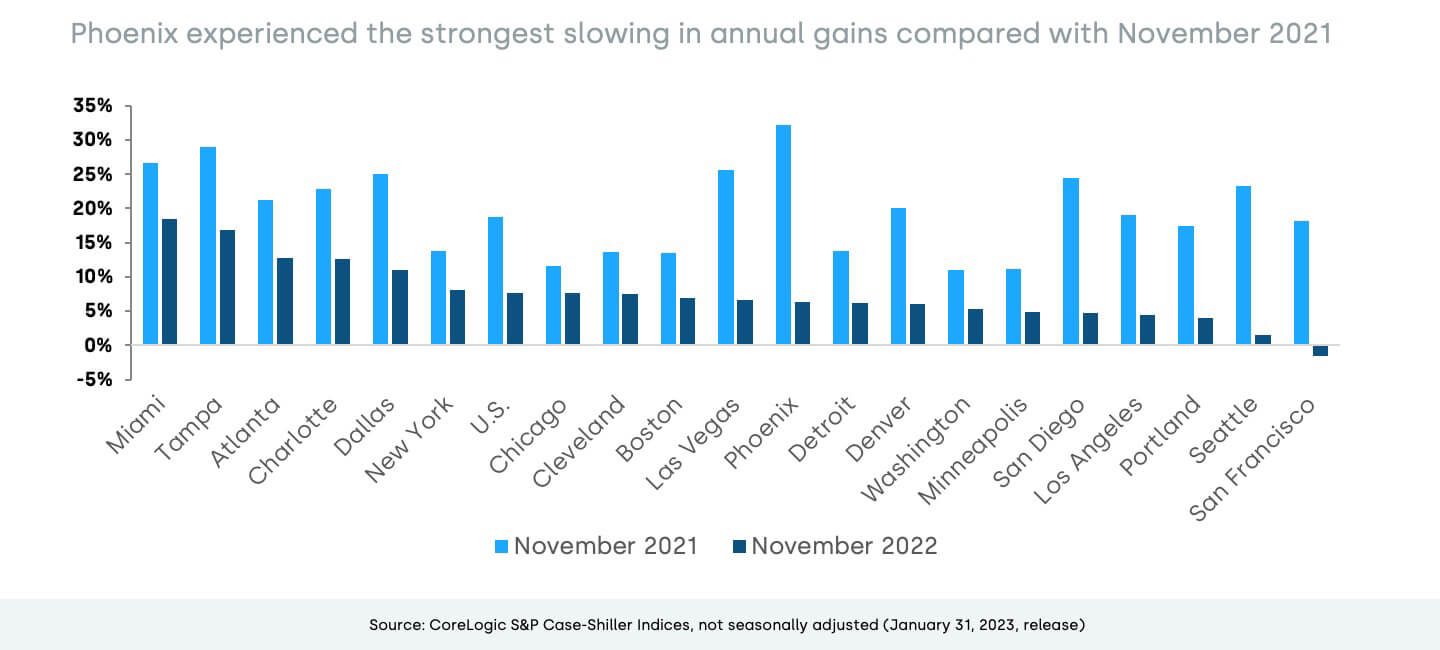
Compared with annual gains recorded last November, all metros posted weaker price gains, averaging a 12-percentage point slower rate of appreciation. Phoenix showed the largest decline in home price growth compared with November 2021, cooling by 26 percentage points. Seattle followed, with a 22-percentage point decrease (Figure 4).
Figure 4: Year-Over-Year Home Price Growth Lower in All 20 Metros
Furthermore, slowing price growth is evident across all price tiers. The low tier was up by 8% in November, while middle-tier growth was 6.4% and the high tier rose by 7.2%. The high tier showed the largest deceleration in annual gains compared with the spring 2022 peak, down by 3.1 percentage points, while low-tier growth once again increased at the fastest pace.
From November 2021 through July 2022, high-tier price growth outpaced low-tier gains, as demand for more expensive properties persisted. At this point, the continued relatively smaller price deceleration in the low tier could reflect pressure from multiple parties, including investors and owner-occupied buyers, as well as a stubbornly low inventory of homes for sale. The latest CoreLogic data suggests that investor activity remained steady at the end of 2022, averaging about 100,000 properties per month nationwide across investors of all sizes, while new listings continued to slow significantly.
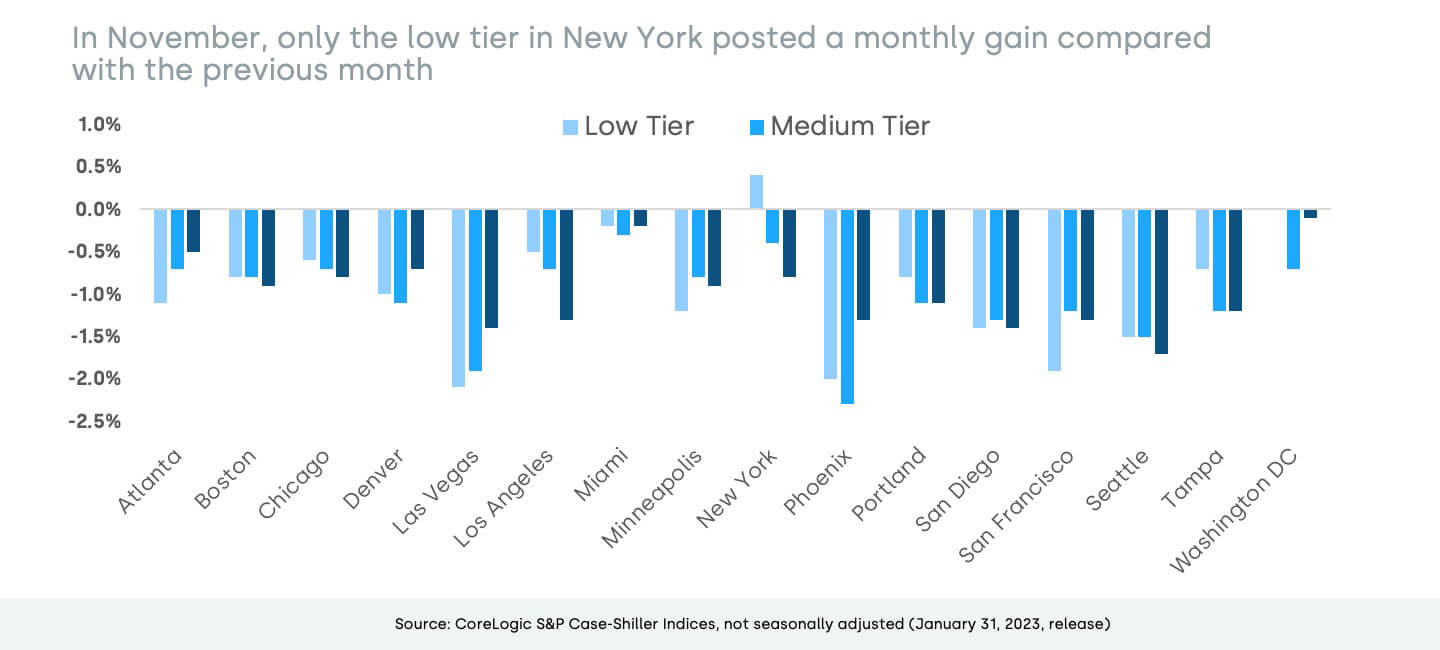
The month-over-month comparison of appreciation by price tier and location also reveals relative changes in demand across the country. From October to November, most price tiers across all metros showed declines in monthly gains, except for the low tier in New York, which was up slightly. In general, areas in Northeast and Midwest that fared relatively worse during the pandemic are seeing renewed buyer demand and relative resilience in home prices than pandemic boomtowns such as Phoenix. New York, in particular, was hard hit by the pandemic, and the relative strength in the lower tier there may reflect a rebound effect from weaker prices in 2021.
The average monthly price gain among low-tier homes was down by 1%, though that number is not seasonally adjusted. High-tier and middle-tier prices also declined by 1% month over month on average (Figure 5).
Figure 5: Monthly Price Declines Average -1.0% for Low, Medium and High Tiers
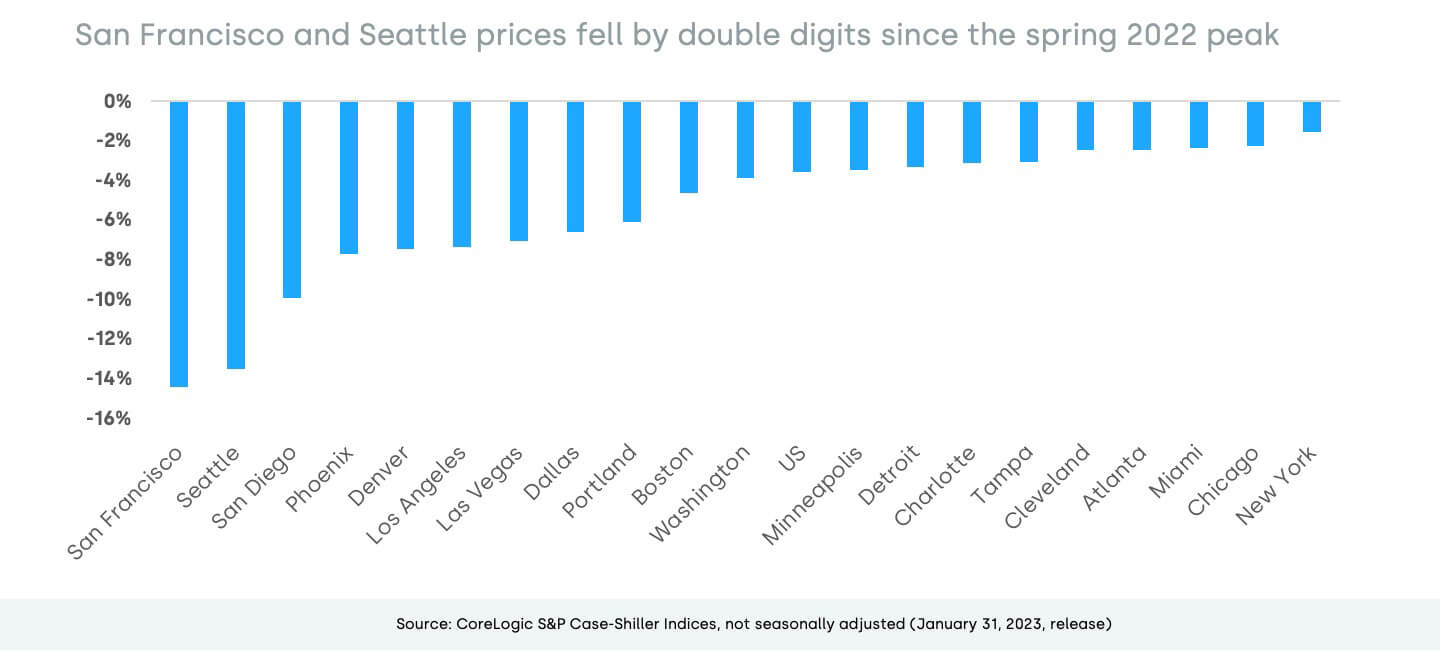
Finally, November home prices declined in all markets compared with their respective peak month in 2022. San Francisco and Seattle posted the largest declines — down by 14% and 13%, respectively. The smallest declines were seen in New York, Chicago and Miami, which were all down by about 2%. Overall, home prices dropped by 4% from the spring peak (Figure 6).
Figure 6: November Prices Down 4% From Earlier 2022 Peak
While the housing market deterioration turned increasingly negative as mortgage rates reached a 20-year high in November 2022, the new year has shown some early signs of optimism. With mortgage rates now trending lower and sparking some renewed buyer interest, mortgage applications and pending home sales suggest that the 2023 homebuying season may not prove as downbeat as many have forecasted. Nevertheless, mortgage rate movement going forward will play a major role in determining the path of the 2023 housing market.