Chat
Chat with Sales Hours: Monday-Friday 8:30 a.m. - 4:30 p.m. (CST)
Contact Sales
Call Sales Toll-Free 1-(866) 774-3282 Hours: Monday-Friday 7 a.m. - 5 p.m. (CST)
Product Login
Product Log-in
Product Support
Product Support
Email Sales
Contact Sales
After Hours
  • Support
  • Sign In Sign In
  • AUS NZ UK
CoreLogic - Home
  • Solutions
    view solutions by:

    Data Solutions

    • Lead Generation
    • Property Data
    • Location Intelligence

    Real Estate

    • Multiple Listing Enterprise
    • Agent & Broker

    Mortgage

    • Origination
    • Servicing
    • Appraisal
    • Commercial Property Tax

    Insurance

    • Hazard Risk
    • Catastrophe Risk Management
    • Risk Evaluation
    • Underwriting Automation
    • Weather
    • Claims Automation
    • Restoration
    • INTRCONNECT

    Mortgage Lenders

    • Origination

    Mortgage Servicers

    • Residential Property Tax
    • Default & Loss Mitigation
    • Portfolio Insight & Monitoring

    Mortgage Appraisers

    • Appraisal

    Real Estate Agents & Brokers

    • Agents & Brokers

    Real Estate MLS

    • Multiple Listing Enterprises

    Commercial Real Estate Owners

    • Commercial Property Tax

    Marketing Departments

    • Property Data

    Insurance Underwriters

    • Risk Evaluation
    • Underwriting Automation
    • Hazard Risk
    • Catastrophe Risk Management

    Insurance Risk Managers

    • Risk Evaluation
    • Hazard Risk
    • Catastrophe Risk Management

    Insurance Claims

    • Claims Automation
    • Restoration Contractors
    • Weather Verification

    Construction Contractors

    • Restoration Contractors

    General

    • Location Intelligence
    • Lead Generation
    • Data Solutions
  • Resources

    Reports

    • Climate Change
    • Construction Cost Update
    • Construction Insights
    • Home Price Insights
    • Homeowner Equity Insights
    • Loan Performance Insight
    • Mortgage Fraud
    • Property Tax Delinquency
    • Single-Family Rent Index

    Insight Blogs

    • Hazard HQ
    • Office of Chief Economist
    • Affordable Housing
    • Homebuying
    • Insurance
    • Other Articles

    More Resources

    • Events
    • Case Studies
    • White Papers
    • Podcasts
    • Quick Takes
  • Company
    • About
    • Leadership
    • Newsroom
    • Contact
    • Careers
  • Search
CoreLogic - Home
  • Solutions
  • Resources
  • Company

    • About
    • Leadership
    • Newsroom
    • Contact
    • Careers
  • Accounts

    • Products Sign-in
  • Contact

    • Sales Contact
    • Product Support
  • Regions

    • Australia
    • New Zealand
    • United Kingdom
  • Social

    • Facebook
    • Instagram
    • Linkedin
    • Twitter
    • Youtube
Solutions
VIEW BY:
  • Data Solutions

    • Lead Generation
    • Property Data
    • Location Intelligence
  • Real Estate

    • Multiple Listing Enterprise
    • Agent & Broker
  • Mortgage

    • Origination
    • Servicing
    • Appraisal
    • Commercial Property Tax
  • Insurance

    • Hazard Risk
    • Catastrophe Risk Management
    • Risk Evaluation
    • Underwriting Automation
    • Weather
    • Claims Automation
    • Restoration
    • INTRCONNECT
  • Mortgage Lenders

    • Origination
  • Mortgage Servicers

    • Residential Property Tax
    • Default & Loss Mitigation
    • Portfolio Insight & Monitoring
  • Mortgage Appraisers

    • Appraisal
  • Real Estate Agents & Brokers

    • Agents & Brokers
  • Real Estate MLS

    • Multiple Listing Enterprises
  • Commercial Real Estate Owners

    • Commercial Property Tax
  • Marketing Departments

    • Property Data
  • Insurance Underwriters

    • Risk Evaluation
    • Underwriting Automation
    • Hazard Risk
    • Catastrophe Risk Management
  • Insurance Risk Managers

    • Risk Evaluation
    • Hazard Risk
    • Catastrophe Risk Management
  • Insurance Claims

    • Claims Automation
    • Restoration Contractors
    • Weather Verification
  • Construction Contractors

    • Restoration Contractors
  • General

    • Location Intelligence
    • Lead Generation
    • Data Solutions
Resources
  • Reports

    • Climate Change
    • Construction Cost Update
    • Construction Insights
    • Home Price Insights
    • Homeowner Equity Insights
    • Loan Performance Insight
    • Mortgage Fraud
    • Property Tax Delinquency
    • Single-Family Rent Index
  • Insight Blogs

    • Hazard HQ
    • Office of Chief Economist
    • Affordable Housing
    • Homebuying
    • Insurance
    • Other Articles
  • More Resources

    • Events
    • Case Studies
    • White Papers
    • Podcasts
    • Quick Takes

Home / Intelligence / US S&P CoreLogic Case-Shiller Index Registers New High, Up 19.8% in February

ABOUT THE AUTHOR
Selma Hepp
Selma Hepp
Chief Economist
View Profile
  • April 26, 2022

US S&P CoreLogic Case-Shiller Index Registers New High, Up 19.8% in February

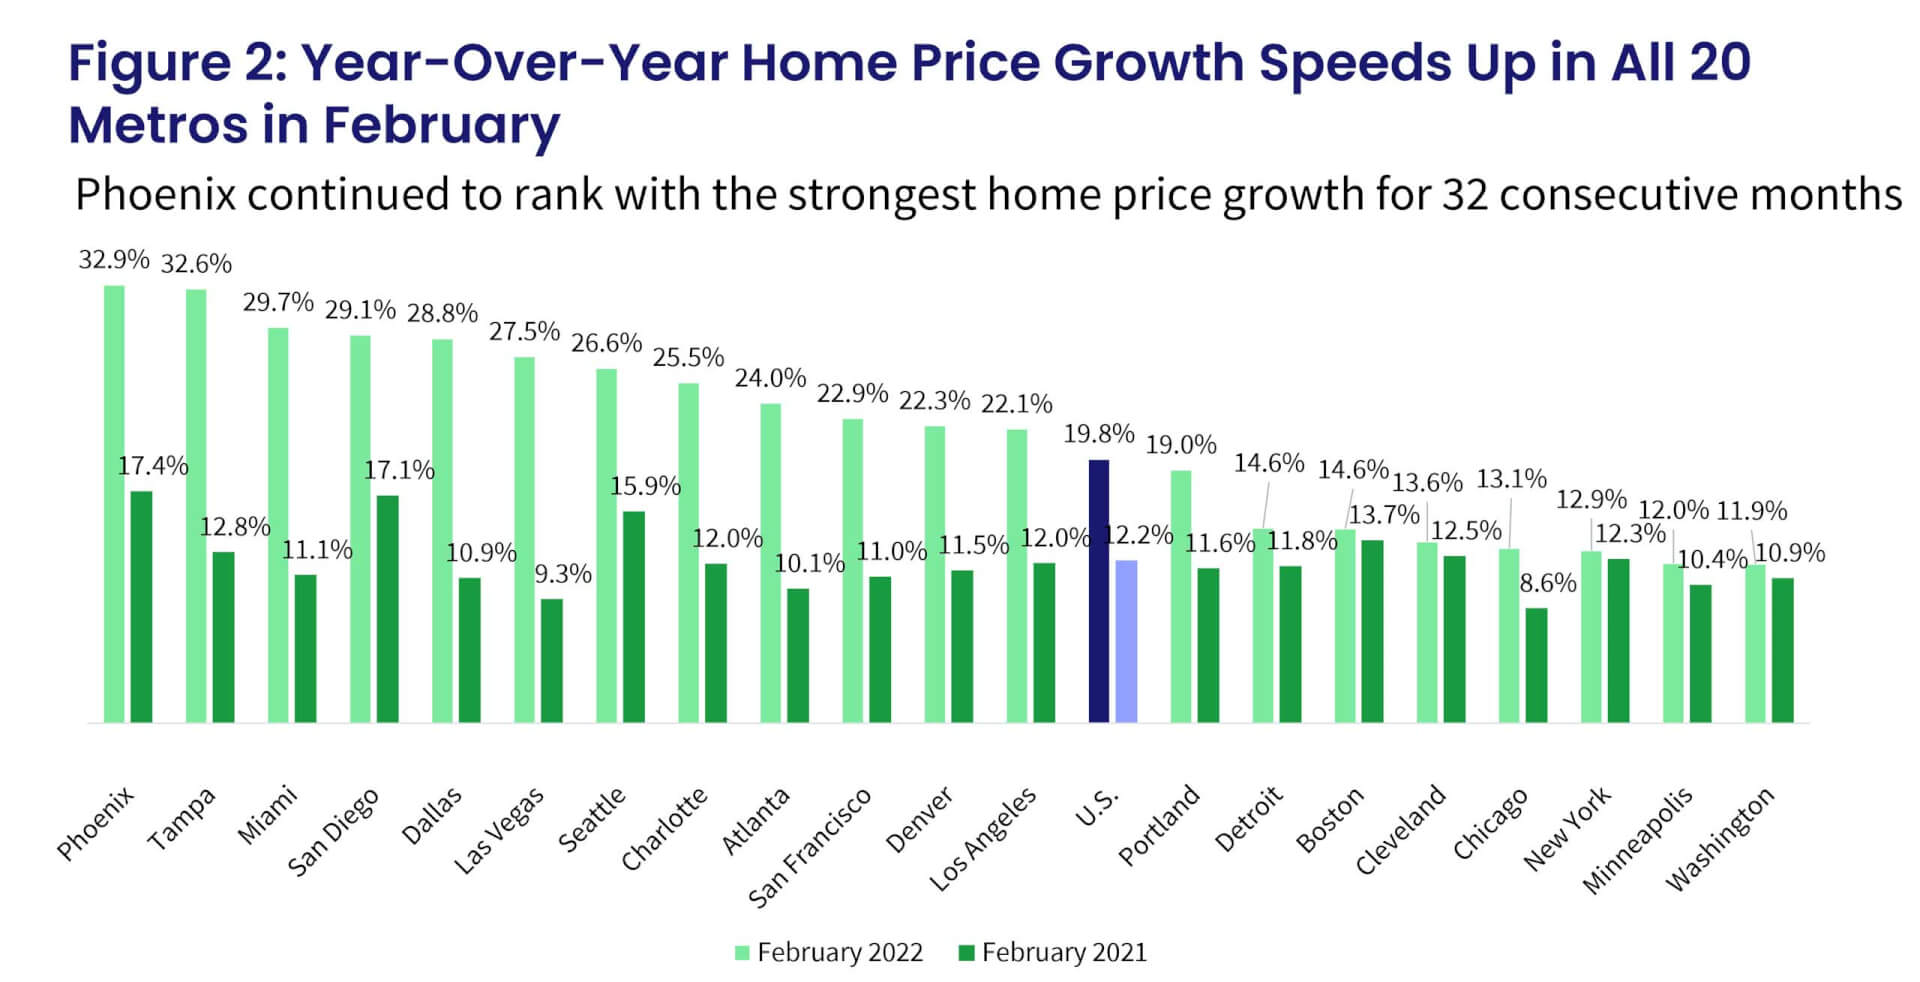
In February, all 20 metro areas showed stronger annual home price growth compared to January

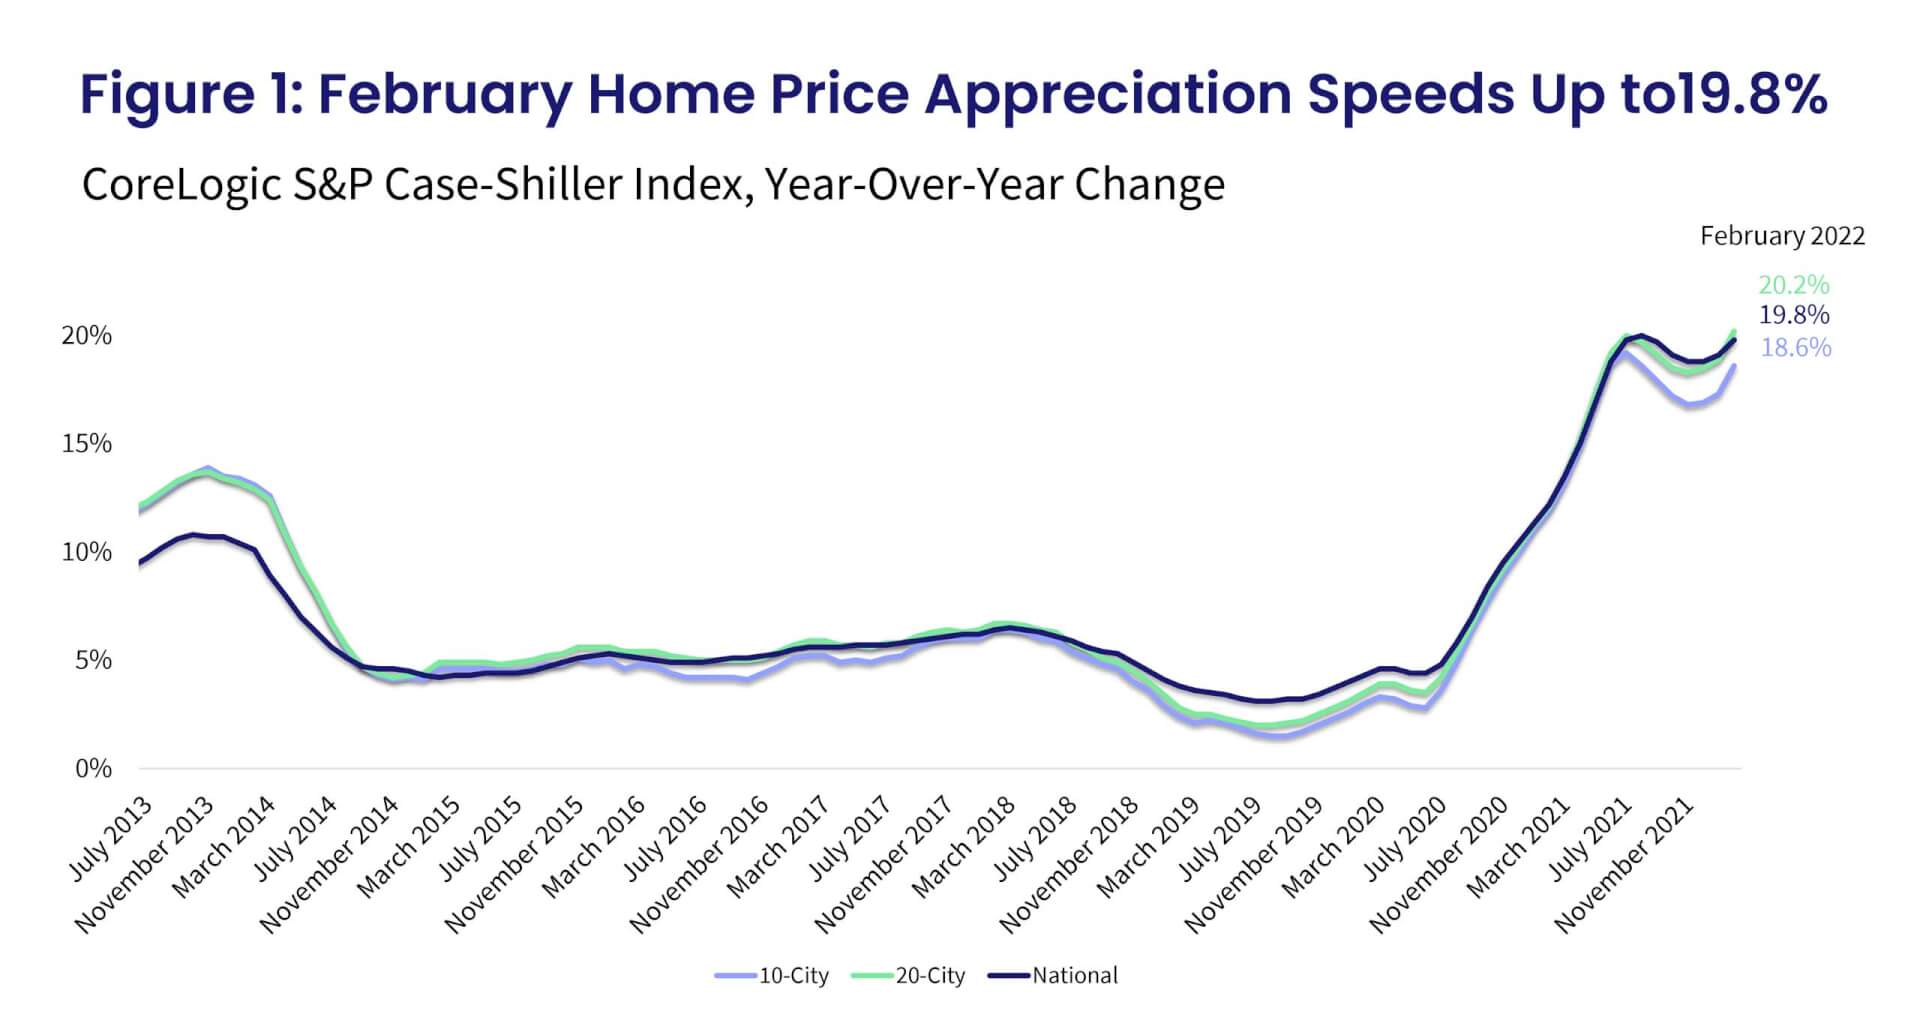
Home price growth continued to gain speed in early spring, as eager buyers tried to get in front of the mortgage rate surge. The S&P CoreLogic Case-Shiller Index posted a 19.8% increase in February, the second month of accelerated growth after a winter lull. This was the strongest February year-over-year increase since the beginning of the data series.

Concerns about higher mortgage rates propelled much of the spring homebuying demand, which was not, however, met with a comparable increase in new inventory. Continued pressure on home prices drove growth to new historic highs. Nevertheless, with mortgage rates rising above 5% in recent weeks and diminishing buying power, home price growth is likely to recede in coming months.

The non-seasonally adjusted month-to-month index also surged, up 1.73% — also the largest monthly increase in the data series. Between 2015 and 2020, the monthly index changes from January to February averaged about 0.24%.

The 10- and 20-city composite indexes also marched upward to new highs, surging 18.6% and 20.2% year over year, respectively (Figure 1). The gains remained higher in the 20-city index, as buyers with larger budgets continue to flock to smaller and more affordable areas, particularly those in Florida.

Compared to the 2006 peak, the 10-city composite is now 36% higher, while the 20-city composite is up 43%. Adjusted for inflation, which continues to remain elevated, the 10-city index is down 1%, while the 20-city index is up 5% compared to the 2006 peak.

Figure  1  February Home Price Appreciation Speeds Up to 19.8%
Source: S&P CoreLogic Case-Shiller Indices, not seasonally adjusted (April 26, 2022, release)
© 2022 CoreLogic,Inc., All rights reserved.

For the 32nd consecutive month, Phoenix had the strongest annual home price growth among the 20 tracked markets, surging 32.9% in February, up from January’s non-seasonally adjusted rate of 32.6%.

Tampa, Florida, still ranks second, with a 32.6% year-over-year gain, up from 29.4% the month before. Miami ranks third, with a 29.7% increase in February. While Tampa and Miami have been competing for the second-highest growing cities over the last year, February’s re-acceleration was strongest in West Coast markets such as Los Angeles, San Francisco, Seattle and San Diego, all of which posted about a 2 percentage-point increase in annual gains since January. Phoenix, on the other hand, had one of the slowest monthly gains in year-over-year growth — only 0.27-percentage points from January. Minneapolis, New York and Cleveland also posted some of the slowest increases in annual gains.

Nevertheless, all 20 metro areas experienced acceleration in annual gains from January.  

Washington and Minneapolis remained at the bottom of the year-over-year price growth list, up 11.9% and 12%, respectively. Despite having the slowest rate of annual price increases, these areas have still experienced double-digit growth rates for 15 consecutive months. (Figure 2).

Figure 2  :  Year-Over-Year Price Growth Speeds Up in All 20 Metros in February
Source: S&P CoreLogic Case-Shiller Indices, not seasonally adjusted (April 26, 2022, release)
© 2022 CoreLogic,Inc., All rights reserved.

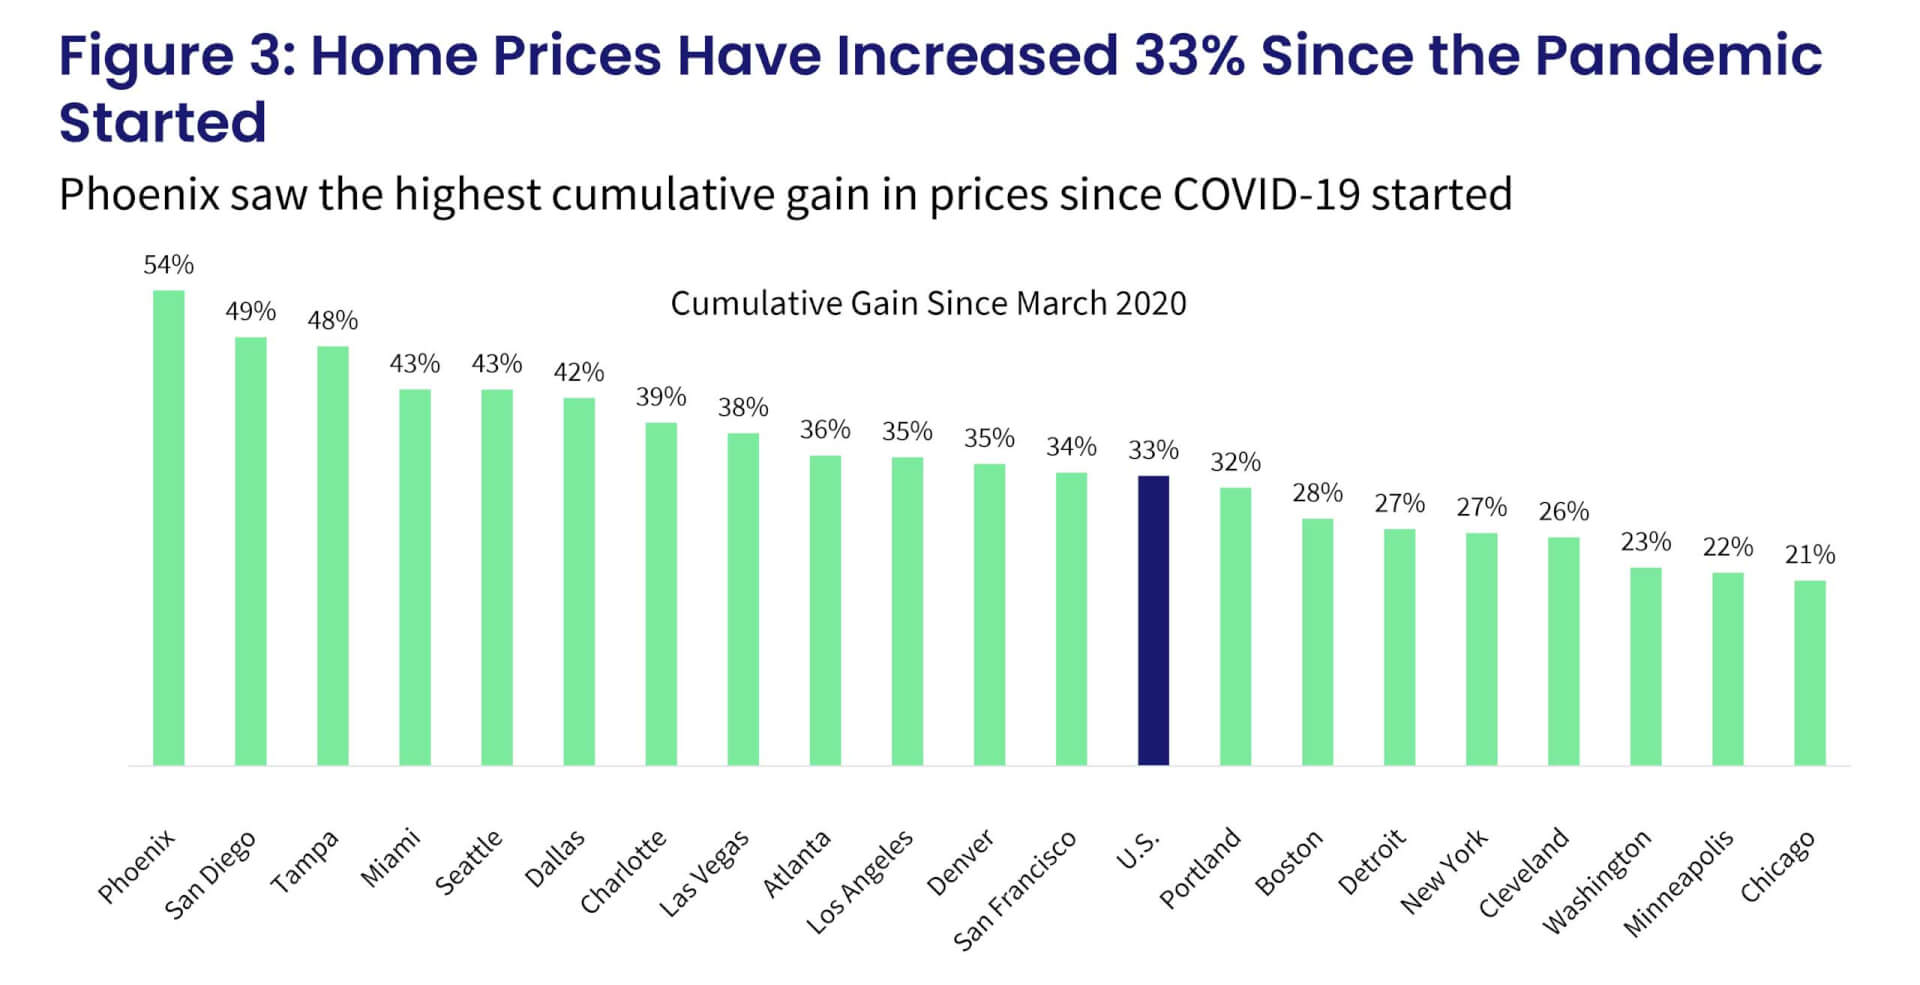
Cumulatively, home prices are up 33% since March 2020 when the pandemic started. Given the strength in the Phoenix market for the past 32 months, which started prior to the COVID-19 outbreak, prices are now up 54% compared to March 2020, the highest among the 20 metro areas tracked. San Diego follows with a 49% cumulative gain. In contrast, but in line with year-over-year trends observed in previous releases, Chicago, Minneapolis and Washington have had cumulative increases amounting to about 21% to 23% (Figure 3).

Figure 3 :  Home Prices  Have Increase 33% Since the Pandemic Started
Source: S&P CoreLogic Case-Shiller Indices, not seasonally adjusted (April 26, 2022, release)
© 2022 CoreLogic,Inc., All rights reserved.

Furthermore, all three price tiers also continued to see stronger annual gains in February, with the high tier showing most of the acceleration, up 23% in February from 21.3% in January. The average growth in gains for low-tier homes lagged but was still up by 20.6%. The slowing price growth in the low tier reflects affordability challenges that home shoppers in this price range face after almost two years of vigorous price gains and an increase in mortgage rates — in addition to low inventory.    

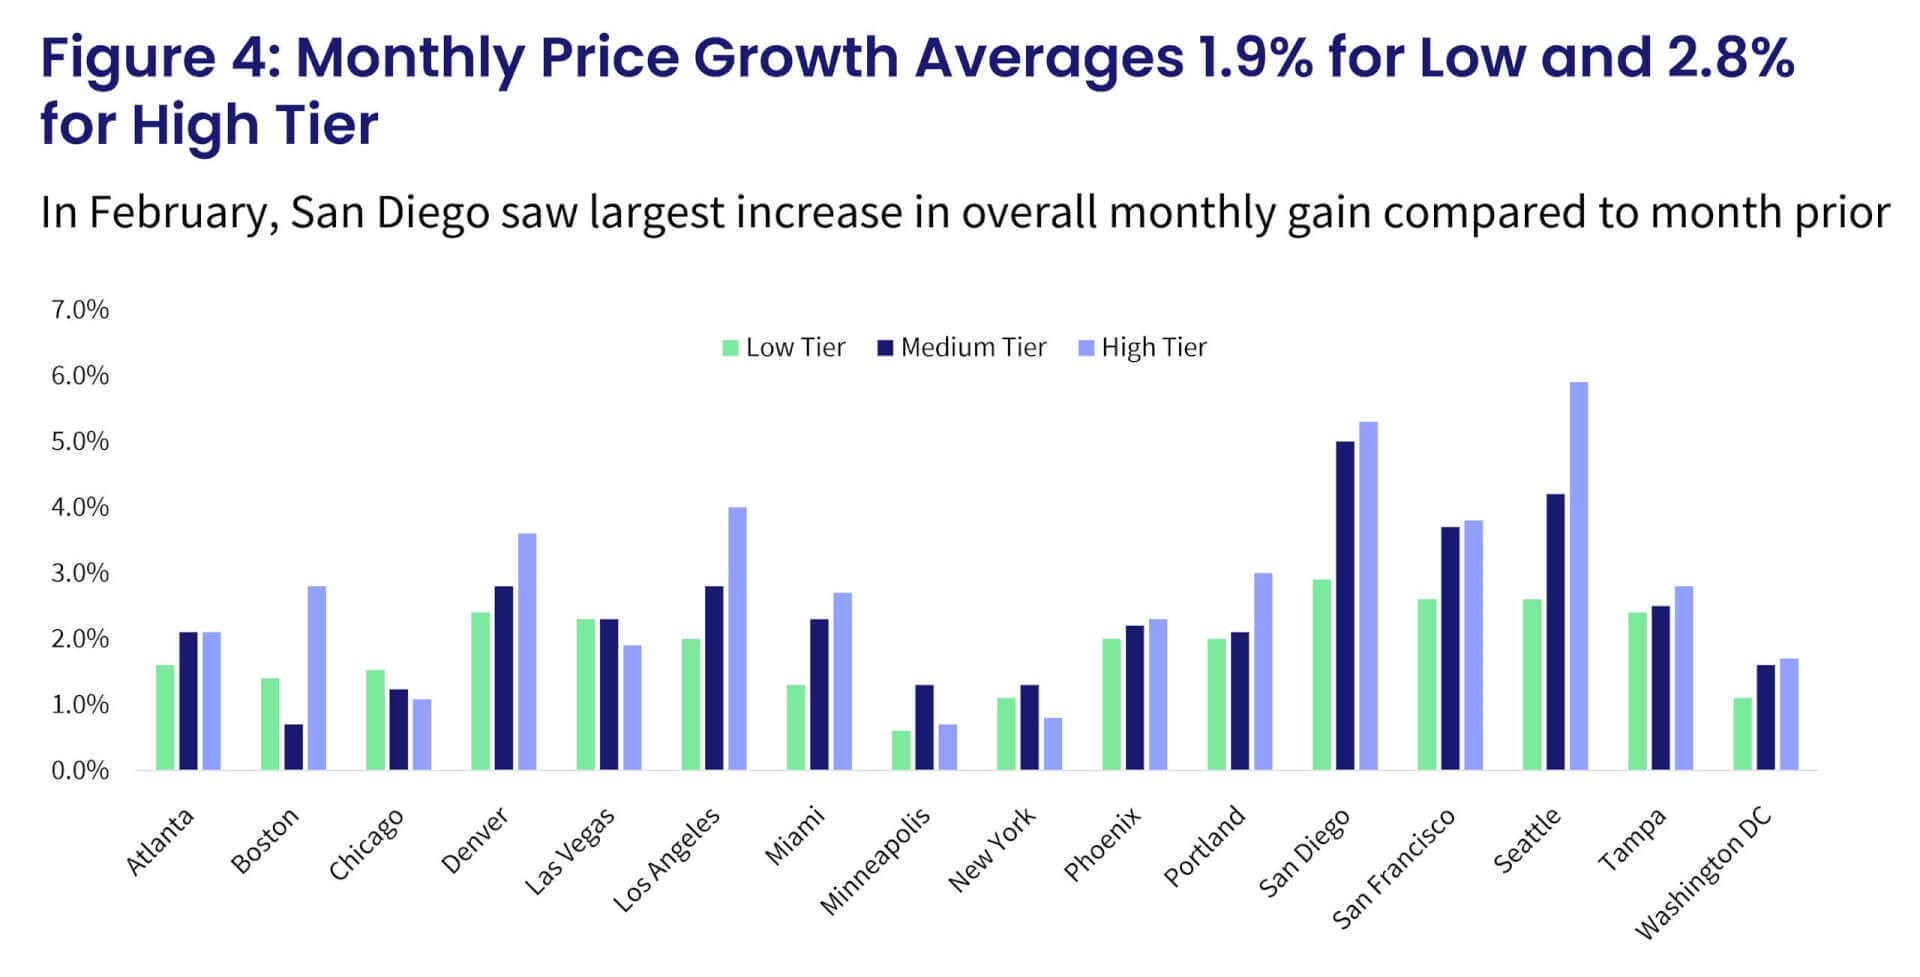
Furthermore, the month-to-month comparison of home price growth by price tier and location reveals relative changes in demand across the country. From January to February, areas with colder climates, particularly Minneapolis, New York and Chicago, continued to show smaller monthly increases. For the third consecutive month, all metros had at least some gains across the price tiers — although some of the growth can be attributed to seasonal patterns, since monthly increases are generally positive between January and February.

The largest monthly gains were in warmer areas and on the West Coast, including San Diego, Seattle and San Francisco, which were all up notably in February. San Diego and San Francisco have regained some excitement from buyers after a few months of slower gains — particularly among higher-priced homes — with monthly increases up by more than 5% from the month before.

The average monthly gains among low-tier homes accelerated in February, up 1.9%, though, again, that number is not seasonally adjusted. The high-tier monthly gains averaged 2.8% in February. The middle-tier monthly price increases averaged 2.4% (Figure 4).

Figure 4: Monthly Price Growth Averages 1.9% for Low and 2.8% for High Tier
Source: S&P CoreLogic Case-Shiller Indices, not seasonally adjusted (April 26, 2022, release)
© 2022 CoreLogic,Inc., All rights reserved.

With home price growth rising again and mortgage rates largely above the 5% psychological threshold, monthly expenses for most potential homebuyers are now much higher, up about 30% from a year ago. Nevertheless, demand for homes remains relatively high — or at least higher than before 2021. These buyers likely locked in more favorable mortgage rates in the early months of this year. However, the significant increase in rates seen since mid-March will be reflected in dampened demand going forward and in home sales numbers published in the early summer. As a result, overall home sales in 2022 could be lower than 2021, a reversal of previous forecasts, which called for higher home sales in 2022.

Nevertheless, it is interesting to note the strength in high-tier price segments, where buyer demand and purchasing power is less affected by changes in mortgage rates. The surge in monthly gains in markets such as Seattle, San Diego and San Francisco may reflect the focus on real estate investment as a hedge against inflation.

© 2022 CoreLogic,Inc., All rights reserved.
  • Category: Home Price Insights, Intelligence, Reports
  • Tags: Case Shiller Index
ABOUT THE AUTHOR
Selma Hepp
Selma Hepp
Chief Economist
View Profile

Related Posts

CSI_Promo_Mar2023
Blogs

US CoreLogic S&P Case-Shiller Index Gain Slows to Pre-Pandemic Low, Up by 3.8% Year Over Year in January

The index continued to decline year over year in January, again posting a single-digit gain.

March 28, 2023
Tornado footprints in Southern California captured by CoreLogic's weather verification technology as viewed in CoreLogic Reactor™.
Blogs

A Rare Los Angeles Tornado and Near Hurricane-Force Winds in San Francisco

CoreLogic Weather Verification Services captured wind and tornado footprints from the severe weather system in California.

March 24, 2023
atmospheric rivers california
Core Conversations

What Was it Really Like to Live Through the California Floods? Our Team Spills

A Conversation With Kent David and Tom Larsen Since the beginning of the year, California has been drenched by atmospheric rivers. The flooding in California

March 22, 2023

About Corelogic

  • Newsroom
  • Leadership
  • Careers
  • Ethics & Compliance

Accounts

  • Products Sign-in

Contact

  • Sales Contact
  • Product Support

Regions

  • CoreLogic Australia
  • CoreLogic New Zealand
  • CoreLogic UK

Follow & Connect

  • Facebook
  • Instagram
  • Linkedin
  • Twitter
  • YouTube
© 2023 CoreLogic. All rights reserved.
  • Legal
  • Privacy Policy
  • CCPA
  • Cookie Preferences
  • Security
  • Sitemap
  • Accessibility
  • Legal
  • Privacy Policy
  • CCPA
  • Cookie Preferences
  • Security
  • Sitemap
  • Accessibility