Chat
Chat with Sales Hours: Monday-Friday 8:30 a.m. - 4:30 p.m. (CST)
Contact Sales
Call Sales Toll-Free 1-(866) 774-3282 Hours: Monday-Friday 7 a.m. - 5 p.m. (CST)
Product Login
Product Log-in
Product Support
Product Support
Email Sales
Contact Sales
After Hours
  • Support
  • Sign In Sign In
  • AUS NZ UK
CoreLogic - Home
  • Solutions
    view solutions by:

    Data Solutions

    • Lead Generation
    • Property Data
    • Location Intelligence

    Real Estate

    • Multiple Listing Enterprise
    • Agent & Broker

    Mortgage

    • Origination
    • Servicing
    • Appraisal
    • Commercial Property Tax

    Insurance

    • Hazard Risk
    • Catastrophe Risk Management
    • Risk Evaluation
    • Underwriting Automation
    • Weather
    • Claims Automation
    • Restoration
    • INTRCONNECT

    Mortgage Lenders

    • Origination

    Mortgage Servicers

    • Residential Property Tax
    • Default & Loss Mitigation
    • Portfolio Insight & Monitoring

    Mortgage Appraisers

    • Appraisal

    Real Estate Agents & Brokers

    • Agents & Brokers

    Real Estate MLS

    • Multiple Listing Enterprises

    Commercial Real Estate Owners

    • Commercial Property Tax

    Marketing Departments

    • Property Data

    Insurance Underwriters

    • Risk Evaluation
    • Underwriting Automation
    • Hazard Risk
    • Catastrophe Risk Management

    Insurance Risk Managers

    • Risk Evaluation
    • Hazard Risk
    • Catastrophe Risk Management

    Insurance Claims

    • Claims Automation
    • Restoration Contractors
    • Weather Verification

    Construction Contractors

    • Restoration Contractors

    General

    • Location Intelligence
    • Lead Generation
    • Data Solutions
  • Resources

    Reports

    • Climate Change
    • Construction Cost Update
    • Construction Insights
    • Home Price Insights
    • Homeowner Equity Insights
    • Loan Performance Insight
    • Mortgage Fraud
    • Property Tax Delinquency
    • Single-Family Rent Index

    Insight Blogs

    • Hazard HQ
    • Office of Chief Economist
    • Affordable Housing
    • Homebuying
    • Insurance
    • Other Articles

    More Resources

    • Events
    • Case Studies
    • White Papers
    • Podcasts
    • Quick Takes
  • Company
    • About
    • Leadership
    • Newsroom
    • Contact
    • Careers
  • Search
CoreLogic - Home
  • Solutions
  • Resources
  • Company

    • About
    • Leadership
    • Newsroom
    • Contact
    • Careers
  • Accounts

    • Products Sign-in
  • Contact

    • Sales Contact
    • Product Support
  • Regions

    • Australia
    • New Zealand
    • United Kingdom
  • Social

    • Facebook
    • Instagram
    • Linkedin
    • Twitter
    • Youtube
Solutions
VIEW BY:
  • Data Solutions

    • Lead Generation
    • Property Data
    • Location Intelligence
  • Real Estate

    • Multiple Listing Enterprise
    • Agent & Broker
  • Mortgage

    • Origination
    • Servicing
    • Appraisal
    • Commercial Property Tax
  • Insurance

    • Hazard Risk
    • Catastrophe Risk Management
    • Risk Evaluation
    • Underwriting Automation
    • Weather
    • Claims Automation
    • Restoration
    • INTRCONNECT
  • Mortgage Lenders

    • Origination
  • Mortgage Servicers

    • Residential Property Tax
    • Default & Loss Mitigation
    • Portfolio Insight & Monitoring
  • Mortgage Appraisers

    • Appraisal
  • Real Estate Agents & Brokers

    • Agents & Brokers
  • Real Estate MLS

    • Multiple Listing Enterprises
  • Commercial Real Estate Owners

    • Commercial Property Tax
  • Marketing Departments

    • Property Data
  • Insurance Underwriters

    • Risk Evaluation
    • Underwriting Automation
    • Hazard Risk
    • Catastrophe Risk Management
  • Insurance Risk Managers

    • Risk Evaluation
    • Hazard Risk
    • Catastrophe Risk Management
  • Insurance Claims

    • Claims Automation
    • Restoration Contractors
    • Weather Verification
  • Construction Contractors

    • Restoration Contractors
  • General

    • Location Intelligence
    • Lead Generation
    • Data Solutions
Resources
  • Reports

    • Climate Change
    • Construction Cost Update
    • Construction Insights
    • Home Price Insights
    • Homeowner Equity Insights
    • Loan Performance Insight
    • Mortgage Fraud
    • Property Tax Delinquency
    • Single-Family Rent Index
  • Insight Blogs

    • Hazard HQ
    • Office of Chief Economist
    • Affordable Housing
    • Homebuying
    • Insurance
    • Other Articles
  • More Resources

    • Events
    • Case Studies
    • White Papers
    • Podcasts
    • Quick Takes

Home / Intelligence / US S&P CoreLogic Case-Shiller Index Turns the Corner: Up 19.5% in September, Down From 19.8% Annual Gain the Prior Month

ABOUT THE AUTHOR
Selma Hepp
Selma Hepp
Chief Economist
View Profile
  • November 30, 2021

US S&P CoreLogic Case-Shiller Index Turns the Corner: Up 19.5% in September, Down From 19.8% Annual Gain the Prior Month

Four metros, largely in warm climates, continue to experience acceleration in annual gains

While housing market activity is experiencing a typical seasonal slowdown, home buyer demand remains strong and continues to push total home purchases above pre-pandemic levels. This has led to another month of close to 20% annual gains in home prices and home sales exceeding that of pre-pandemic months.  

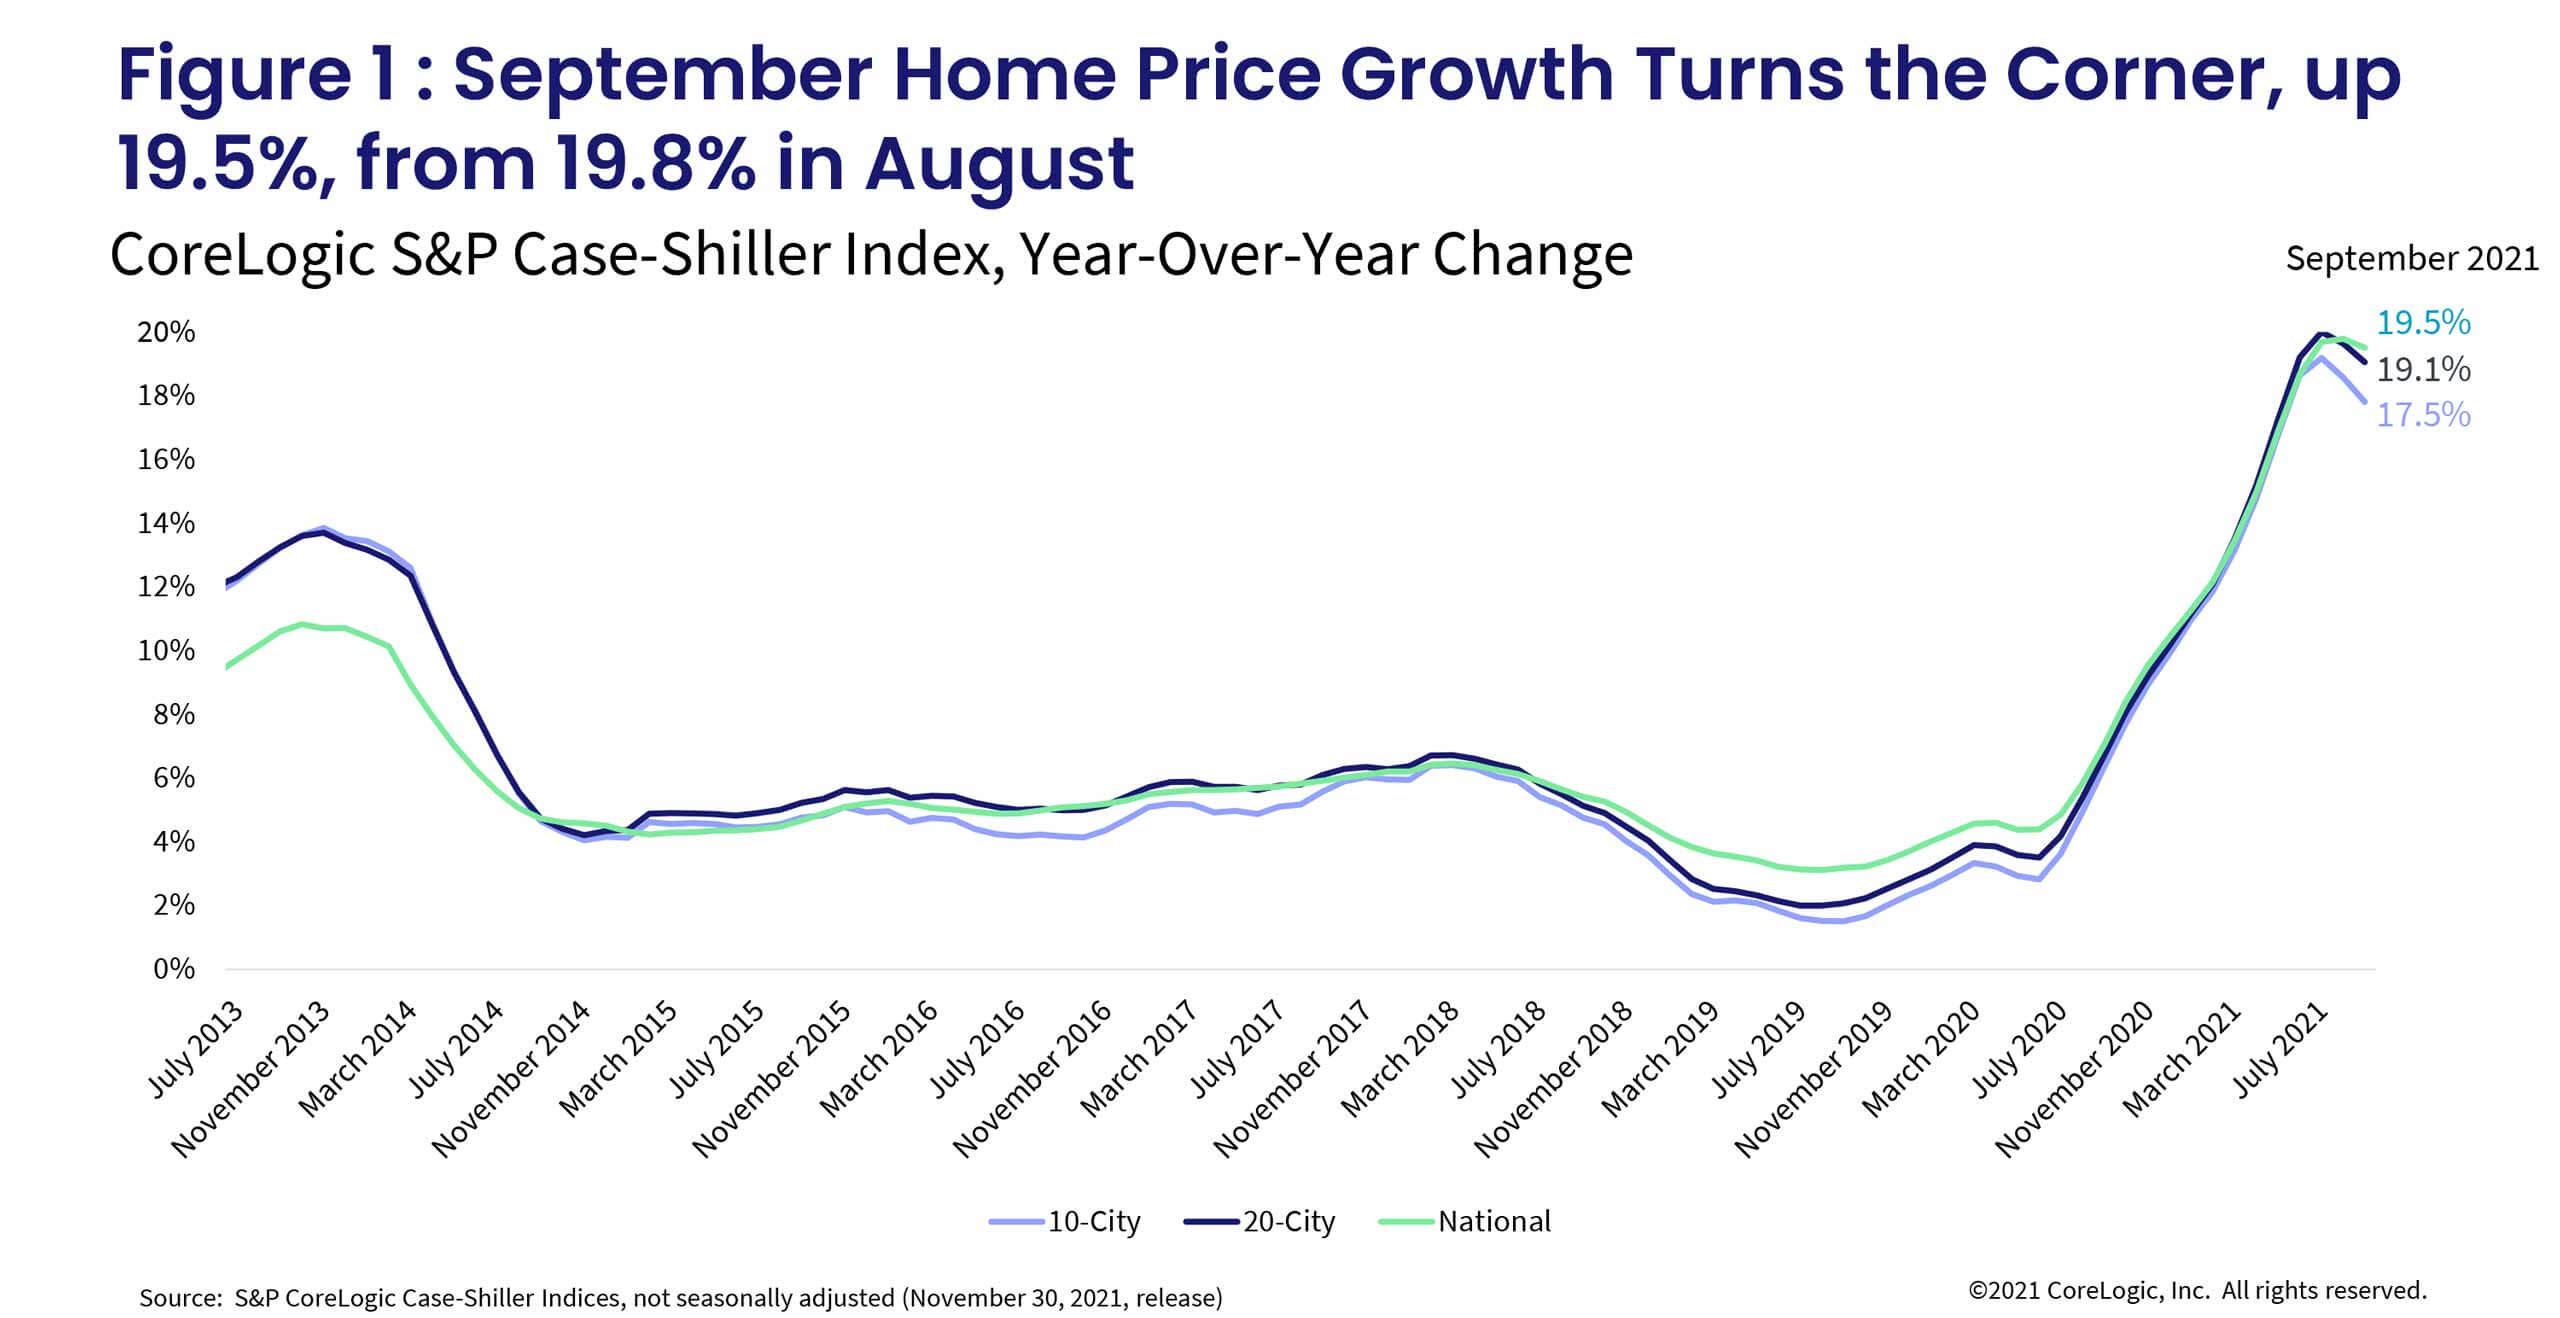
Nevertheless, the latest S&P CoreLogic Case-Shiller finally slowed after 14 consecutive months of accelerating and was up 19.5% year over year, down from the 19.8% increase the month prior. The month-to-month index also slowed to a non-seasonally adjusted 0.99%, down from a 1.21% increase in August.

While the monthly gains have slowed, they are still notably above the 2006-2019 average of 0.35% decline, suggesting that the September increase is still beating the seasonal decline typically seen in September.

The September S&P CoreLogic Case-Shiller release is in line with August’s seasonally adjusted S&P CoreLogic Case-Shiller release, which suggested the rate of monthly home price acceleration had slowed since the summer peak when it reached 1.83% in May and June to a 1.5% gain in August. Between January 2015 and January 2020, seasonally adjusted monthly gains averaged 0.4% but have surged since the onset of the pandemic. As monthly gains continue to decelerate, so too will the rate of annual home price appreciation, leading to a more balanced relationship between buyers and sellers. This is already evident in the share of homes that are selling over the asking price, which has declined from the summer peaks.

Acceleration of the 10- and 20-city composite indexes also continued to slow from July peak gains, and were up 17.8% and 19.1% year over year, respectively. In July, the indexes recorded gains of 19.2% and 20%, respectively (Figure 1). Robust demand in smaller, warmer and more affordable areas is reflected in continued stronger gains in the 20-city index.

Compared to the 2006 peak, the 10-city composite is now 28% higher, while the 20-city composite is 34% higher. Adjusted for inflation, the 10-city index is down 3%, while the 20-city index is up 2% compared to the 2006 peak.  

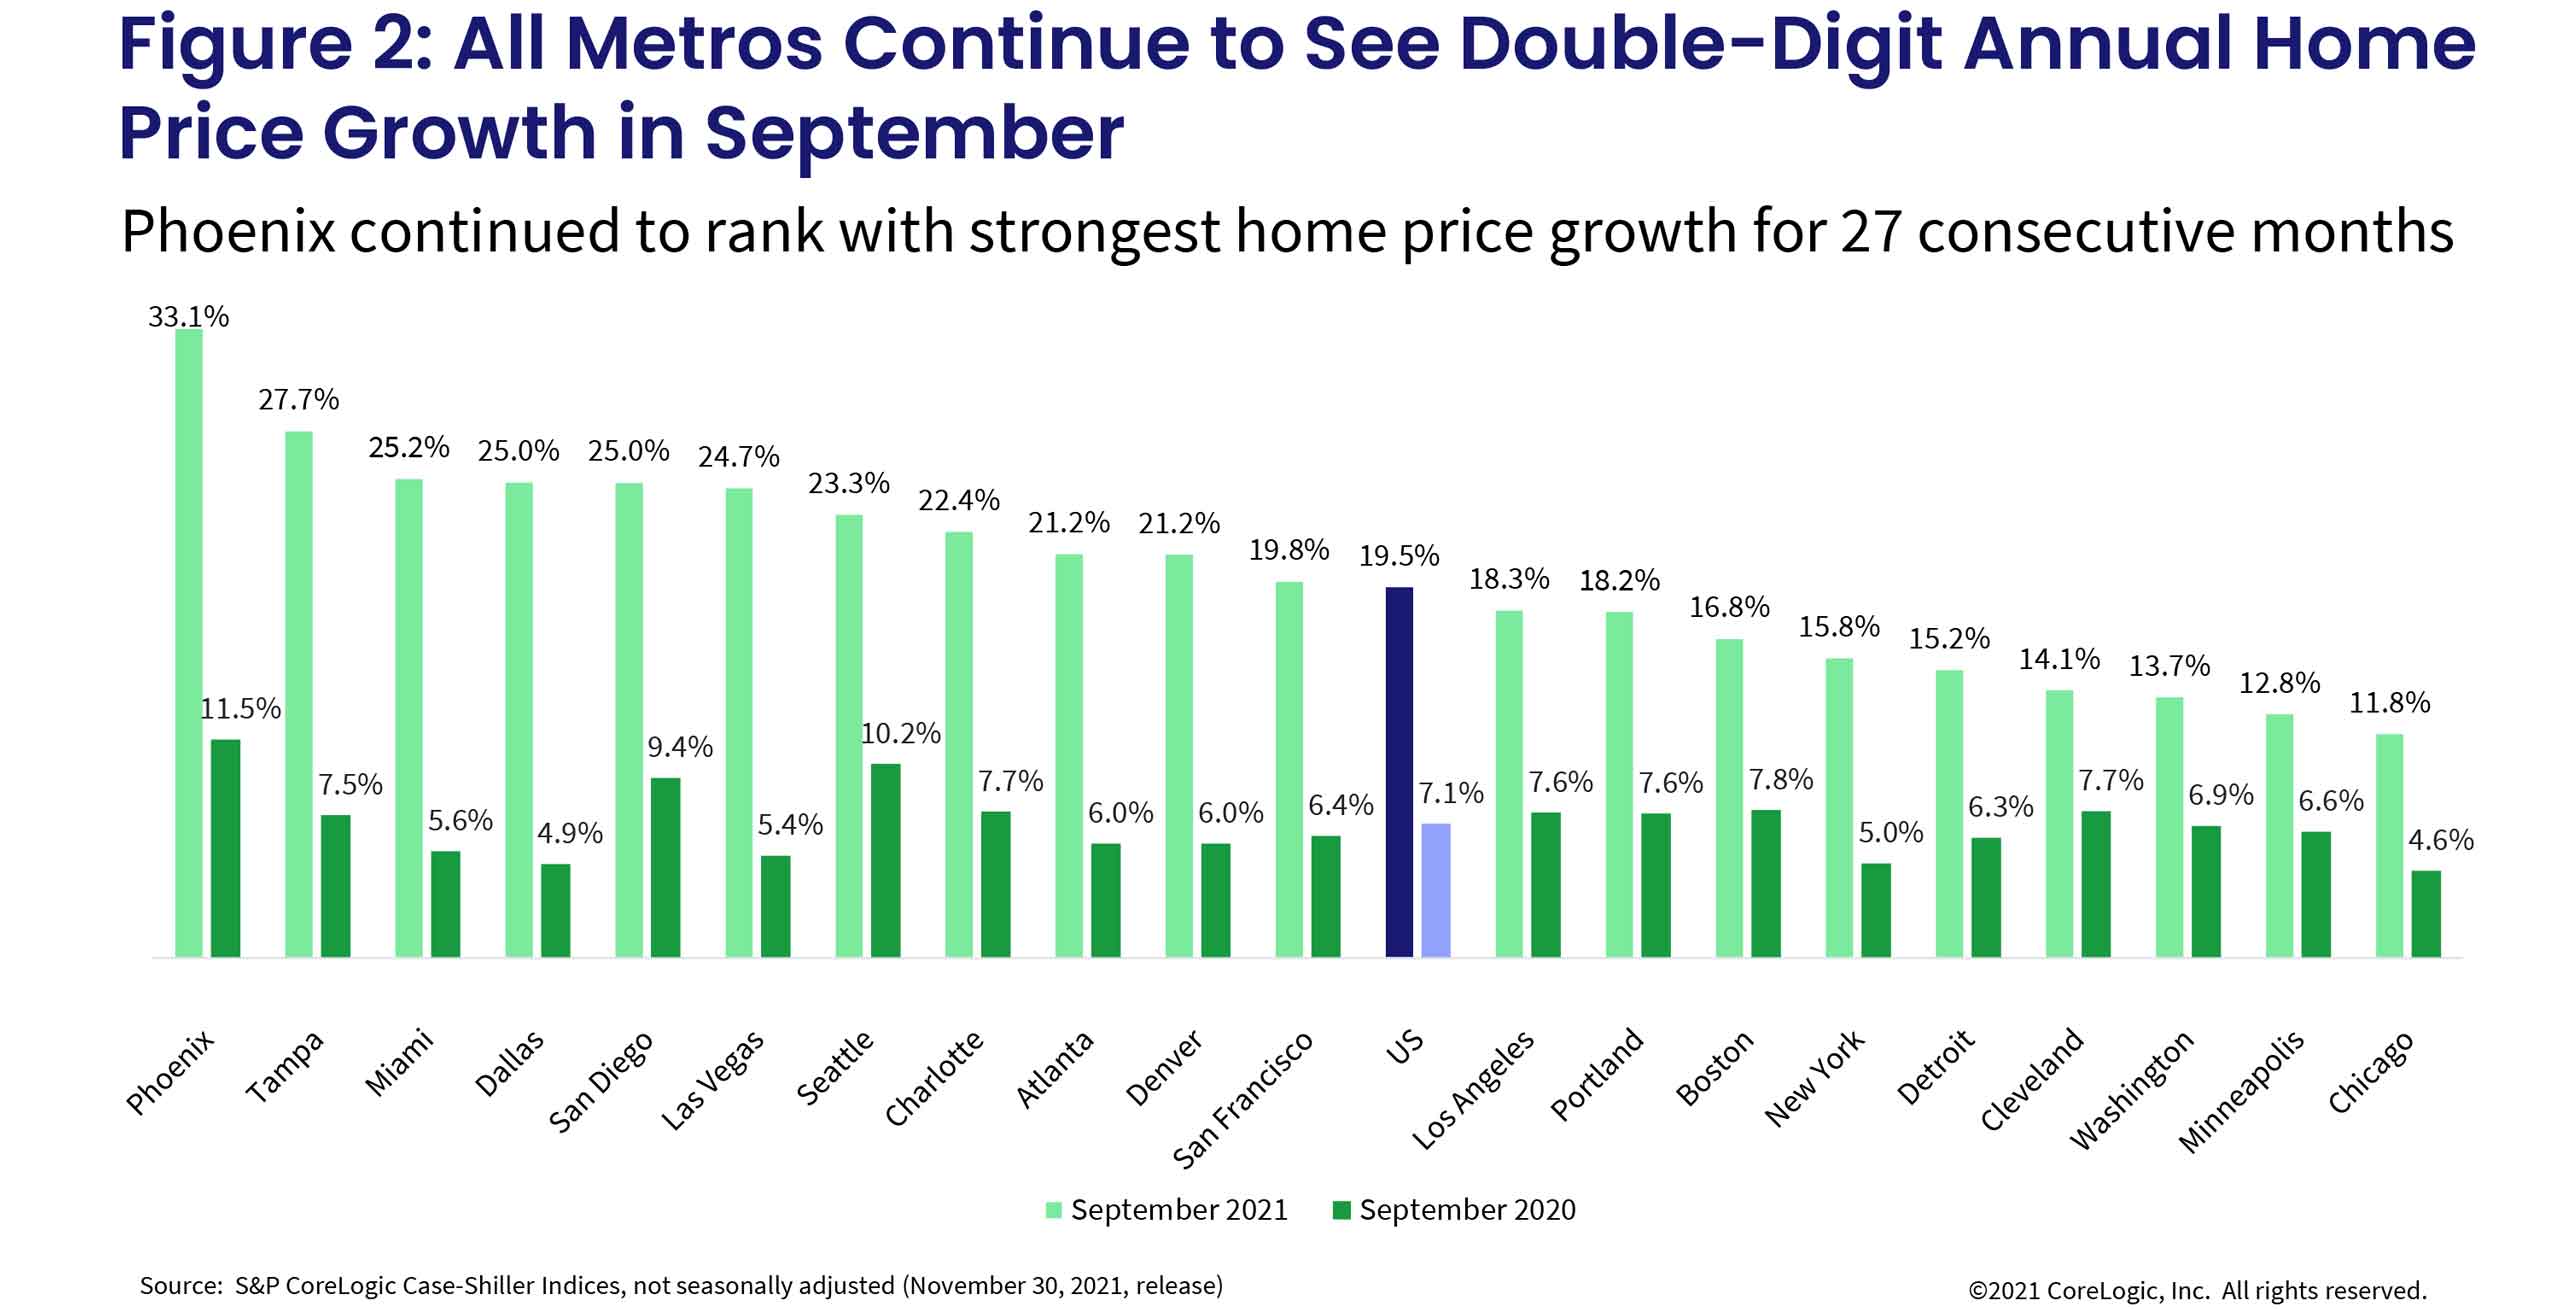
For the 27th consecutive month, Phoenix had the strongest home price growth among the 20 markets, surging 33.1% in September, but is down from August’s non-seasonally adjusted rate of 33.3%. Home price growth in San Diego, which has been trending near the top of the 20-city list since the onset of the pandemic, slowed to a 25% annual increase, bumping it down to the 5th place for strongest home price growth.

Tampa, Florida, ranks 3rd with a 27.7% gain, while Miami ranks 4th with a 25.2% increase in September. Both cities have experienced acceleration in annual gains from August.

Chicago and Minneapolis continued to lag, up 11.8% and 12.8%, respectively. Though both cities are experiencing double-digit price growth, the growth rate has slowed in September. Fourteen out of 20 cities are experiencing a slowdown in year-over-year gains (Figure 2).

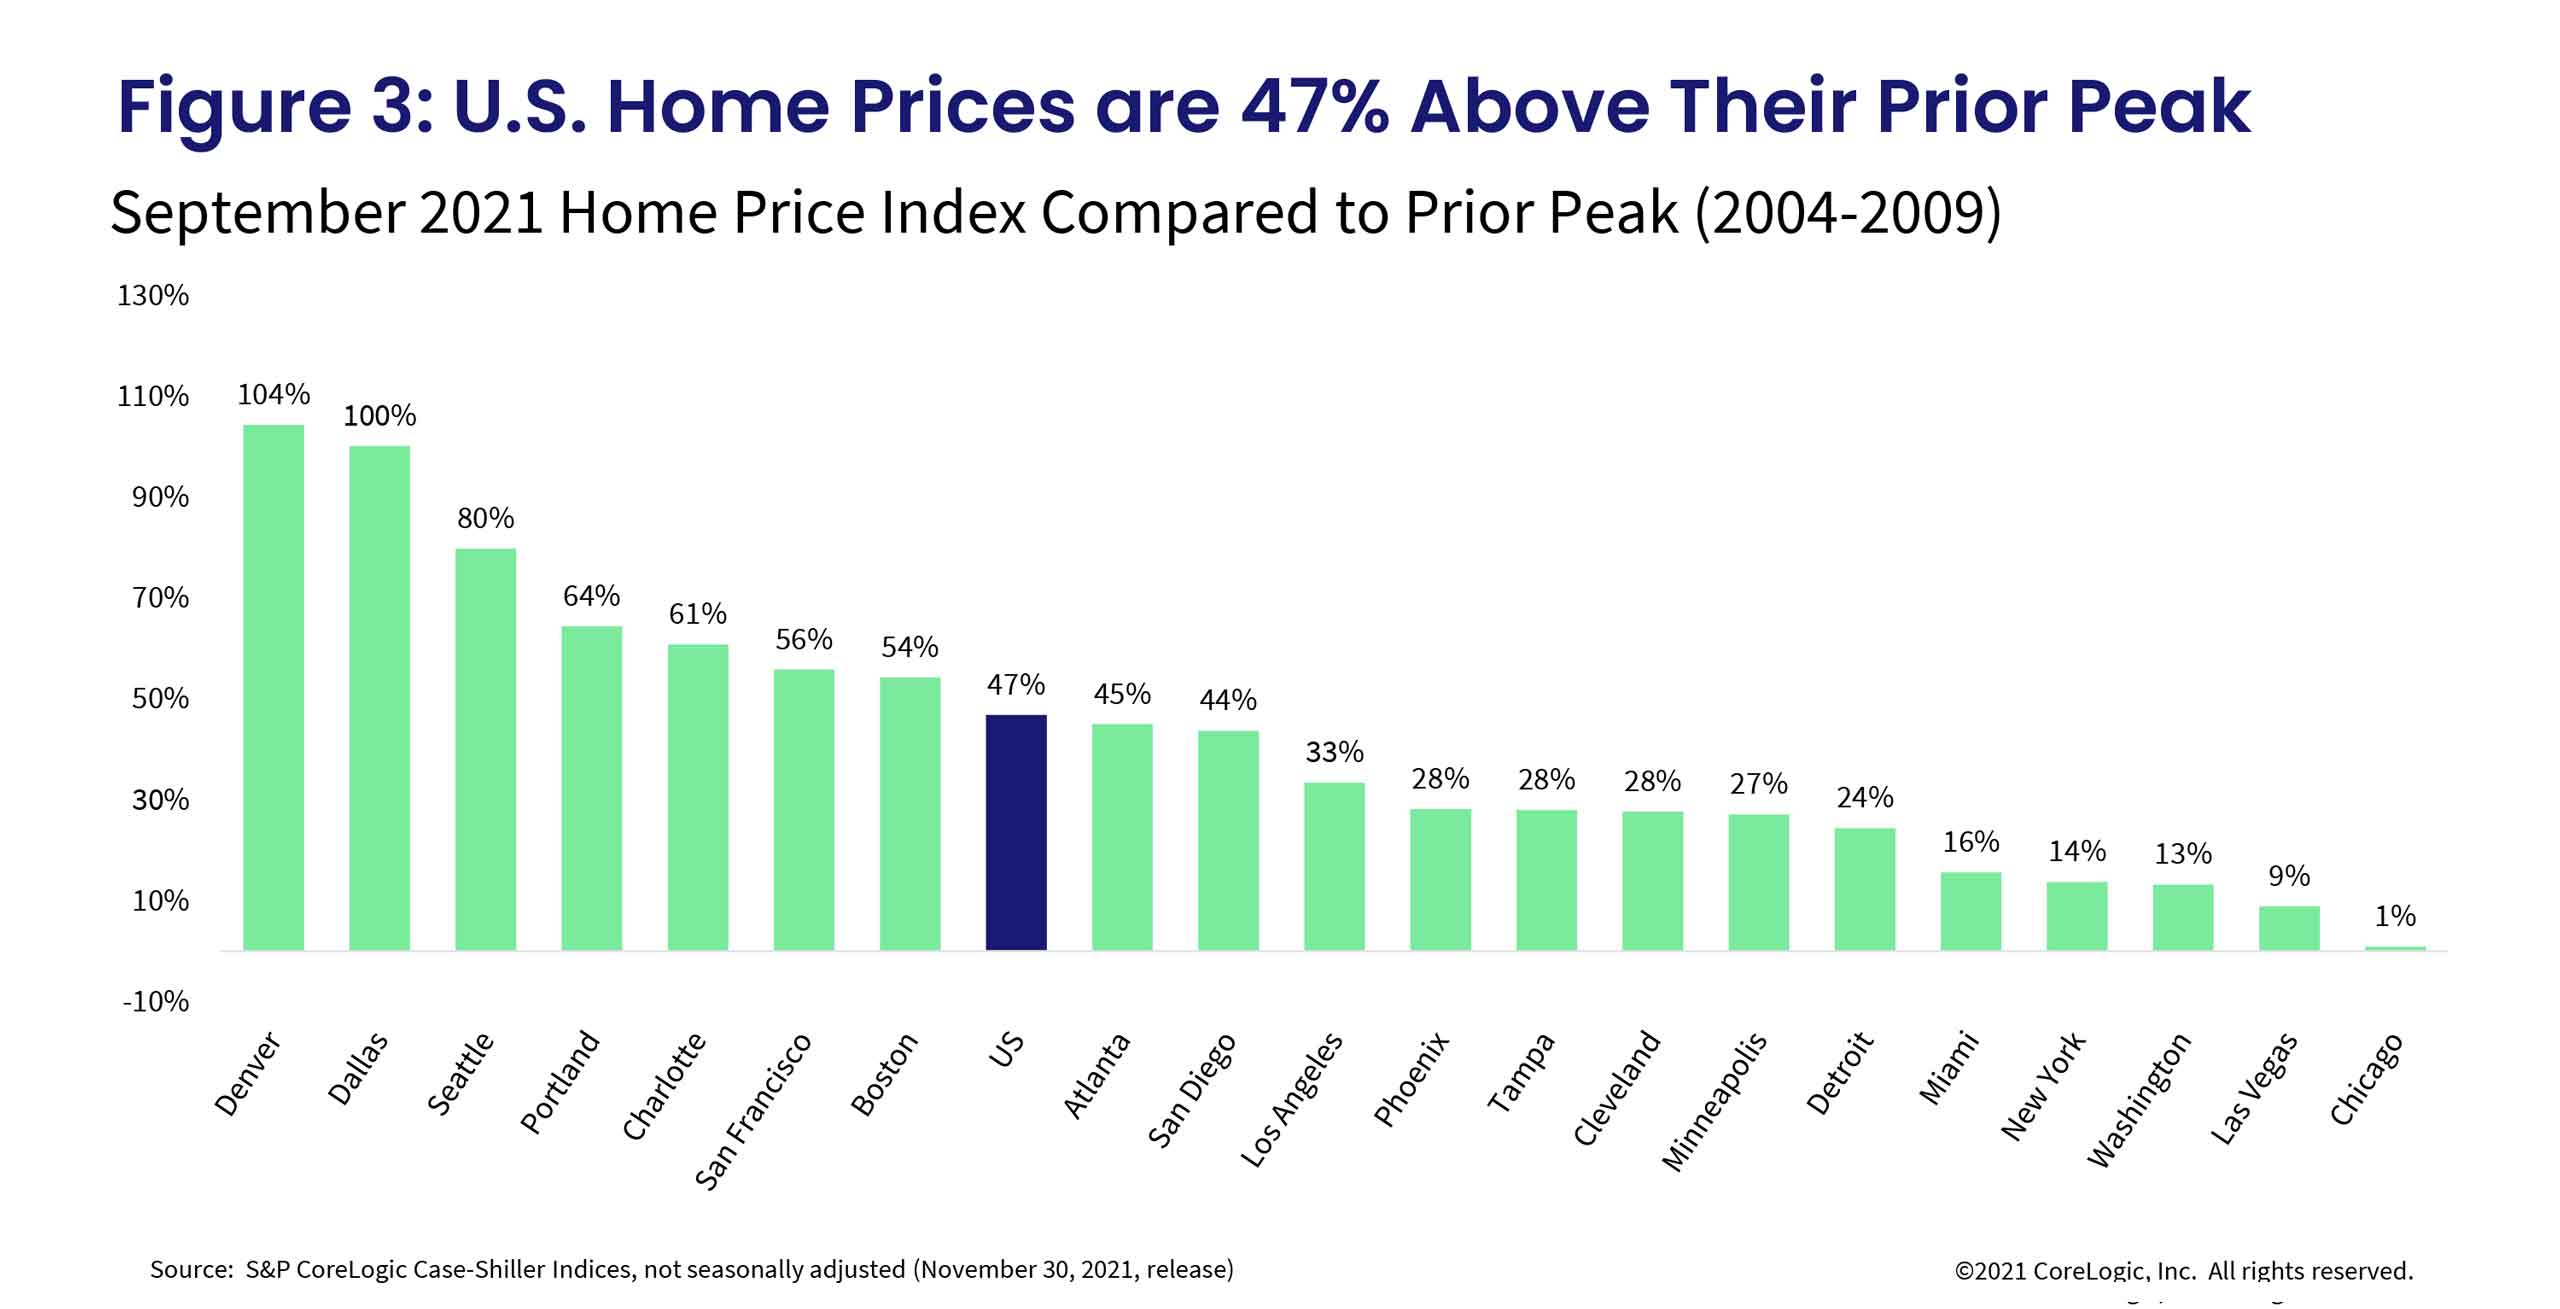
In September, national home prices were 47% higher than the previous peak. All metros are now at or above their previous peaks, though Chicago remains up only 1%, while Denver’s prices are 104% above its 2006 peak, followed by Dallas at 100% (Figure 3). Nonetheless, while nominal prices have surpassed previous levels, national home prices are only 12% above the previous peak when adjusted for inflation.

Further, while low and high tier home price growth remain very close to each other, both tiers also experienced continued declines in September compared to the July peak, up 20.5% and 20.6%, respectively. The middle tier, however, logged a somewhat smaller, 19.6% year-over-year increase, also slower than the previous month. Prior to the pandemic, low tier price growth was generally accelerating at a faster rate than the high tier. The slowdown in September’s annual gains was larger for the low and middle tiers.

Moreover, the month-to-month comparison of home price growth by price tier and location reveals the recent relative desirability of metro areas and purchasing power of the buyers.

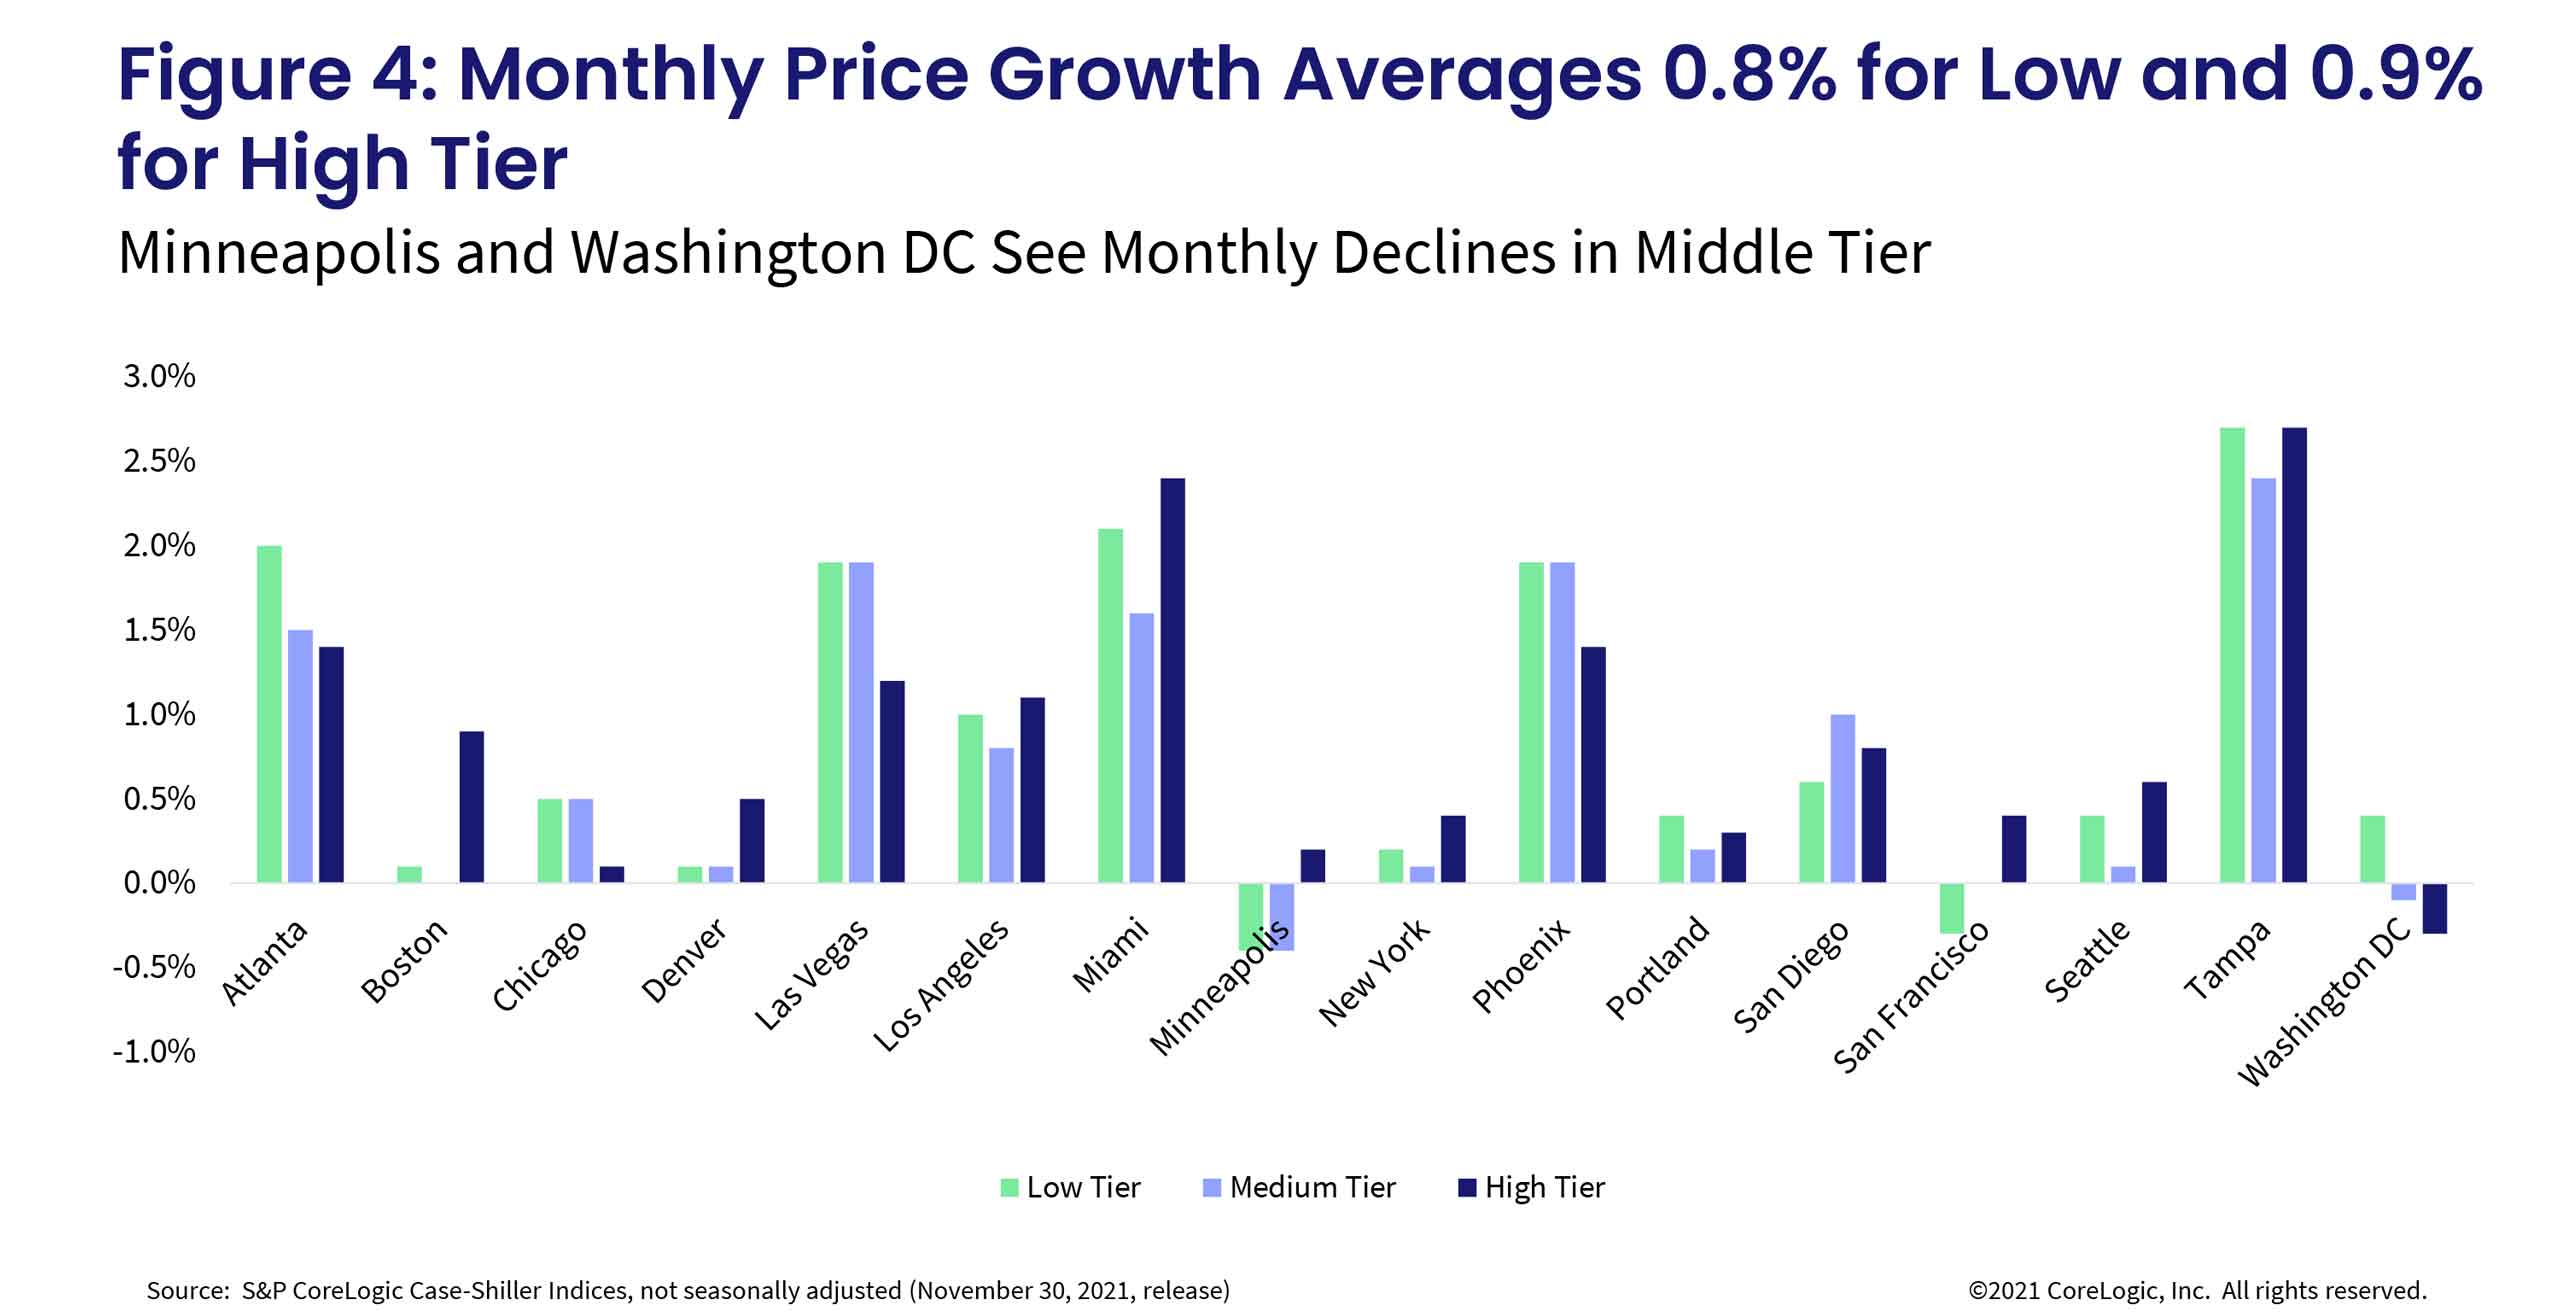
From August to September, the largest home price increase in the lower one-third price tier was in Tampa, up 2.7%, followed by Miami, up 2.1%. The average monthly gains among low tier homes have slowed from the peak, going from 1.8% in July to 0.8% in September, though these are not seasonally adjusted. Minneapolis and San Francisco both had monthly declines in the low tier in September, down 0.4% and 0.3%, respectively.

In the high tier, Tampa also led the monthly gains, up 2.7%, followed by Miami, up 2.4%. Average monthly gains in the high tier also slowed in September, up only 0.9% compared to July’s 1.7% monthly average. In Washington, the high tier declined 0.3%.

In the middle tier, some markets have experienced monthly declines. In September, Minneapolis was down 0.4% while Washington was down 0.1% (Figure 4).

In sum, while housing market activity continues to outperform pre-pandemic levels, there are encouraging signs of a slow albeit welcomed return to a more sustainable balance between buyers and sellers. There is still low availability of for-sale homes, which continues to drive price growth, but the competition has faded and assuaged some of the bidding war intensity. While home price appreciation will remain strong, as there is still a deep disparity between supply and available for-sale homes, the rate of growth will slow considerably from the current, near-20% annual increases. Additionally, while it is too early to tell, the new variant of the coronavirus may end up extending the work-from-home practices this winter and thus demand for single-family homes with more indoor and outdoor space.

  • Category: Home Price Insights, Intelligence, Reports
  • Tags: Case Shiller Index
ABOUT THE AUTHOR
Selma Hepp
Selma Hepp
Chief Economist
View Profile

Related Posts

mississippi tornadoes
Blogs

March 24 EF-4 Tornado in Mississippi

CoreLogic estimates over 4,100 homes were within the path of the tornado that hit Mississippi on March 24, 2023.

March 29, 2023
California Atmospheric Rivers
Core Conversations

What Was it Really Like to Live Through the California Floods? Our Team Spills | Part 2

In Part 2, host Maiclaire Bolton Smith talks about the atmospheric rivers and the snow that has made headlines and headway in altering California’s natural hazard landscape.

March 29, 2023
CSI_Promo_Mar2023
Blogs

US CoreLogic S&P Case-Shiller Index Gain Slows to Pre-Pandemic Low, Up by 3.8% Year Over Year in January

The index continued to decline year over year in January, again posting a single-digit gain.

March 28, 2023

About Corelogic

  • Newsroom
  • Leadership
  • Careers
  • Ethics & Compliance

Accounts

  • Products Sign-in

Contact

  • Sales Contact
  • Product Support

Regions

  • CoreLogic Australia
  • CoreLogic New Zealand
  • CoreLogic UK

Follow & Connect

  • Facebook
  • Instagram
  • Linkedin
  • Twitter
  • YouTube
© 2023 CoreLogic. All rights reserved.
  • Legal
  • Privacy Policy
  • CCPA
  • Cookie Preferences
  • Security
  • Sitemap
  • Accessibility
  • Legal
  • Privacy Policy
  • CCPA
  • Cookie Preferences
  • Security
  • Sitemap
  • Accessibility