


CoreLogic estimates 578,900 homes may have sustained hail damage during April 4 severe weather outbreak
On April 4, another band of severe thunderstorms crossed the central U.S., bringing large hail, multiple tornadoes and powerful straight-line winds that damaged property from Texas to Michigan. According to the National Oceanic and Atmospheric Administration (NOAA) Storm Prediction Center (SPC) Filtered Storm Report for April 4, the severe thunderstorm system was responsible for more than 200 tornado, large hail and high wind reports across the country.
Many people across the central U.S. are still recovering from the severe thunderstorms on March 31 that spanned a geographic area from Arkansas to Iowa, as well as the storms in Mississippi on March 24.
CoreLogic Identifies 578,900 Homes Worth an Estimated $202.5B Within Hail Swath Boundary
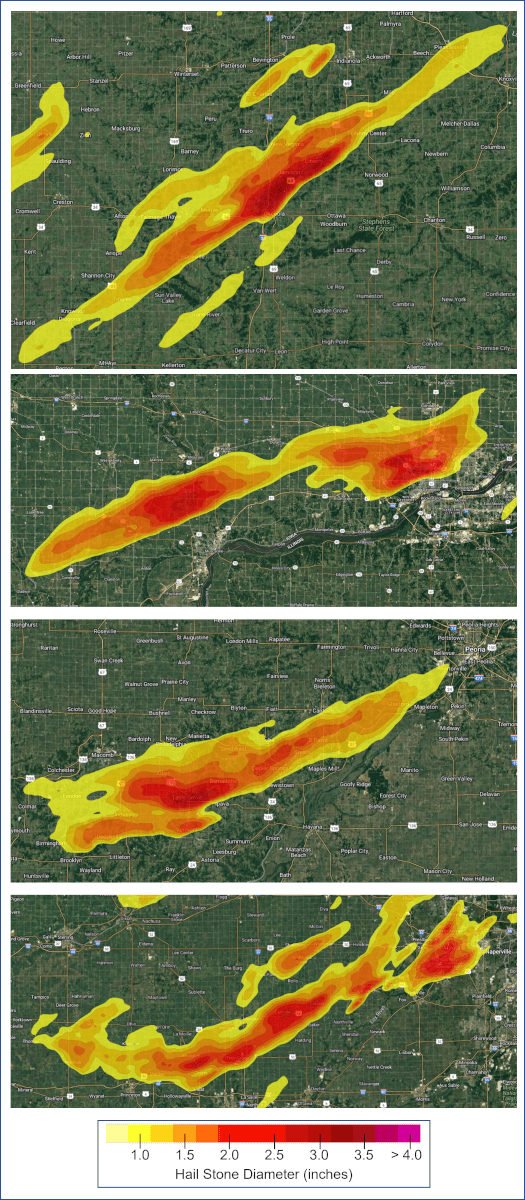
CoreLogic® Weather Verification Services (WVS) and the Reactor™ Platform captured the hail swaths across the U.S. on April 4. The most severe hail, a designation that is classified in terms of hail diameter, fell in Iowa and Illinois.
In Iowa, 3-inch hail was recorded in Clarke County, south of Des Moines. Scott County, which includes the city of Davenport, recorded 2.75-inch hail. In Illinois, 3-inch hail fell in Fulton County, which is west-southwest of Peoria. Hail ranging in size from 2 to 2.25 inches in diameter was recorded in DuPage and Kane Counties, both of which are west of Chicago.
CoreLogic estimates that hail greater than 1 inch in diameter likely impacted approximately 578,900 single- (SFR) and multifamily residential (MFR) properties across the country with a combined RCV of $202.5 billion.
Below, Table 1 provides the total number and RCV of residential properties by hail diameter. The count and RCV totals are provided by state (Table 1.1) and by county for the five hardest-hit counties (Table 1.2). Figure 1 provides a map of the hail swath boundaries and intensity (i.e., hail diameter), as visualized in CoreLogic’s Reactor platform.
| State | Count | Total RCV (USD billions) | ||||||
| 1″ – 2″ | 2″ – 3″ | > 3″ | Total | 1″ – 2″ | 2″ – 3″ | > 3″ | Total | |
| AR | 7,876 | 178 | – | 8,054 | 1.7 | 0.0 | 0.0 | 1.7 |
| IA | 62,751 | 13,857 | 53 | 76,661 | 15.4 | 3.2 | <0.1 | 18.7 |
| IL | 401,760 | 34,029 | – | 435,789 | 153.4 | 12.8 | 0.0 | 166.2 |
| IN | 329 | – | – | 329 | 0.1 | 0.0 | 0.0 | 0.1 |
| KS | 10,157 | – | – | 10,157 | 2.4 | 0.0 | 0.0 | 2.4 |
| MI | 13,011 | 871 | – | 13,882 | 3.9 | 0.3 | 0.0 | 4.2 |
| MN | – | – | – | – | 0.0 | 0.0 | 0.0 | 0.0 |
| MO | 20,856 | 213 | – | 21,069 | 5.6 | 0.1 | 0.0 | 5.6 |
| NE | – | – | – | – | 0.0 | 0.0 | 0.0 | 0.0 |
| TX | 2 | – | – | 2 | 0.0 | 0.0 | 0.0 | 0.0 |
| WI | 12,857 | – | – | 12,857 | 3.6 | 0.0 | 0.0 | 3.6 |
| WV | 100 | – | – | 100 | 0.0 | 0.0 | 0.0 | 0.0 |
| Grand Total | 529,699 | 49,148 | 53 | 578,900 | 186.1 | 16.4 | <0.1 | 202.5 |
Table 1.1: Residential Property Count and Total Reconstruction Value ($USD Billions) by State
Number and Total Reconstruction Value (RCV) of Single- (SRF) and Multifamily Residential (MFR) Properties by Hail Diameter Within the Hail Swath Footprints
| County | Clarke | Kane | Scott | Kendall | DeKalb | |
| State | IA | IL | IA | IL | IL | |
| Count | 1″-2″ | 1,603 | 46,537 | 12,611 | 15,720 | 5,231 |
| 2″-3″ | 713 | 17,393 | 12,965 | 12,212 | 1,884 | |
| >3″ | 53 | – | – | – | – | |
| Total Count | 2,369 | 63,930 | 25,576 | 27,932 | 7,115 | |
| RCV (USD billions) |
1″-2″ | 0.3 | 19.1 | 3.8 | 5.6 | 2.0 |
| 2″-3″ | 0.1 | 6.6 | 3.1 | 4.4 | 0.8 | |
| >3″ | <0.1 | 0.0 | 0.0 | 0.0 | 0.0 | |
| Total RCV | 0.4 | 25.7 | 6.8 | 10.1 | 2.8 |
Table 1.2: Residential Property Count and Total Reconstruction Value ($USD Billions) by County
Number and Total Reconstruction Value (RCV) of Single- (SRF) and Multifamily Residential (MFR) Properties by Hail Diameter in the Top Five Most Heavily Impacted Counties by Count and Hail Diameter
Materials Matter Regarding Hail Damage
Generally, a hailstorm is a vertical load that causes severe damage to roofs, walls and openings (e.g., skylights, windows and doors). According to an evaluation of property insurance claim data by Brown et al., 2015 and cited in CoreLogic’s U.S. Severe Convective Storm Model documentation, damage to roofs in the Dallas-Fort Worth metro following a significant hail event accounted for 91.7% of the total number of claims during the hailstorm. Damage to walls, doors and windows accounted for a combined 2.3% of the total number of claims from the same event.
Roofing materials factor heavily into whether hail will damage a roof. According to Brown et al., 2015, studies have shown that asphalt shingling can withstand damage from hailstones of up to 1 inch, making it a less resistant material when compared to concrete tiles, which can withstand damage from hailstones of up to 2 inches.
Additionally, roofs can be rated for impact resistance on a scale of one to four, with higher numbers indicating that a roof is more resistant to hail-related damage.
Disclaimer: Please note that not all properties within the hail swaths sustained damage. Also, the degree of damage to structures may vary. For instance, a damaged structure may not have incurred a total loss equal to the full RCV. The number of damaged properties will be a subset of the total homes within the hail swaths.
Clients with a CoreLogic WVS subscription can download the hail swath and straight-line wind speed maps from the severe weather outbreak on April 4.
What Are Severe Thunderstorms and What Happened on April 4?
Thunderstorms are very common in the U.S. Each year, there are approximately 100,000 thunderstorms, according to the NOAA National Severe Storm Laboratory (NSSL). Approximately 10% of these events become severe thunderstorms, which are most frequent in the spring and summer months.
Thunderstorms occur when the right combination of ingredients mix — namely moisture and rising, unstable air. These storms are considered severe if the system produces either hail greater than 1 inch in diameter, winds greater than 57.5 mph or tornadoes.
On April 4, a cold front moving across the central U.S. pushed up moist air from the Gulf of Mexico, creating an optimal environment for severe thunderstorm development. In addition to the large hail detailed above, the system was responsible for strong straight-line winds and tornadoes that damaged homes across the central U.S.
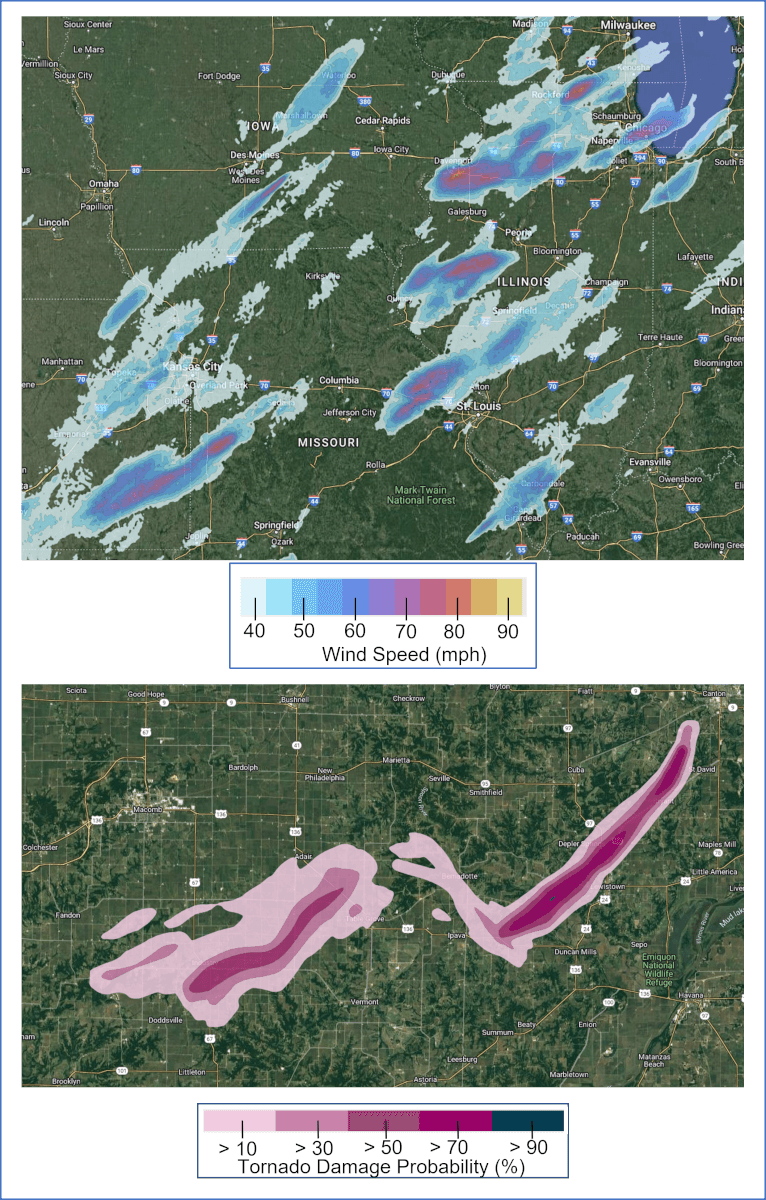
Straight-line winds of hurricane strength — those greater than 74 mph — were recorded in Davenport, Iowa, areas west-northwest of St. Louis and across the Kansas-Missouri border, which is south of Kansas City.
Near hurricane-force, straight-line winds were recorded in northern Chicago. Straight-line winds of this severity are capable of material property damage, including impacts to the siding and roofs of homes. Winds at this level are also often responsible for toppling trees and downing power lines.
Several tornadoes of unknown strength — as of April 5 at 10:00 a.m. EDT — were recorded in Fulton Country, Illinois southwest of Peoria, as well as in Bollinger County in southeastern Missouri.
CoreLogic WVS and the Reactor platform captured the April 4 straight-line wind fields and tornado paths across the U.S. The straight-line wind maps and tornado footprints as viewed in Reactor are presented in Figure 2 below.
Visualize Hazard Footprints and Manage Your Portfolio With Reactor™
CoreLogic Reactor is an interactive, geospatial mapping solution that provides forecasting and real-time and forensic weather data to users all from a single platform. Users can visualize storm warnings, watches, alerts and impacts of a weather event in the aftermath of activity. Such data includes tropical storm and hurricane wind speeds at the parcel level.
Tornado path and hail swath visualizations are powered by CoreLogic Weather Verification Services (WVS). CoreLogic WVS combines the best aspects of point observations — providing a high degree of accuracy — and radar technology high-resolution patterns. Proprietary algorithms generate wind speed maps with a high degree of geographical precision at the neighborhood-level detail (500-meter resolution). These digital tools offer 100% coverage of the continental U.S.
To learn more about severe convective storm risk in the U.S., download the CoreLogic 2023 Severe Convective Storm Report.
Please email [email protected] with questions regarding the April 4 severe weather outbreak, Weather Verification Services, the Reactor platform or any CoreLogic event response notifications.
Visit www.hazardhq.com for updates and information on catastrophes across the globe.


