Chat
Chat with Sales Hours: Monday-Friday 8:30 a.m. - 4:30 p.m. (CST)
Contact Sales
Call Sales Toll-Free 1-(866) 774-3282 Hours: Monday-Friday 7 a.m. - 5 p.m. (CST)
Product Login
Product Log-in
Product Support
Product Support
Email Sales
Contact Sales
After Hours
  • Support
  • Sign In Sign In
  • AUS NZ UK
CoreLogic - Home
  • Solutions
    view solutions by:

    Data Solutions

    • Lead Generation
    • Property Data
    • Location Intelligence

    Real Estate

    • Multiple Listing Enterprise
    • Agent & Broker

    Mortgage

    • Origination
    • Servicing
    • Appraisal
    • Commercial Property Tax

    Insurance

    • Hazard Risk
    • Catastrophe Risk Management
    • Risk Evaluation
    • Underwriting Automation
    • Weather
    • Claims Automation
    • Restoration
    • INTRCONNECT

    Mortgage Lenders

    • Origination

    Mortgage Servicers

    • Residential Property Tax
    • Default & Loss Mitigation
    • Portfolio Insight & Monitoring

    Mortgage Appraisers

    • Appraisal

    Real Estate Agents & Brokers

    • Agents & Brokers

    Real Estate MLS

    • Multiple Listing Enterprises

    Commercial Real Estate Owners

    • Commercial Property Tax

    Marketing Departments

    • Property Data

    Insurance Underwriters

    • Risk Evaluation
    • Underwriting Automation
    • Hazard Risk
    • Catastrophe Risk Management

    Insurance Risk Managers

    • Risk Evaluation
    • Hazard Risk
    • Catastrophe Risk Management

    Insurance Claims

    • Claims Automation
    • Restoration Contractors
    • Weather Verification

    Construction Contractors

    • Restoration Contractors

    General

    • Location Intelligence
    • Lead Generation
    • Data Solutions
  • Resources

    Reports

    • Climate Change
    • Construction Cost Update
    • Construction Insights
    • Home Price Insights
    • Homeowner Equity Insights
    • Loan Performance Insight
    • Mortgage Fraud
    • Property Tax Delinquency
    • Single-Family Rent Index

    Insight Blogs

    • Hazard HQ
    • Office of Chief Economist
    • Affordable Housing
    • Homebuying
    • Insurance
    • Other Articles

    More Resources

    • Events
    • Case Studies
    • White Papers
    • Podcasts
    • Quick Takes
  • Company
    • About
    • Leadership
    • Newsroom
    • Contact
    • Careers
  • Search
CoreLogic - Home
  • Solutions
  • Resources
  • Company

    • About
    • Leadership
    • Newsroom
    • Contact
    • Careers
  • Accounts

    • Products Sign-in
  • Contact

    • Sales Contact
    • Product Support
  • Regions

    • Australia
    • New Zealand
    • United Kingdom
  • Social

    • Facebook
    • Instagram
    • Linkedin
    • Twitter
    • Youtube
Solutions
VIEW BY:
  • Data Solutions

    • Lead Generation
    • Property Data
    • Location Intelligence
  • Real Estate

    • Multiple Listing Enterprise
    • Agent & Broker
  • Mortgage

    • Origination
    • Servicing
    • Appraisal
    • Commercial Property Tax
  • Insurance

    • Hazard Risk
    • Catastrophe Risk Management
    • Risk Evaluation
    • Underwriting Automation
    • Weather
    • Claims Automation
    • Restoration
    • INTRCONNECT
  • Mortgage Lenders

    • Origination
  • Mortgage Servicers

    • Residential Property Tax
    • Default & Loss Mitigation
    • Portfolio Insight & Monitoring
  • Mortgage Appraisers

    • Appraisal
  • Real Estate Agents & Brokers

    • Agents & Brokers
  • Real Estate MLS

    • Multiple Listing Enterprises
  • Commercial Real Estate Owners

    • Commercial Property Tax
  • Marketing Departments

    • Property Data
  • Insurance Underwriters

    • Risk Evaluation
    • Underwriting Automation
    • Hazard Risk
    • Catastrophe Risk Management
  • Insurance Risk Managers

    • Risk Evaluation
    • Hazard Risk
    • Catastrophe Risk Management
  • Insurance Claims

    • Claims Automation
    • Restoration Contractors
    • Weather Verification
  • Construction Contractors

    • Restoration Contractors
  • General

    • Location Intelligence
    • Lead Generation
    • Data Solutions
Resources
  • Reports

    • Climate Change
    • Construction Cost Update
    • Construction Insights
    • Home Price Insights
    • Homeowner Equity Insights
    • Loan Performance Insight
    • Mortgage Fraud
    • Property Tax Delinquency
    • Single-Family Rent Index
  • Insight Blogs

    • Hazard HQ
    • Office of Chief Economist
    • Affordable Housing
    • Homebuying
    • Insurance
    • Other Articles
  • More Resources

    • Events
    • Case Studies
    • White Papers
    • Podcasts
    • Quick Takes

Home / Intelligence / Delinquency Rate Posts Largest One-Month Decrease Since Start of Pandemic

ABOUT THE AUTHOR
Molly Boesel
Molly Boesel
Principal, Economist, Office of the Chief Economist
View Profile
  • June 7, 2021

Delinquency Rate Posts Largest One-Month Decrease Since Start of Pandemic

Loan Performance Insights Report Highlights: March 2021

  • The nation’s overall delinquency rate was 4.9% in March.
  • The current-to-30-day transition rate in March was the lowest in over 21 years.

In March 2021, 4.9% of home mortgages were in some stage of delinquency (30 days or more past due, including those in foreclosure)[1], a sharp decrease from February 2021 according to the latest CoreLogic Loan Performance Insights Report . The 0.8 percentage point decrease in the delinquency rate from February was the largest since the start of the pandemic and could be partly attributed to the largest one-month increase in employment since August 2020.

Overall Delinquency Rates

All mortgage delinquency measures improved in March 2021 compared with the prior month, and early delinquency measures also improved compared with the prior year. The share of mortgages that were 30 to 59 days past due — considered early-stage delinquencies — was 1% in March 2021, down sharply from a post-pandemic high of 4.2% in April 2020, and down from 1.5% in February 2021. The share of mortgages 60 to 89 days past due was 0.4% in March 2021, down from 0.6% in March 2020 and down from 2.8% in May 2020.

The serious delinquency rate — defined as 90 days or more past due, including loans in foreclosure — was 3.5% in March, roughly three times that of a year earlier, but down from a recent high of 4.3% in August 2020 and from 3.7% in February 2021. The CARES Act provides relief to mortgage holders and has worked to keep delinquencies from progressing to foreclosure and therefore the foreclosure inventory rate — the share of mortgages in some stage of the foreclosure process — remained low at 0.3% in March 2021, down from 0.4% from March 2020. The decrease in the serious delinquency rate from the August high and increases in home equity as prices continued to increase in 2021 lessen the likelihood of a foreclosure wave later in the year when homeowners emerge from forbearance.

Stage of Delinquency: Rate of Transition

In addition to delinquency rates, CoreLogic tracks the rate at which mortgages transition from one stage of delinquency to the next, such as going from current to 30 days past due (Figure 1).

Figure 1: Current- to 30-Day Transition Rate Back to Pre-Pandemic Levels

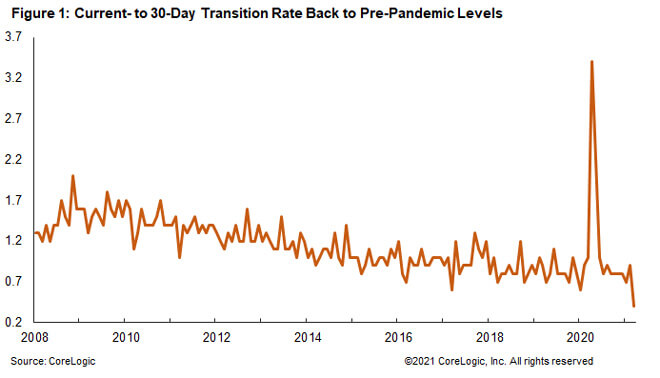
The share of mortgages that transitioned from current to 30 days past due was 0.4% in March 2021 — a decrease from the peak of 3.4% in April 2020, and the lowest rate recorded for this measure.[2] Low transition rates indicate that while the rate of mortgages in any stage of delinquency remained elevated, fewer borrowers slipped into delinquency than early in the recession.

Figure 2: States With the Highest and Lowest Rate of Mortgages At Least 30 Days Past Due March 2021

State and Metro Level Delinquencies

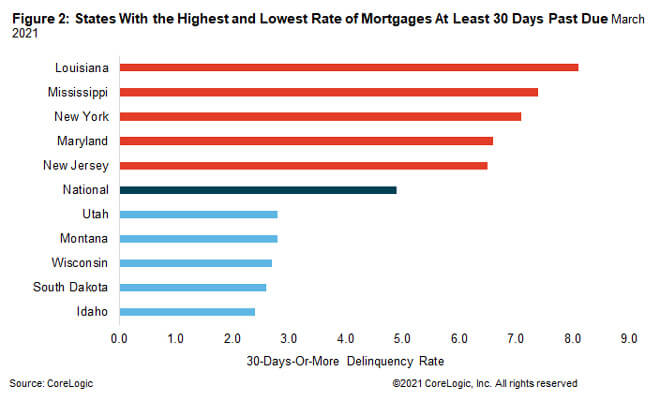
Figure 2 shows the states with the highest and lowest share of mortgages 30 days or more delinquent. In March 2021, that rate was highest in Louisiana at 8.1% and lowest in Idaho at 2.4%.  All U.S. states posted annual gains in their overall delinquency rate in March 2021, and places with large job losses during the last year experienced large increases in delinquencies. Hawaii and Nevada, both of which rely heavily on tourism and the hospitality industry, had the largest 12-month spike in delinquency rates, increasing 3.2 and 3 percentage points respectively. These states also had large increases in unemployment rates during the pandemic, and the unemployment rate for Hawaii was the highest in the nation in March 2021 at 9.1% compared with 6% for the U.S overall.

Figure 3: Percentage of Mortgages At Least 30 Days Past Due For the Ten Largest Metropolian Areas

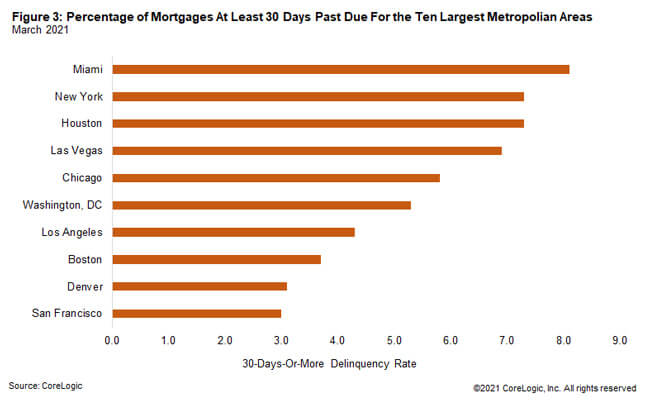
Figure 3 shows the 30-plus-day past-due rate for March 2021 for 10 large metropolitan areas.[3] Miami had the highest rate at 8.1% and San Francisco had the lowest rate at 3%. Miami’s rate increased 2.9 percentage points from a year earlier. Outside of the largest 10, 94% of metros recorded an increase in the overall delinquency rate. Oil-reliant Odessa, Texas, experienced the largest annual increase with 7.9 percentage points — the unemployment rate in Odessa increased to 10.6% in March, a 5.8 percentage point increase from the prior year.

Mortgage delinquencies showed the largest one-month improvement since the start of the pandemic in March as the U.S. job market improved. While the overall delinquency rate and serious delinquency rate are elevated compared with the pre-pandemic period, early delinquencies were low in March, and the current-to-30-day transition rate dipped to the lowest level recorded. Continued improvements in the economy and job market this year will help borrowers remain current on their payments when forbearance is lifted later this year.

© 2021 CoreLogic, Inc. All rights reserved.

[1] Data in this report is provided by TrueStandings Servicing.  https://www.corelogic.com/products/truestandings-servicing.aspx. The CARES Act provided forbearance for borrowers with federally backed mortgage loans who were economically impacted by the pandemic. Borrowers in a forbearance program who have missed a mortgage payment are included in the CoreLogic delinquency statistics, even if the loan servicer has not reported the loan as delinquent to credit repositories.

[2] The data use for the LPI report begins in January 1999.

[3] Metropolitan areas used in this report are the ten most populous Metropolitan Statistical Areas. The report uses Metropolitan Divisions where available.

  • Category: Intelligence, Loan Performance Insight, Reports
  • Tags: Loan Performance
ABOUT THE AUTHOR
Molly Boesel
Molly Boesel
Principal, Economist, Office of the Chief Economist
View Profile

Related Posts

mississippi tornadoes
Blogs

March 24 EF-4 Tornado in Mississippi

CoreLogic estimates over 4,100 homes were within the path of the tornado that hit Mississippi on March 24, 2023.

March 29, 2023
California Atmospheric Rivers
Core Conversations

What Was it Really Like to Live Through the California Floods? Our Team Spills | Part 2

In Part 2, host Maiclaire Bolton Smith talks about the atmospheric rivers and the snow that has made headlines and headway in altering California’s natural hazard landscape.

March 29, 2023
CSI_Promo_Mar2023
Blogs

US CoreLogic S&P Case-Shiller Index Gain Slows to Pre-Pandemic Low, Up by 3.8% Year Over Year in January

The index continued to decline year over year in January, again posting a single-digit gain.

March 28, 2023

About Corelogic

  • Newsroom
  • Leadership
  • Careers
  • Ethics & Compliance

Accounts

  • Products Sign-in

Contact

  • Sales Contact
  • Product Support

Regions

  • CoreLogic Australia
  • CoreLogic New Zealand
  • CoreLogic UK

Follow & Connect

  • Facebook
  • Instagram
  • Linkedin
  • Twitter
  • YouTube
© 2023 CoreLogic. All rights reserved.
  • Legal
  • Privacy Policy
  • CCPA
  • Cookie Preferences
  • Security
  • Sitemap
  • Accessibility
  • Legal
  • Privacy Policy
  • CCPA
  • Cookie Preferences
  • Security
  • Sitemap
  • Accessibility