Chat
Chat with Sales Hours: Monday-Friday 8:30 a.m. - 4:30 p.m. (CST)
Contact Sales
Call Sales Toll-Free 1-(866) 774-3282 Hours: Monday-Friday 7 a.m. - 5 p.m. (CST)
Product Login
Product Log-in
Product Support
Product Support
Email Sales
Contact Sales
After Hours
  • Support
  • Sign In Sign In
  • AUS NZ UK
CoreLogic - Home
  • Solutions
    view solutions by:

    Data Solutions

    • Lead Generation
    • Property Data
    • Location Intelligence

    Real Estate

    • Multiple Listing Enterprise
    • Agent & Broker

    Mortgage

    • Origination
    • Servicing
    • Appraisal
    • Commercial Property Tax

    Insurance

    • Hazard Risk
    • Catastrophe Risk Management
    • Risk Evaluation
    • Underwriting Automation
    • Weather
    • Claims Automation
    • Restoration
    • INTRCONNECT

    Mortgage Lenders

    • Origination

    Mortgage Servicers

    • Residential Property Tax
    • Default & Loss Mitigation
    • Portfolio Insight & Monitoring

    Mortgage Appraisers

    • Appraisal

    Real Estate Agents & Brokers

    • Agents & Brokers

    Real Estate MLS

    • Multiple Listing Enterprises

    Commercial Real Estate Owners

    • Commercial Property Tax

    Marketing Departments

    • Property Data

    Insurance Underwriters

    • Risk Evaluation
    • Underwriting Automation
    • Hazard Risk
    • Catastrophe Risk Management

    Insurance Risk Managers

    • Risk Evaluation
    • Hazard Risk
    • Catastrophe Risk Management

    Insurance Claims

    • Claims Automation
    • Restoration Contractors
    • Weather Verification

    Construction Contractors

    • Restoration Contractors

    General

    • Location Intelligence
    • Lead Generation
    • Data Solutions
  • Resources

    Reports

    • Climate Change
    • Construction Cost Update
    • Construction Insights
    • Home Price Insights
    • Homeowner Equity Insights
    • Loan Performance Insight
    • Mortgage Fraud
    • Property Tax Delinquency
    • Single-Family Rent Index

    Insight Blogs

    • Hazard HQ
    • Office of Chief Economist
    • Affordable Housing
    • Homebuying
    • Insurance
    • Other Articles

    More Resources

    • Events
    • Case Studies
    • White Papers
    • Podcasts
    • Quick Takes
  • Company
    • About
    • Leadership
    • Newsroom
    • Contact
    • Careers
  • Search
CoreLogic - Home
  • Solutions
  • Resources
  • Company

    • About
    • Leadership
    • Newsroom
    • Contact
    • Careers
  • Accounts

    • Products Sign-in
  • Contact

    • Sales Contact
    • Product Support
  • Regions

    • Australia
    • New Zealand
    • United Kingdom
  • Social

    • Facebook
    • Instagram
    • Linkedin
    • Twitter
    • Youtube
Solutions
VIEW BY:
  • Data Solutions

    • Lead Generation
    • Property Data
    • Location Intelligence
  • Real Estate

    • Multiple Listing Enterprise
    • Agent & Broker
  • Mortgage

    • Origination
    • Servicing
    • Appraisal
    • Commercial Property Tax
  • Insurance

    • Hazard Risk
    • Catastrophe Risk Management
    • Risk Evaluation
    • Underwriting Automation
    • Weather
    • Claims Automation
    • Restoration
    • INTRCONNECT
  • Mortgage Lenders

    • Origination
  • Mortgage Servicers

    • Residential Property Tax
    • Default & Loss Mitigation
    • Portfolio Insight & Monitoring
  • Mortgage Appraisers

    • Appraisal
  • Real Estate Agents & Brokers

    • Agents & Brokers
  • Real Estate MLS

    • Multiple Listing Enterprises
  • Commercial Real Estate Owners

    • Commercial Property Tax
  • Marketing Departments

    • Property Data
  • Insurance Underwriters

    • Risk Evaluation
    • Underwriting Automation
    • Hazard Risk
    • Catastrophe Risk Management
  • Insurance Risk Managers

    • Risk Evaluation
    • Hazard Risk
    • Catastrophe Risk Management
  • Insurance Claims

    • Claims Automation
    • Restoration Contractors
    • Weather Verification
  • Construction Contractors

    • Restoration Contractors
  • General

    • Location Intelligence
    • Lead Generation
    • Data Solutions
Resources
  • Reports

    • Climate Change
    • Construction Cost Update
    • Construction Insights
    • Home Price Insights
    • Homeowner Equity Insights
    • Loan Performance Insight
    • Mortgage Fraud
    • Property Tax Delinquency
    • Single-Family Rent Index
  • Insight Blogs

    • Hazard HQ
    • Office of Chief Economist
    • Affordable Housing
    • Homebuying
    • Insurance
    • Other Articles
  • More Resources

    • Events
    • Case Studies
    • White Papers
    • Podcasts
    • Quick Takes

Home / Intelligence / Reports / US CoreLogic S&P Case-Shiller Index Retracts Rapidly Amid Surging Mortgage Rates, Up by 13% in August

ABOUT THE AUTHOR
Selma Hepp
Selma Hepp
Chief Economist
View Profile
  • October 25, 2022

US CoreLogic S&P Case-Shiller Index Retracts Rapidly Amid Surging Mortgage Rates, Up by 13% in August

Five housing markets in the Southeast and South continued to post more than 20% annual price gains in August

Rising mortgage rates continue to rattle the U.S. housing market. With homebuyer demand quickly slowing, price appreciation has followed suit in many metro areas.

In August, the CoreLogic S&P Case-Shiller Index posted a 13% year-over-year increase, down from a 15.6% gain in July, marking the fifth straight month of decelerating annual home price appreciation. The rapid decline in home prices put this August’s annual gain below those recorded in 2021 and 2004-2005 (Figure 1).

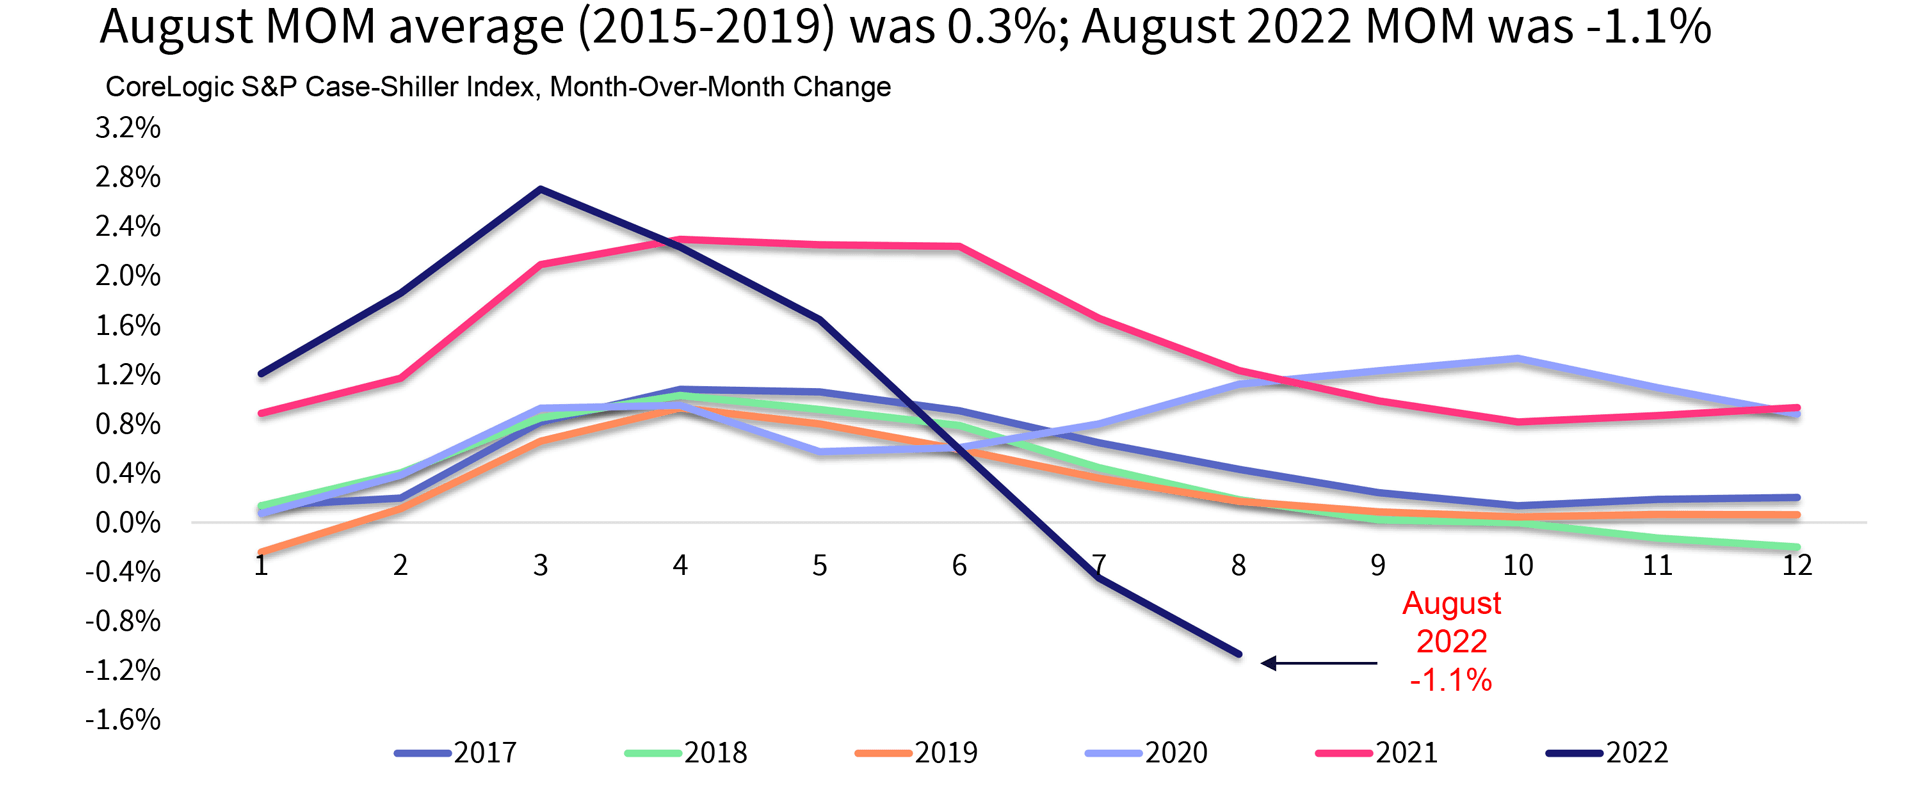
In addition, the non-seasonally adjusted month-to-month index posted the second month of declines, down by 1.1% in August from a 2.6% peak increase in March and a 0.5% decline in July, suggesting further and potentially quicker deceleration in home price growth. Between 2014 and 2019, the monthly index gain from July to August averaged about 0.3% (Figure 2). The last time monthly prices declined was in the winter of 2018-2019, when the Federal Reserve’s tightening cycle, though much flatter than today, led to a housing market slowdown. 

At this pace, and according CoreLogic’s Home Price Index forecast, annual growth is expected to slow to 9% by December and down to less than 1% by the end of the first quarter of 2023. Some markets are seeing more significant slowing of home price appreciation, particularly those on the West Coast and in the Mountain West, where high mortgage rates are severely impacting affordability.

Nevertheless, differences still exist by geography, with affordable areas in South and Southeast continuing to thrive as out-migration from more expensive markets persists. However, slowing home price growth should continue nationwide, with the forecast for most metros in the low single digits by early next year. Only about 5% of metros are currently forecast to post price decreases by August 2023.

The 10- and 20-city composite indexes also continued to decelerate — up by 12.1% and 13.1% year over year, respectively — compared with 14.9% and 16% growth in July. That’s a deceleration of  2.8 and 2.9 percentage points, respectively, in just one month. And while the overall trend for higher price increases in smaller markets continues to drive the 20-city index growth, slowing price gains were slightly higher in the 20-city index, as those areas tend to include more affordable markets that are being harder hit by affordability challenges.

Compared with the 2006 peak, the 10-city composite price index is now 42% higher, while the 20-city composite is up by 51%. Adjusted for inflation, which remains concerningly elevated, the 10-city index is now flat, while the 20-city index is up by 5% compared with the 2006 peak.

Figure 1: August Home Price Appreciation Rapidly Slows

Source: CoreLogic S&P Case-Shiller Indices, not seasonally adjusted (October 25, 2022, release)
© 2022 CoreLogic,Inc., All rights reserved.

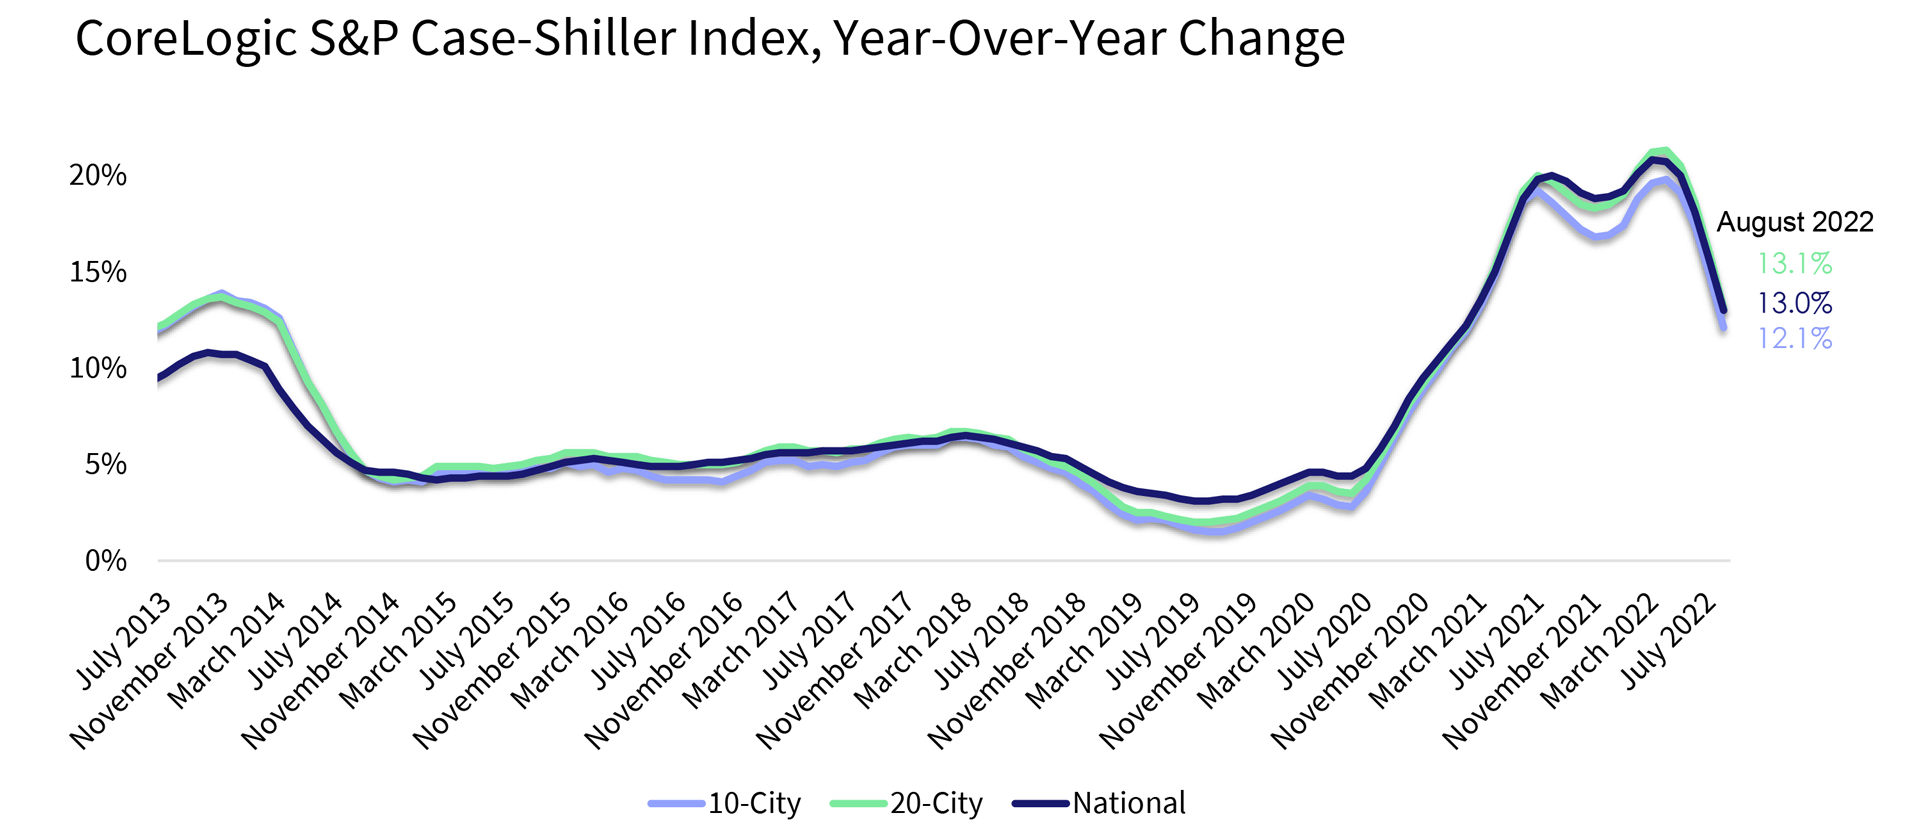
Figure 2: Month-to-Month Price Change Declines Again in August   

Source: CoreLogic S&P Case-Shiller Indices, not seasonally adjusted (October 25, 2022, release)
© 2022 CoreLogic,Inc., All rights reserved.

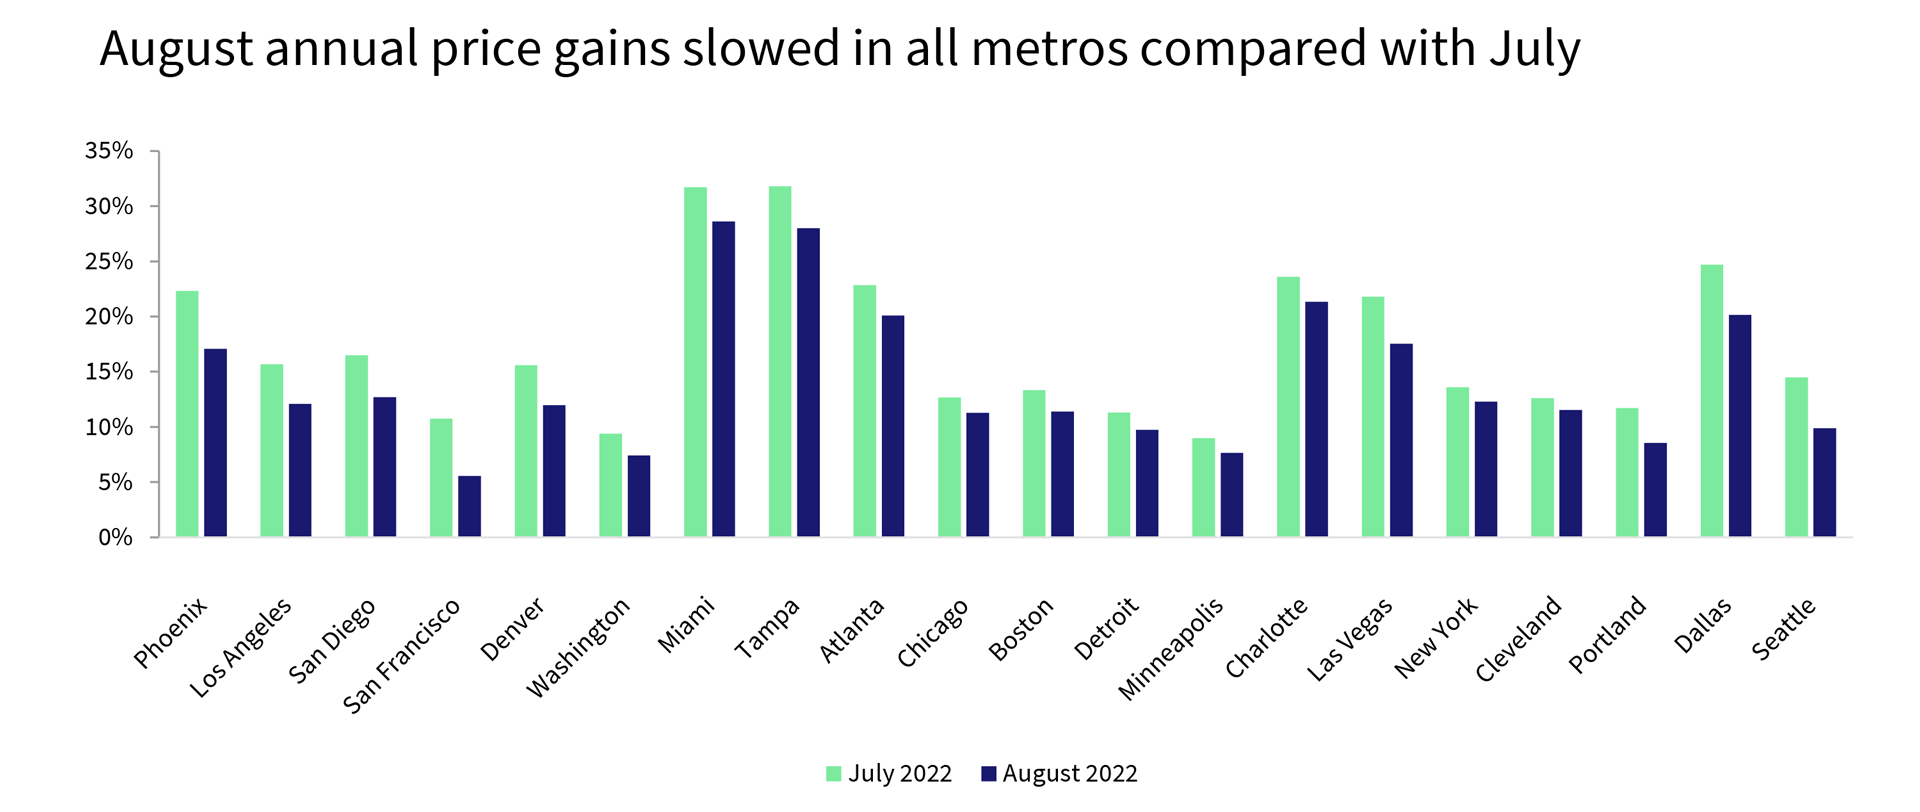
After six straight months of Tampa, Florida leading the nation for appreciation, Miami posted the strongest annual home price growth among the 20 tracked markets, surging by 28.6% in August, down from July’s non-seasonally adjusted rate of 31.8%. Tampa now ranks second, recording a 28% year-over-year gain in August, down from 31.7% in July.

Charlotte, North Carolina posted the third-highest increase, at 21.3% in August. Phoenix’s rapidly slowing housing market pulled the metro down to the sixth position with a 17.1% increase — down from February’s 32.9% gain, when it last posted the index’s strongest price growth.

All 20 metros experienced decelerating annual gains in August (Figure 3). Phoenix, San Francisco, Dallas, Seattle and Las Vegas posted the largest slowdowns in annual gains compared with July — all down about 4 to 5 percentage points in one month. Cleveland and New York saw the smallest declines in year-over-year gains compared with July.

Figure 3: Deceleration in Year-Over-Year Home Price Growth Seen in all 20 Metros

Source: CoreLogic S&P Case-Shiller Indices, not seasonally adjusted (October 25, 2022, release)
© 2022 CoreLogic,Inc., All rights reserved.

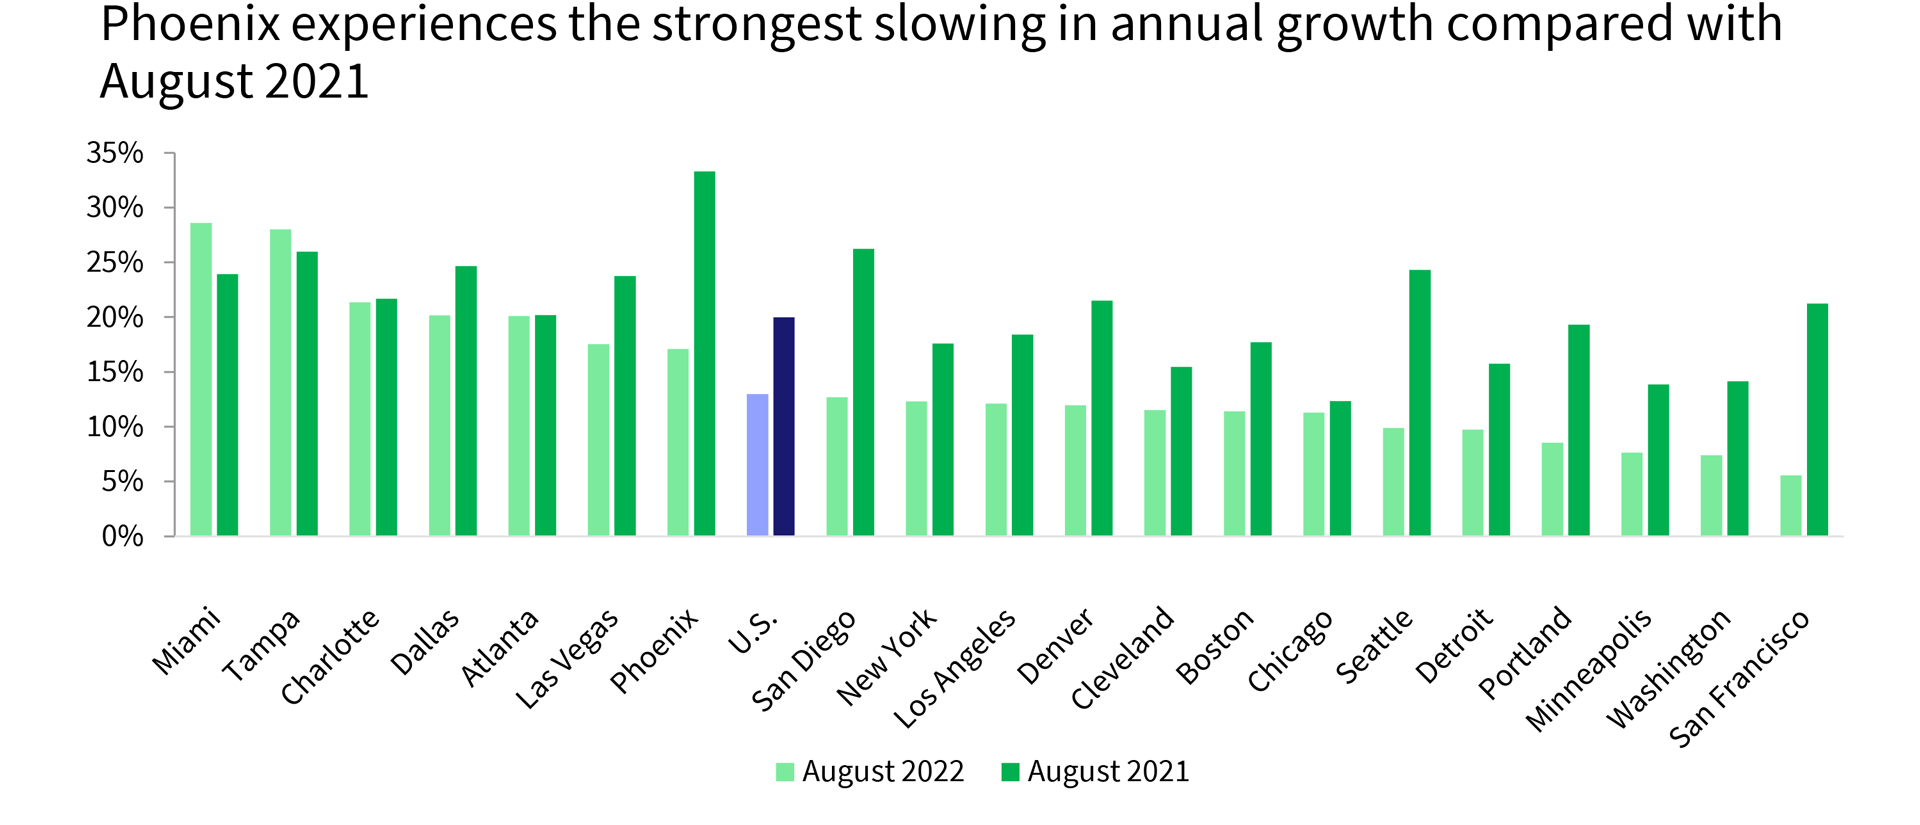
Compared with annual gains recorded last August, only Miami and Tampa continued to see stronger increases, up by 4.7 and 2 percentage points, respectively. Phoenix again posted the largest slowdown in gains compared with last August as it did in July, declining by 16.2 percentage points from one year earlier. San Francisco followed, with a 15.7 percentage point decrease (Figure 4).

Figure 4: Year-Over-Year Home Price Growth Higher in Miami and Tampa in August Compared With 2021

Source: CoreLogic S&P Case-Shiller Indices, not seasonally adjusted (October 25, 2022, release)
© 2022 CoreLogic,Inc., All rights reserved.

Furthermore, slowing price growth is evident across all price tiers. The low-price tier was up by 14.4% in August, while middle-tier growth slowed to 13.1% and the high tier rose by 14.2%. The high tier showed the largest deceleration in annual gains compared with July, down by 2.7 percentage points. Relatively smaller deceleration in the low tier could reflect continued pressure from multiple buyers, including investors. According to CoreLogic’s latest investor data, investor activity remained steady in the summer of 2022, leading to an increased share of purchases by these buyers, even as overall sales declined. Investors of all sizes continue to purchase about 100,000 properties per month nationwide.

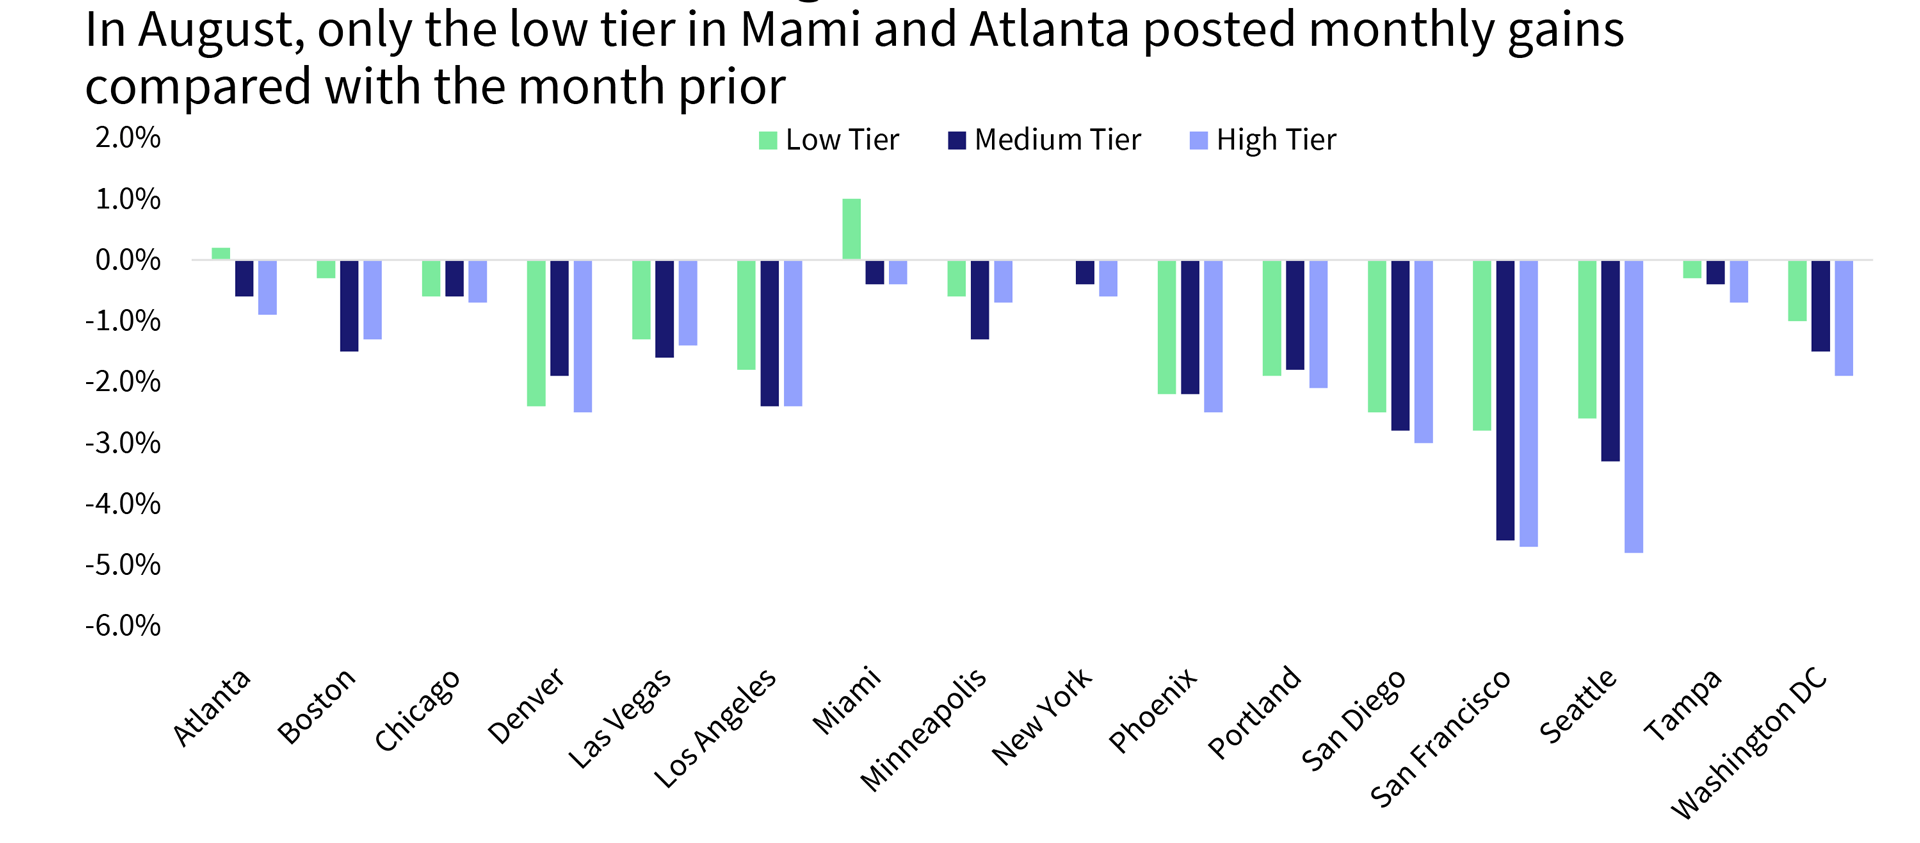
The month-over-month comparison of appreciation by price tier and location also reveals relative changes in demand across the country. From July to August, the pricier Western metros — particularly San Francisco; Seattle; San Diego; Los Angeles; Portland, Oregon and Denver — showed declines in monthly gains across price tiers. In fact, August was the third month of monthly declines in a number of metros. Again, August has historically seen an increase in monthly home price gains compared with July. Only the low tier in Miami posted a 1% monthly gain in August.

The average monthly price gain among low-tier homes was down by 1.2% in August, though that number is not seasonally adjusted. High-tier month-over-month prices declined by 1.9% on average, while middle-tier monthly price decreases averaged 1.7% (Figure 5).

Figure 5: Monthly Price Declines Average -1.2% for Low and -1.9% for High Tier

Source: CoreLogic S&P Case-Shiller Indices, not seasonally adjusted (October 25, 2022, release)
© 2022 CoreLogic,Inc., All rights reserved.

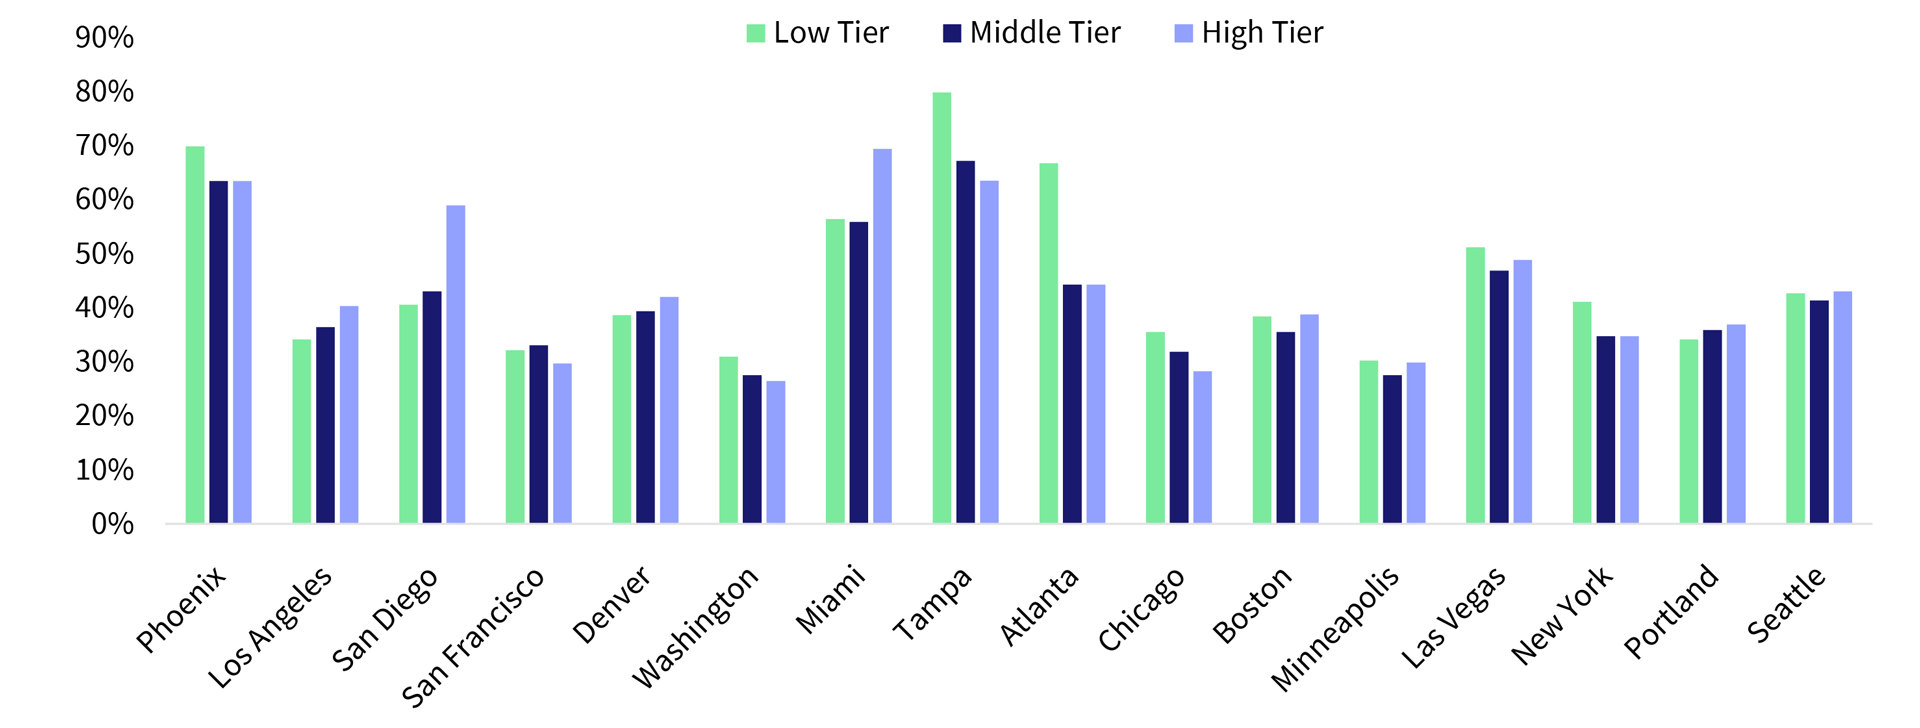
Lastly, while home prices have cumulatively increased by about 41% since the beginning of the COVID-19 pandemic in March 2020, there are markets with significantly higher increases in some price tiers. Overall, Tampa saw the largest gain in the low tier, up by 80%, followed by a 70% increase in Phoenix. Miami and Tampa also led the 20 cities in the high tier, both with over 60% cumulative gains (Figure 6).

Figure 6: Cumulatively, Tampa and Phoenix Lead With the Highest Gains Since the Pandemic Started (August 2022 Versus March 2020)

Source: CoreLogic S&P Case-Shiller Indices, not seasonally adjusted (October 25, 2022, release)
© 2022 CoreLogic,Inc., All rights reserved.

Housing markets have been rapidly resetting following mortgage rates surges, which continue to challenge expectations going forward. Mortgage rates are now at the highest since the early 2000s and are eroding affordability, particularly in housing markets where price appreciation well exceeds the rate of local income growth. As a result, housing markets will continue to readjust, resulting in a better balance between incomes and prices.

Nevertheless, many concerns remain about the U.S. housing market. While rising mortgage rates are now impeding potential homebuying activity, the lack of supply of properties for sale continues to pose a critical challenge, one which is further complicated by existing homeowners who are reluctant to move because they have already locked in low rates.

© 2022 CoreLogic,Inc., All rights reserved.
  • Category: Home Price Insights, Intelligence, Reports
  • Tags: Case Shiller Index
ABOUT THE AUTHOR
Selma Hepp
Selma Hepp
Chief Economist
View Profile

Related Posts

Header Intelligence Protect storm HHQ hazard
Climate Change

2023 Severe Convective Storm Risk Report

As rising global temperatures continue to contribute to increasingly hazardous wildfire seasons, it is more important than ever for homeowners, insurers, and governments to understand the risk these hazards pose to their communities.

March 31, 2023
Construction worker framing a house
Construction Insight

Quarterly Construction Insights – Q1 2023

CoreLogic tracks construction cost for commercial, residential and agricultural construction of all types of goods (labor and materials) throughout the United States and Canada.

March 30, 2023
Jan23LPIPromo
Blogs

Loan Performance Insights – March 2023

U.S. mortgage delinquency and foreclosure rates continued to hold near record lows in January.

March 30, 2023

About Corelogic

  • Newsroom
  • Leadership
  • Careers
  • Ethics & Compliance

Accounts

  • Products Sign-in

Contact

  • Sales Contact
  • Product Support

Regions

  • CoreLogic Australia
  • CoreLogic New Zealand
  • CoreLogic UK

Follow & Connect

  • Facebook
  • Instagram
  • Linkedin
  • Twitter
  • YouTube
© 2023 CoreLogic. All rights reserved.
  • Legal
  • Privacy Policy
  • CCPA
  • Cookie Preferences
  • Security
  • Sitemap
  • Accessibility
  • Legal
  • Privacy Policy
  • CCPA
  • Cookie Preferences
  • Security
  • Sitemap
  • Accessibility