Chat
Chat with Sales Hours: Monday-Friday 8:30 a.m. - 4:30 p.m. (CST)
Contact Sales
Call Sales Toll-Free 1-(866) 774-3282 Hours: Monday-Friday 7 a.m. - 5 p.m. (CST)
Product Login
Product Log-in
Product Support
Product Support
Email Sales
Contact Sales
After Hours
  • Support
  • Sign In Sign In
  • AUS NZ UK
CoreLogic - Home
  • Solutions
    view solutions by:

    Data Solutions

    • Lead Generation
    • Property Data
    • Location Intelligence

    Real Estate

    • Multiple Listing Enterprise
    • Agent & Broker

    Mortgage

    • Origination
    • Servicing
    • Appraisal
    • Commercial Property Tax

    Insurance

    • Hazard Risk
    • Catastrophe Risk Management
    • Risk Evaluation
    • Underwriting Automation
    • Weather Verification
    • Claims Automation
    • Restoration
    • INTRCONNECT

    Mortgage Lenders

    • Origination

    Mortgage Servicers

    • Residential Property Tax
    • Default & Loss Mitigation
    • Portfolio Insight & Monitoring

    Mortgage Appraisers

    • Appraisal

    Real Estate Agents & Brokers

    • Agents & Brokers

    Real Estate MLS

    • Multiple Listing Enterprises

    Commercial Real Estate Owners

    • Commercial Property Tax

    Marketing Departments

    • Property Data

    Insurance Underwriters

    • Risk Evaluation
    • Underwriting Automation
    • Hazard Risk
    • Catastrophe Risk Management

    Insurance Risk Managers

    • Risk Evaluation
    • Hazard Risk
    • Catastrophe Risk Management

    Insurance Claims

    • Claims Automation
    • Restoration Contractors
    • Weather Verification

    Construction Contractors

    • Restoration Contractors

    General

    • Location Intelligence
    • Lead Generation
    • Data Solutions
  • Resources

    Reports

    • Climate Change
    • Construction Cost Update
    • Construction Insights
    • Home Price Insights
    • Homeowner Equity Insights
    • Loan Performance Insight
    • Mortgage Fraud
    • Property Tax Delinquency
    • Single-Family Rent Index

    Insight Blogs

    • Hazard HQ
    • Office of Chief Economist
    • Affordable Housing
    • Homebuying
    • Insurance
    • Other Articles

    More Resources

    • Case Studies
    • White Papers
    • Podcasts
    • Quick Takes
  • Company
    • About
    • Leadership
    • Newsroom
    • Contact
    • Careers
  • Search
CoreLogic - Home
  • Solutions
  • Resources
  • Company

    • About
    • Leadership
    • Newsroom
    • Contact
    • Careers
  • Accounts

    • Products Sign-in
  • Contact

    • Sales Contact
    • Product Support
  • Regions

    • Australia
    • New Zealand
    • United Kingdom
  • Social

    • Facebook
    • Instagram
    • Linkedin
    • Twitter
    • Youtube
Solutions
VIEW BY:
  • Data Solutions

    • Lead Generation
    • Property Data
    • Location Intelligence
  • Real Estate

    • Multiple Listing Enterprise
    • Agent & Broker
  • Mortgage

    • Origination
    • Servicing
    • Appraisal
    • Commercial Property Tax
  • Insurance

    • Hazard Risk
    • Catastrophe Risk Management
    • Risk Evaluation
    • Underwriting Automation
    • Weather Verification
    • Claims Automation
    • Restoration
    • INTRCONNECT
  • Mortgage Lenders

    • Origination
  • Mortgage Servicers

    • Residential Property Tax
    • Default & Loss Mitigation
    • Portfolio Insight & Monitoring
  • Mortgage Appraisers

    • Appraisal
  • Real Estate Agents & Brokers

    • Agents & Brokers
  • Real Estate MLS

    • Multiple Listing Enterprises
  • Commercial Real Estate Owners

    • Commercial Property Tax
  • Marketing Departments

    • Property Data
  • Insurance Underwriters

    • Risk Evaluation
    • Underwriting Automation
    • Hazard Risk
    • Catastrophe Risk Management
  • Insurance Risk Managers

    • Risk Evaluation
    • Hazard Risk
    • Catastrophe Risk Management
  • Insurance Claims

    • Claims Automation
    • Restoration Contractors
    • Weather Verification
  • Construction Contractors

    • Restoration Contractors
  • General

    • Location Intelligence
    • Lead Generation
    • Data Solutions
Resources
  • Reports

    • Climate Change
    • Construction Cost Update
    • Construction Insights
    • Home Price Insights
    • Homeowner Equity Insights
    • Loan Performance Insight
    • Mortgage Fraud
    • Property Tax Delinquency
    • Single-Family Rent Index
  • Insight Blogs

    • Hazard HQ
    • Office of Chief Economist
    • Affordable Housing
    • Homebuying
    • Insurance
    • Other Articles
  • More Resources

    • Case Studies
    • White Papers
    • Podcasts
    • Quick Takes

Home / Intelligence / Reports / Home Price Insights / CoreLogic S&P Case-Shiller Home Price Index Turns the Corner Again, Up 20.4% Annually in April but Down From March

ABOUT THE AUTHOR
Selma Hepp
Selma Hepp
Chief Economist
View Profile
  • June 28, 2022

CoreLogic S&P Case-Shiller Home Price Index Turns the Corner Again, Up 20.4% Annually in April but Down From March

Monthly gain in home prices finally slows but is still at double the pre-pandemic pace

Despite the surge in mortgage interest rates and high home prices, buyers have remained resilient and continued to seek homes, keeping the market competitive. And while home sales have been slowing, the momentum in price growth since the beginning of the year is slow to adjust and will yield more notable declines only in the latter part of the year. But in April, the CoreLogic S&P Case-Shiller Home Price Index posted a 20.4% increase, indicating a tipping point after four months of accelerated growth following a winter pause. Still, April’s year-over-year increase was the strongest since the beginning of the data series (Figure 1).

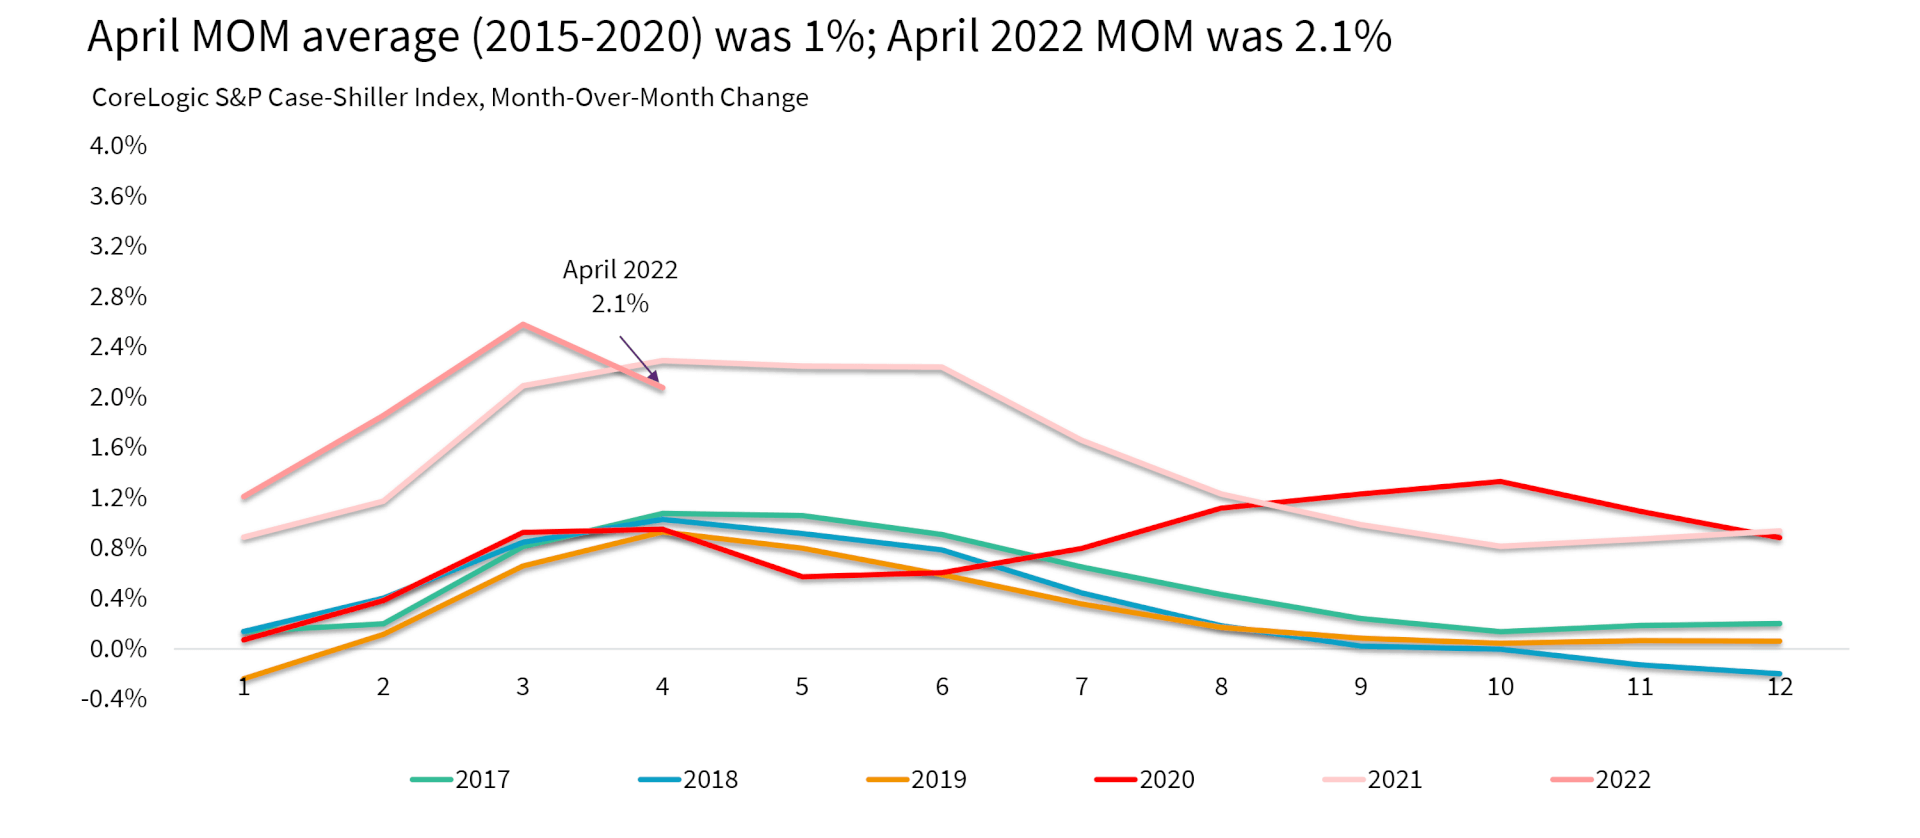
Also, the non-seasonally adjusted month-to-month index slowed as well, up 2.1% in April from a 2.6% jump in March. April’s increase was the second strongest in the data series following a 2.3% increase last April. Between 2015 and 2020, the monthly index changes from March to April averaged about 1% (Figure 2).

Nevertheless, signs of a tipping point in the housing market toward a greater balance between buyers and sellers are spreading wider, albeit only compared with some of the most competitive conditions seen since the early 2000s. More specifically, there is a buildup in overall active inventory, as fewer buyers are rushing to make offers, resulting in an increase in the number of homes that have had price reductions from the original list price.

The 10- and 20-city composite indexes remained strong and continued to accelerate, surging 19.7% and 21.2% year over year, respectively. The overall tendency for more price growth in smaller markets continues to drive the 20-city index growth higher, as buyers with larger budgets flock to smaller and more affordable areas, particularly those in the Southeast and Florida.

Figure 1: April Home Price Appreciation At a Tipping Point at 20.4%

Figure 1: April Home Price Appreciation At a Tipping Point at 20.4%
Source: CoreLogic S&P Case-Shiller Home Price Indices, not seasonally adjusted (June 28, 2022, release)
© 2022 CoreLogic,Inc., All rights reserved.

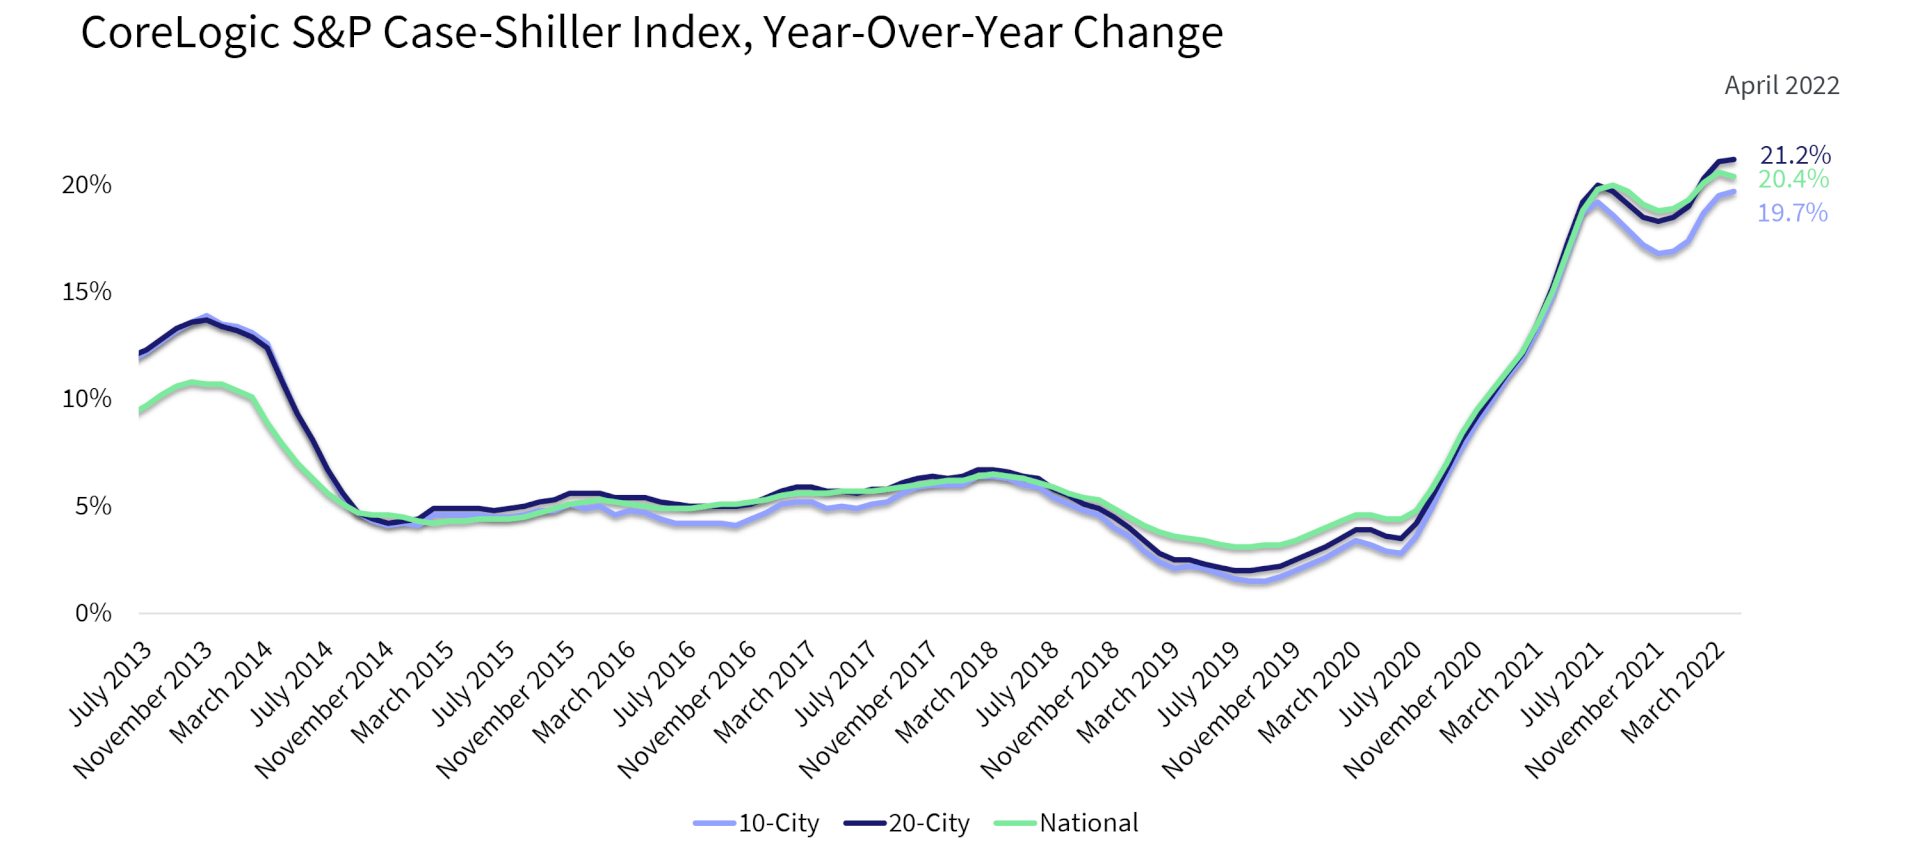
Compared with the 2006 peak, the 10-city composite is now 43% higher, while the 20-city composite is up by 51%. Adjusted for inflation, which continues to remain a serious concern, the 10-city index is now up by 3%, while the 20-city index is up by 8% compared with the 2006 peak.

Figure 2: Month-to-Month Price Growth Slowing in April but Still Second Highest in Data History for April  

Figure 2: Month-to-Month Price Growth Slowing in April but Still Second Highest in Data History for April  
Source: CoreLogic S&P Case-Shiller Home Price Indices, not seasonally adjusted (June 28, 2022, release)
© 2022 CoreLogic,Inc., All rights reserved.

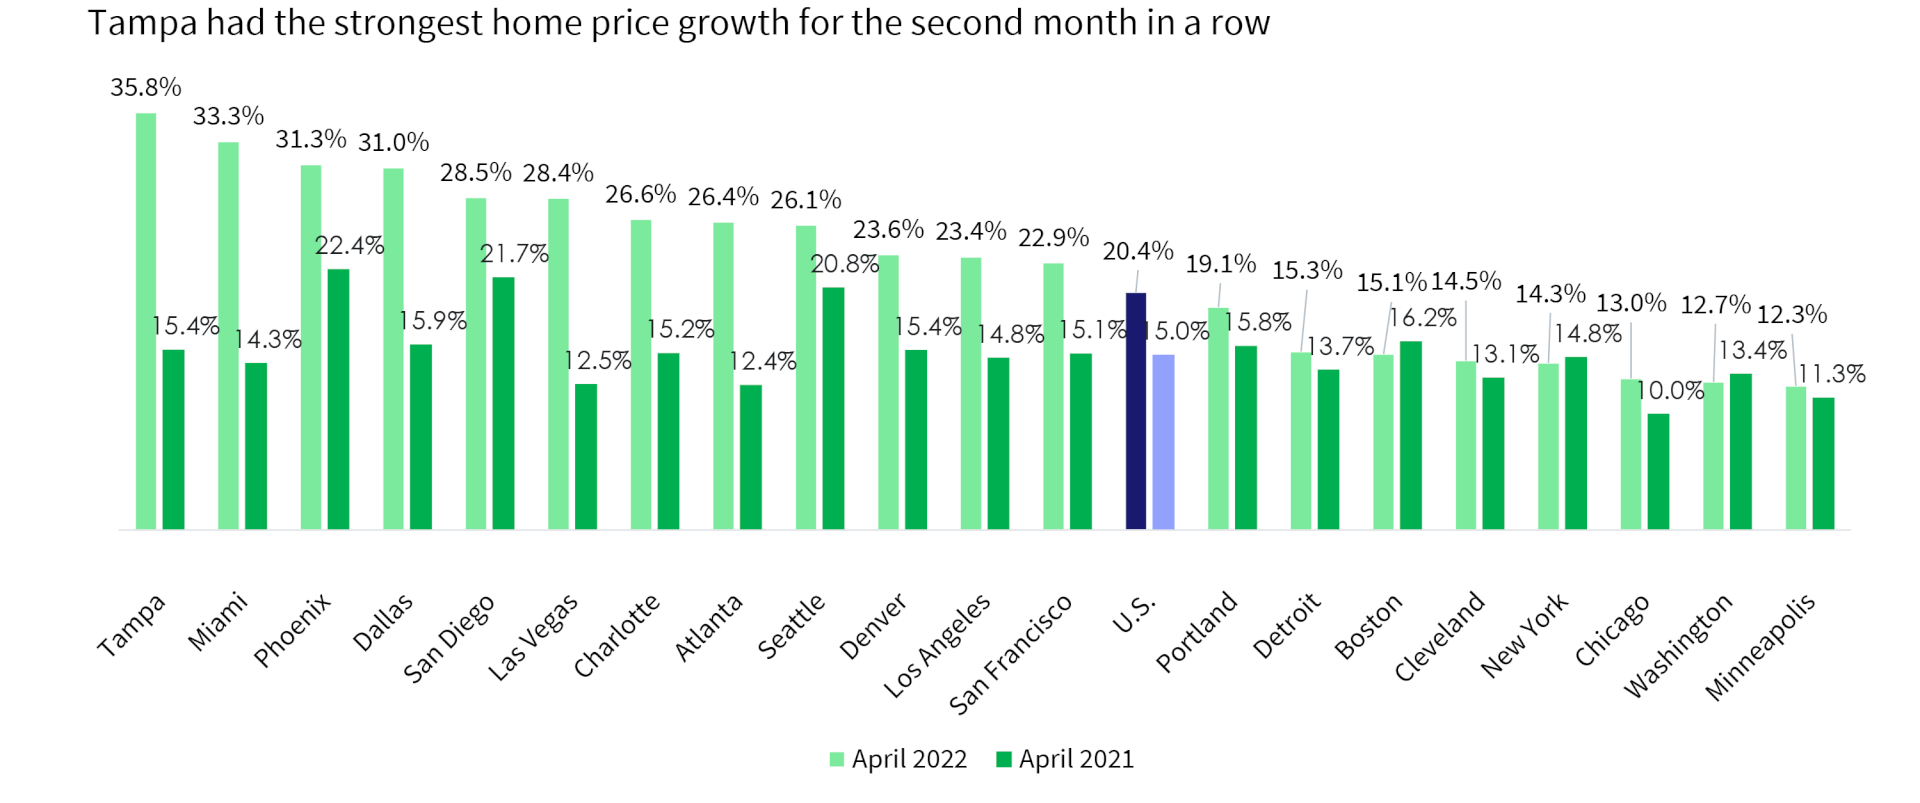
For the second month, Tampa, Florida posted the strongest annual home price growth among the 20 tracked markets, surging by 35.8% in April, up from March’s non-seasonally adjusted rate of 34.8%.

Miami ranked second, recording a 33.3% year-over-year gain in April, up from 32% the month before. Phoenix now ranks third, with a 31.3% increase in April. And while the rate of growth slowed from March, Phoenix didn’t post the largest slowdown in annual gains as it did in March.

Seattle, San Francisco and San Diego posted the largest slowdown in annual gains compared with March. On the other hand, Miami and Tampa again had the strongest acceleration in annual gains, both up by about 1 percentage point from the month prior.  

Minneapolis and Washington continued to post some of the slowest increases in annual gains, ranging from 12.3% to 13%. Despite having the slowest rate of annual price increases, these areas have still experienced double-digit growth rates for 17 consecutive months.

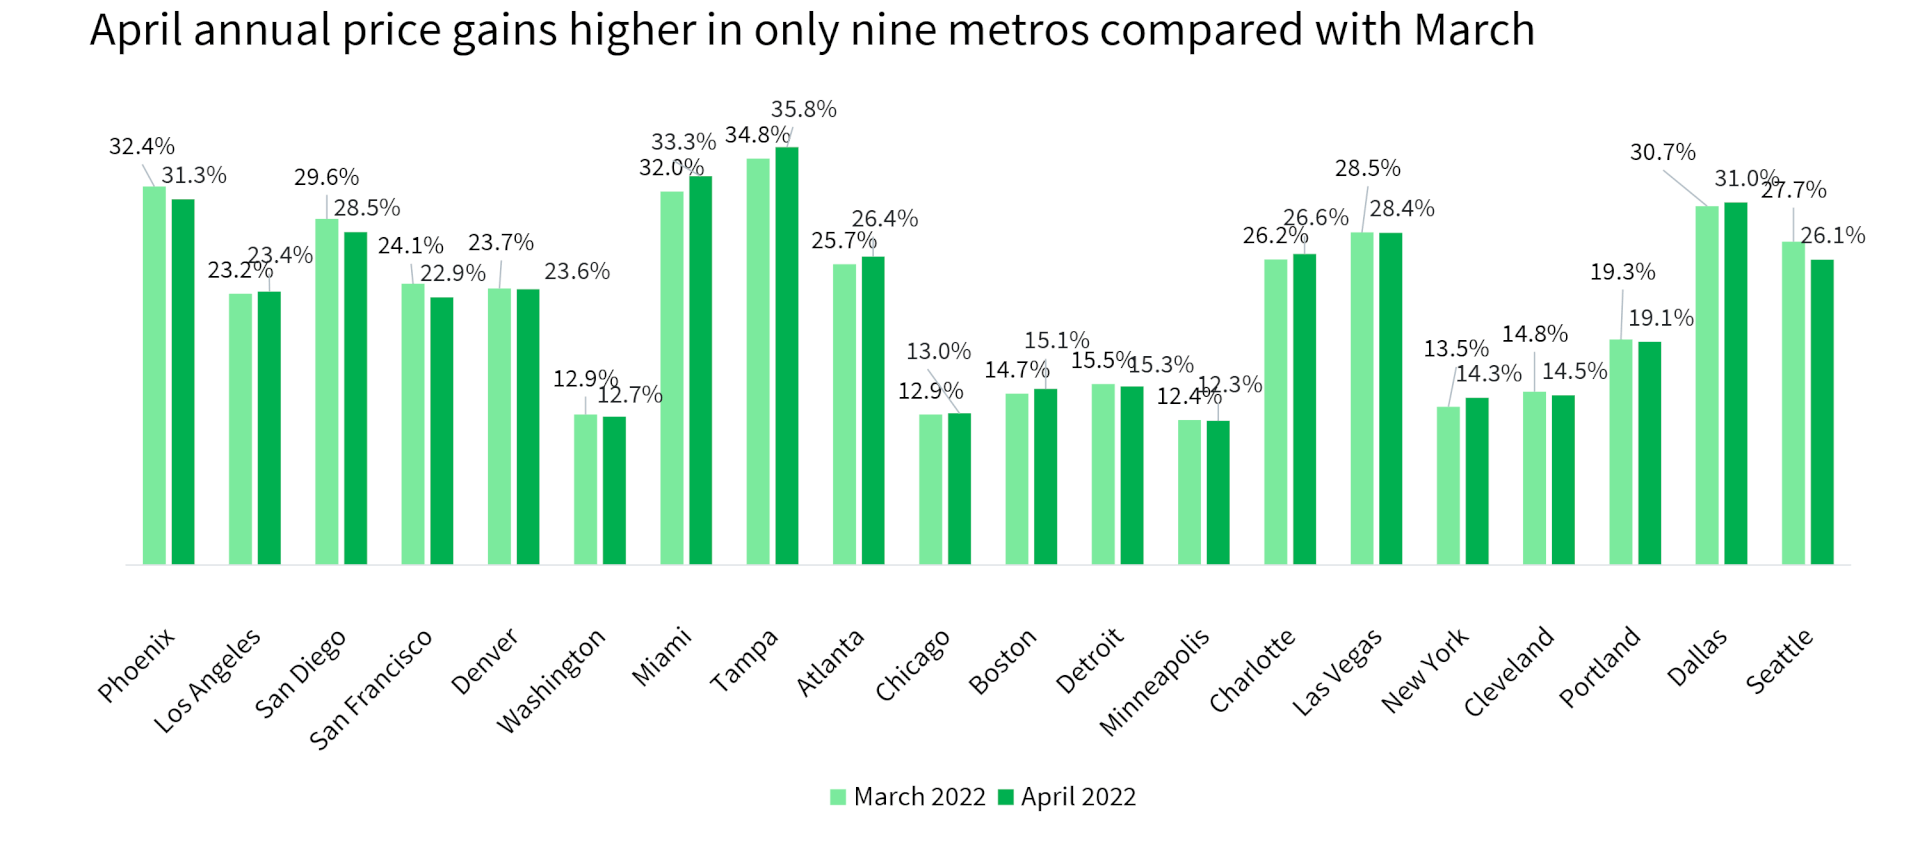
Nine out of 20 metro areas experienced an acceleration in annual gains from April, down from 17 in March. (Figure 3).

Figure 3: Deceleration in Year-Over-Year Home Price Growth in 11 Metros

Figure 3: Deceleration in Year-Over-Year Home Price Growth in 11 Metros
Source: CoreLogic S&P Case-Shiller Home Price Indices, not seasonally adjusted (June 28, 2022, release)
© 2022 CoreLogic,Inc., All rights reserved.

Compared with annual gains recorded last April, 17 metros continued to see stronger increases, while only three showed slowing annual gains. Boston posted the strongest slowdown, down by 1.1 percentage points, followed by Washington (down by 0.7 percentage points) and New York  (down by 0.5 percentage points).

On the other hand, Tampa and Miami were up by as much as 20 percentage points in just one year (Figure 4).

Figure 4: Year-Over-Year Home Price Growth Higher in 17 Metros in April Compared With 2021

Figure 4: Year-Over-Year Home Price Growth Higher in 17 Metros in April Compared With 2021
Source: CoreLogic S&P Case-Shiller Home Price Indices, not seasonally adjusted (June 28, 2022, release)
© 2022 CoreLogic,Inc., All rights reserved.

Furthermore, only the low-price tier saw acceleration in annual gains in April, up on average by 21.2%, while the middle tier slowed to 21.4% from 21.5% and the high tier remained flat at 24%. Acceleration in growth in the low tier compared with higher tiers reversed trends seen in previous months and could reflect a rush of buyers in the early months of the year prior to the mortgage rate surge. The budgets of low-tier buyers are more sensitive to changes in mortgage rates and the resulting affordability constraints.

The month-over-month comparison of home price growth by price tier and location also reveals relative changes in demand across the country. From March to April, areas with colder climates, particularly Chicago, Minneapolis and New York, continued to show smaller monthly increases. For the fifth consecutive month, all metros had at least some gains across the price tiers, although some of the growth can be attributed to seasonality since monthly increases are generally positive between March to April.

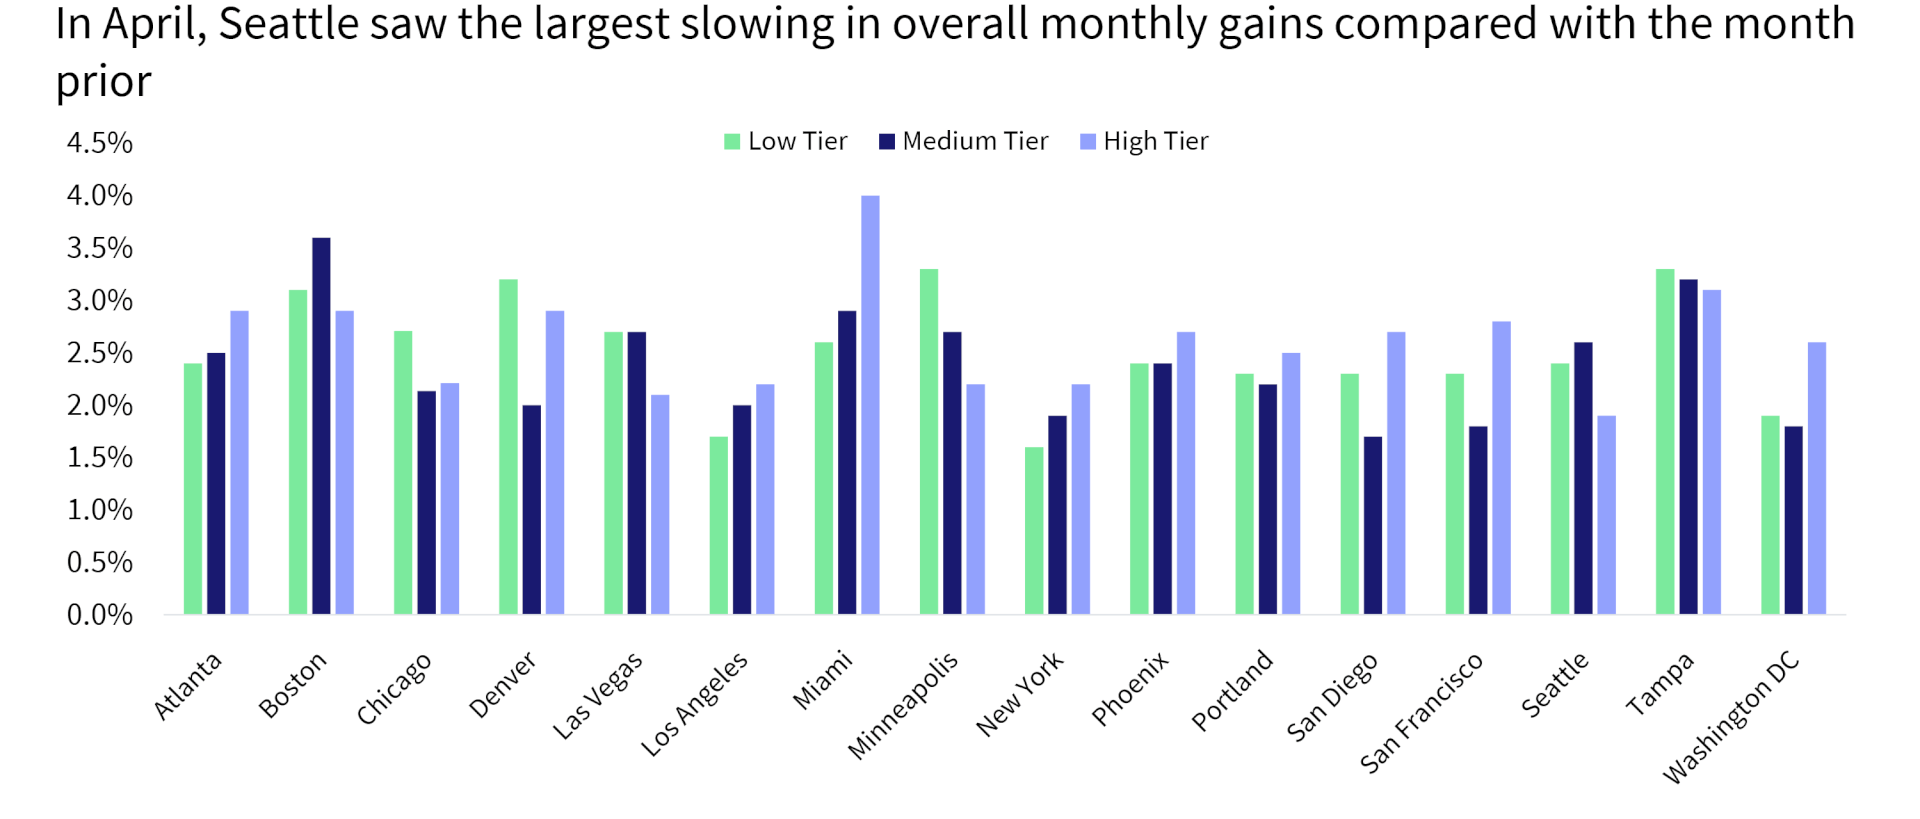
The largest monthly gains were in the South, including Miami and Tampa, which were both up notably in April. Seattle, by contrast, showed the strongest slowing in monthly gains, particularly in the high tier.

The average monthly gains among low-tier homes were up by 2.5% April, though again that number is not seasonally adjusted. The high-tier monthly gains averaged 2.6% in April. The middle-tier monthly price increases averaged 2.4% (Figure 5).

Figure 5: Monthly Price Growth Averages 2.5% for Low and 2.6% for High Tier

Figure 5: Monthly Price Growth Averages 2.5% for Low and 2.6% for High Tier
Source: CoreLogic S&P Case-Shiller Home Price Indices, not seasonally adjusted (June 28, 2022, release)
© 2022 CoreLogic,Inc., All rights reserved.

Housing markets are showing a clear indication of a tipping point away from overheated early-spring conditions. Nevertheless, while there are fears of uncertainty that come with slowing housing markets, the reality is that many potential buyers are still interested in purchasing a home, which will keep the market competitive and continue to put pressure on home prices. According to the CoreLogic HPI Forecast, home price growth will remain in mid-to-high double digits for the remainder of the year. The key will be to keep an eye on slowing monthly gains, which remain three times higher than the historical average.

  • Category: Home Price Insights, Reports
  • Tags: Case Shiller Index
ABOUT THE AUTHOR
Selma Hepp
Selma Hepp
Chief Economist
View Profile

Related Posts

Jan23CSIPromo
Home Price Insights

US CoreLogic S&P Case-Shiller Index Growth Rate Cools Further in November, Up by 7.7%

Annual U.S. home price growth continued to relax in November for the seventh straight month.

January 31, 2023
CoreLogic Reactor Tordado
Hazard HQ

January 24 EF-3 Tornado in Harris County, Texas

CoreLogic Tornado Forensics Technology captured the EF-3 tornado path that ripped through southeastern Harris County on Jan. 24 to damage homes and disrupt industrial operations.

January 31, 2023
Appraisal Waiver
Blogs

How New Appraisal Waiver Policies Affect Old Homebuying Practices

Electing to accept an appraisal waiver may make the difference between closing on a loan and getting stuck in a repeat bidding cycle.

January 27, 2023

About Corelogic

  • Newsroom
  • Leadership
  • Careers
  • Ethics & Compliance

Accounts

  • Products Sign-in

Contact

  • Sales Contact
  • Product Support

Regions

  • CoreLogic Australia
  • CoreLogic New Zealand
  • CoreLogic UK

Follow & Connect

  • Facebook
  • Instagram
  • Linkedin
  • Twitter
  • YouTube
© 2023 CoreLogic. All rights reserved.
  • Legal
  • Privacy Policy
  • CCPA
  • Security
  • Sitemap
  • Accessibility
  • Legal
  • Privacy Policy
  • CCPA
  • Security
  • Sitemap
  • Accessibility