Chat
Chat with Sales Hours: Monday-Friday 8:30 a.m. - 4:30 p.m. (CST)
Contact Sales
Call Sales Toll-Free 1-(866) 774-3282 Hours: Monday-Friday 7 a.m. - 5 p.m. (CST)
Product Login
Product Log-in
Product Support
Product Support
Email Sales
Contact Sales
After Hours
  • Support
  • Sign In Sign In
  • AUS NZ UK
CoreLogic - Home
  • Solutions
    view solutions by:

    Data Solutions

    • Lead Generation
    • Property Data
    • Location Intelligence

    Real Estate

    • Multiple Listing Enterprise
    • Agent & Broker

    Mortgage

    • Origination
    • Servicing
    • Appraisal
    • Commercial Property Tax

    Insurance

    • Hazard Risk
    • Catastrophe Risk Management
    • Risk Evaluation
    • Underwriting Automation
    • Weather
    • Claims Automation
    • Restoration
    • INTRCONNECT

    Mortgage Lenders

    • Origination

    Mortgage Servicers

    • Residential Property Tax
    • Default & Loss Mitigation
    • Portfolio Insight & Monitoring

    Mortgage Appraisers

    • Appraisal

    Real Estate Agents & Brokers

    • Agents & Brokers

    Real Estate MLS

    • Multiple Listing Enterprises

    Commercial Real Estate Owners

    • Commercial Property Tax

    Marketing Departments

    • Property Data

    Insurance Underwriters

    • Risk Evaluation
    • Underwriting Automation
    • Hazard Risk
    • Catastrophe Risk Management

    Insurance Risk Managers

    • Risk Evaluation
    • Hazard Risk
    • Catastrophe Risk Management

    Insurance Claims

    • Claims Automation
    • Restoration Contractors
    • Weather Verification

    Construction Contractors

    • Restoration Contractors

    General

    • Location Intelligence
    • Lead Generation
    • Data Solutions
  • Resources

    Reports

    • Climate Change
    • Construction Cost Update
    • Construction Insights
    • Home Price Insights
    • Homeowner Equity Insights
    • Loan Performance Insight
    • Mortgage Fraud
    • Property Tax Delinquency
    • Single-Family Rent Index

    Insight Blogs

    • Hazard HQ
    • Office of Chief Economist
    • Affordable Housing
    • Homebuying
    • Insurance
    • Other Articles

    More Resources

    • Events
    • Case Studies
    • White Papers
    • Podcasts
    • Quick Takes
  • Company
    • About
    • Leadership
    • Newsroom
    • Contact
    • Careers
  • Search
CoreLogic - Home
  • Solutions
  • Resources
  • Company

    • About
    • Leadership
    • Newsroom
    • Contact
    • Careers
  • Accounts

    • Products Sign-in
  • Contact

    • Sales Contact
    • Product Support
  • Regions

    • Australia
    • New Zealand
    • United Kingdom
  • Social

    • Facebook
    • Instagram
    • Linkedin
    • Twitter
    • Youtube
Solutions
VIEW BY:
  • Data Solutions

    • Lead Generation
    • Property Data
    • Location Intelligence
  • Real Estate

    • Multiple Listing Enterprise
    • Agent & Broker
  • Mortgage

    • Origination
    • Servicing
    • Appraisal
    • Commercial Property Tax
  • Insurance

    • Hazard Risk
    • Catastrophe Risk Management
    • Risk Evaluation
    • Underwriting Automation
    • Weather
    • Claims Automation
    • Restoration
    • INTRCONNECT
  • Mortgage Lenders

    • Origination
  • Mortgage Servicers

    • Residential Property Tax
    • Default & Loss Mitigation
    • Portfolio Insight & Monitoring
  • Mortgage Appraisers

    • Appraisal
  • Real Estate Agents & Brokers

    • Agents & Brokers
  • Real Estate MLS

    • Multiple Listing Enterprises
  • Commercial Real Estate Owners

    • Commercial Property Tax
  • Marketing Departments

    • Property Data
  • Insurance Underwriters

    • Risk Evaluation
    • Underwriting Automation
    • Hazard Risk
    • Catastrophe Risk Management
  • Insurance Risk Managers

    • Risk Evaluation
    • Hazard Risk
    • Catastrophe Risk Management
  • Insurance Claims

    • Claims Automation
    • Restoration Contractors
    • Weather Verification
  • Construction Contractors

    • Restoration Contractors
  • General

    • Location Intelligence
    • Lead Generation
    • Data Solutions
Resources
  • Reports

    • Climate Change
    • Construction Cost Update
    • Construction Insights
    • Home Price Insights
    • Homeowner Equity Insights
    • Loan Performance Insight
    • Mortgage Fraud
    • Property Tax Delinquency
    • Single-Family Rent Index
  • Insight Blogs

    • Hazard HQ
    • Office of Chief Economist
    • Affordable Housing
    • Homebuying
    • Insurance
    • Other Articles
  • More Resources

    • Events
    • Case Studies
    • White Papers
    • Podcasts
    • Quick Takes

Home / Intelligence / The Impact of Flood Risk on Property Values

ABOUT THE AUTHOR
Bin He
Bin He
Executive, Science & Analytics
View Profile
  • November 11, 2022

The Impact of Flood Risk on Property Values

Part II: Home Value Declines as Flood Risk Increases in Miami, FL and Harris County, TX

In the first blog of this series1, regression results suggested that locations within a flood zone reduced property values in Miami, Florida. However, within the same flood zone, the risk of a property being flooded may vary depending on factors such as elevation and distance to water. The Federal Emergency Management Agency (FEMA) recognized that the risk was not based on the static measurement and on Oct. 1, 2021, began to phase in a new pricing methodology called Risk Rating 2.0 to better reflect a property’s flood risk. The higher the flood risk, the more it costs the owner to insure the property. Important to this conversation is the understanding that a property located outside of a flood zone does not equate to no risk of flooding. Following Hurricane Harvey in 2017, CoreLogic performed a study that showed 70% of the flood damage was outside the Special Flood Hazard Area (SFHA). Monitoring other events and discussions with FEMA led to the understanding that most (more than 50%) flood damage is typically outside the SFHA. A simple “in” and “out” of flood zones is an oversimplification that does not differentiate between levels of risk. In this study, we analyzed the impact of flood risk on property values beyond the traditional in/out of flood zones by using a more granular flood risk score developed by CoreLogic.

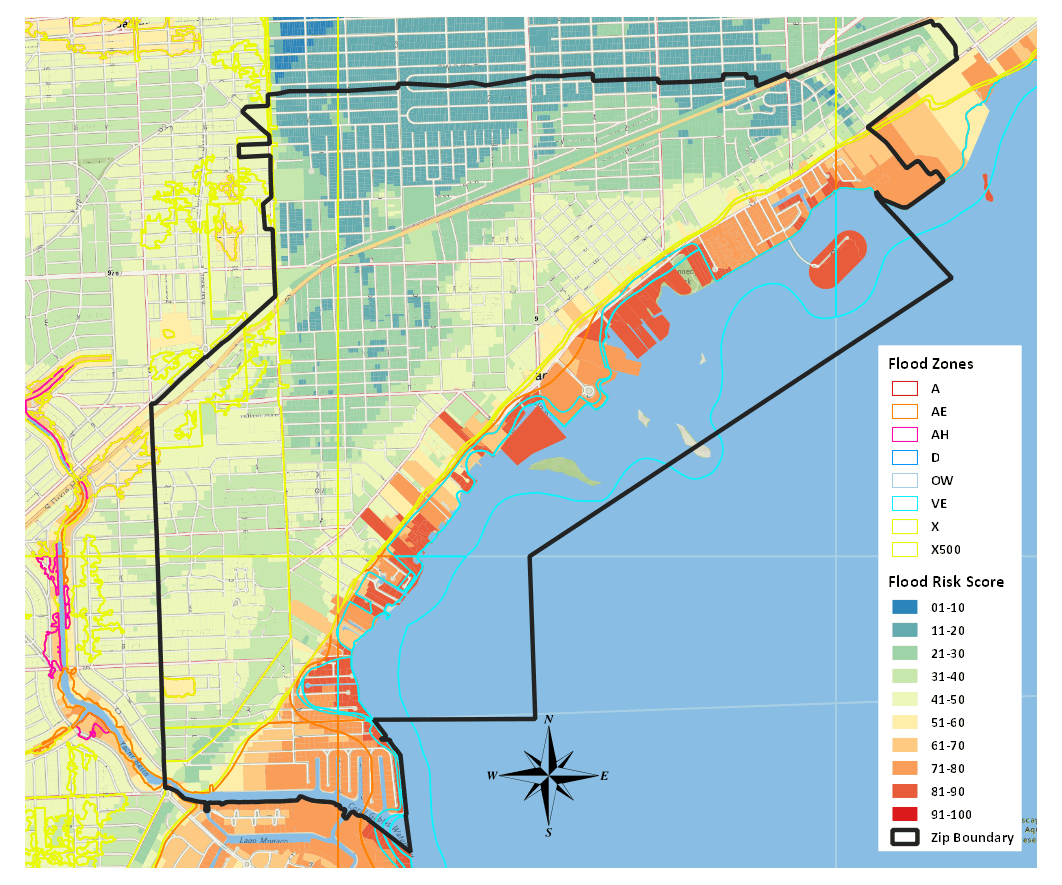
The CoreLogic Flood Risk Score (FRS) combines federal flood zones with hydrological science and critical risk data. The FRS provides a precise and graduated risk assessment that distinguishes incremental levels of risk for properties both “in” and “out” of designated floodplains. The higher the score, the higher the flood risk. Figure 1 shows FRS overlying flood zones for ZIP code 33133 in Miami. As you can see from the chart, there are high-risk areas outside the SFHA boundaries as well as different levels of risk inside the SFHA areas.

Figure 1: Flood Risk Score Overlying FEMA Flood Zones

Figure 1: Flood Risk Score overlying FEMA Flood Zones
Source: CoreLogic, Inc.
© 2022 CoreLogic,Inc., All rights reserved.

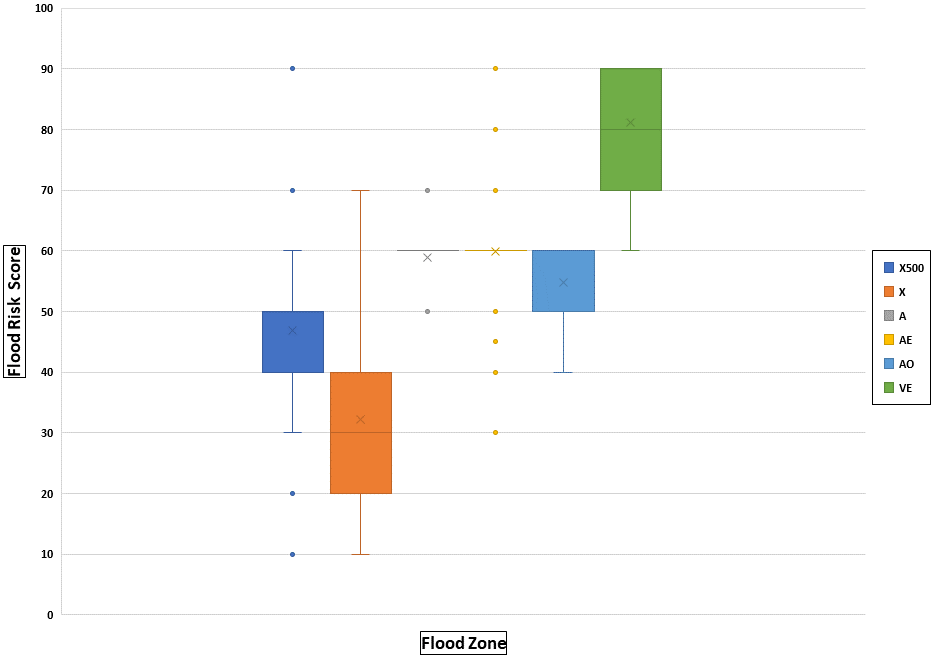
The property sale data used in this analysis included transactions since 2011. The data source is the CoreLogic property database, including address, sale price, property attributes and geospatial information. The sale transactions were merged with FRS. Figure 2 shows the FRS distribution by flood zones. Flood zone VE has additional risks associated with storm surge, so it has the highest average FRS. However, risk variations exist inside zone VE as FRS ranges from 60 to 90. Zone X is outside of flood zones, but the risk can be as high as 60 FRS in Miami and 70 in Harris, Texas.

Figure 2a: Flood Risk Score Distribution – Miami-Dade County

Figure 2a: Flood Risk Score Distribution - Miami-Dade County
Source: CoreLogic, Inc.
© 2022 CoreLogic,Inc., All rights reserved.

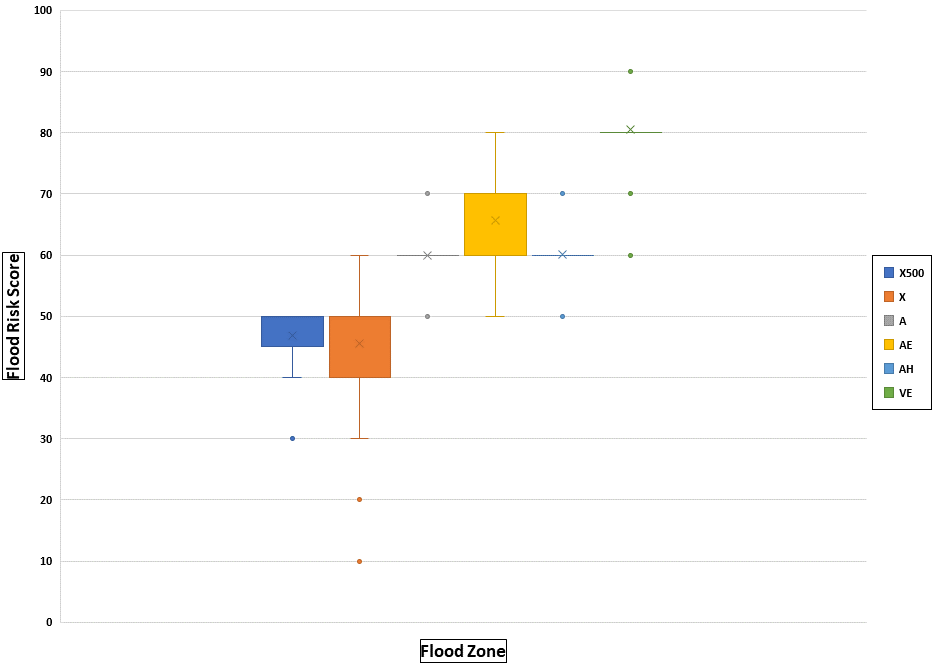
Figure 2b: Flood Risk Score Distribution – Harris County

Figure 2b: FRS distribution - Harris County
Source: CoreLogic, Inc.
© 2022 CoreLogic,Inc., All rights reserved.

A hedonic model was used to regress price/sq.ft. on FRS, property attributes, time dimensions and geospatial information to explore the effect of flood risk on property values while controlling for other factors.

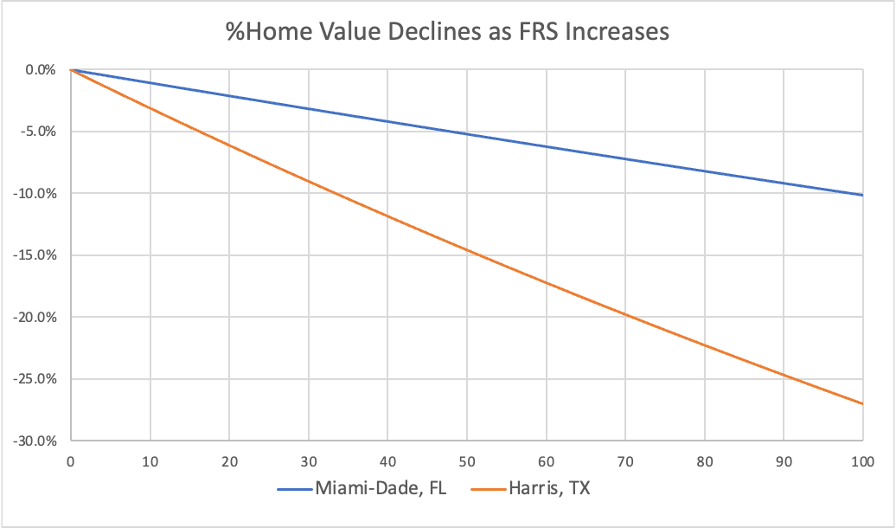
Figure 3 shows the home price drops as FRS goes up in Miami-Dade County, Florida and Harris County, Texas. In Miami, for every 10-point increase in FRS, a home would sell for about 1% less; in Harris, for every 10-point increase in FRS, a home would sell for about 2.7% less, everything else equal. A $300k home would be worth $288k in Miami, Florida, and only $268k in Harris, Texas if its FRS went from 40 to 80 due to increased climate risk, which lenders and originators typically do not consider.

Figure 3: Home Value Declines as FRS Increases in Miami, FL and Harris TX

Figure 3: Home value declines as FRS increases in Miami, FL and Harris TX
Source: CoreLogic, Inc.
© 2022 CoreLogic,Inc., All rights reserved.

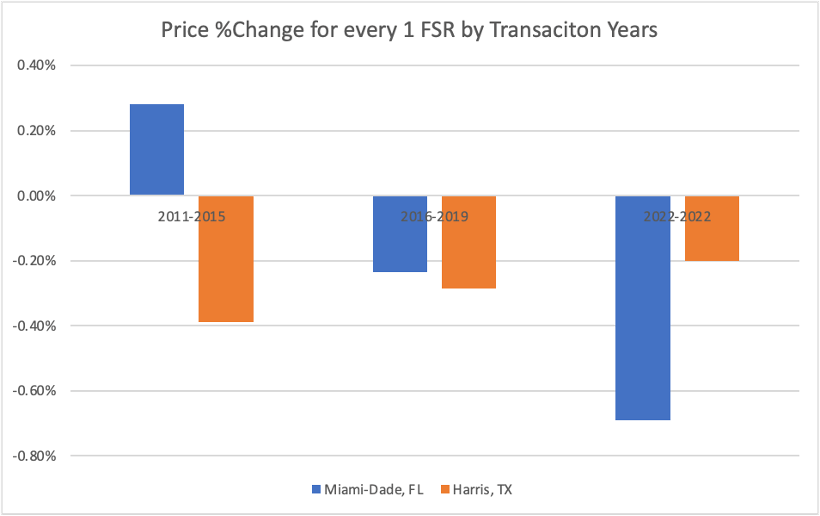
Natural hazard risk in the United States is on the rise. According to the National Centers for Environmental Information, the annual average number of events with losses exceeding $1 billion for the most recent five years (2017-2021) is 17.8 events, which is more than twice the average of 7.7 events for the past 40 years. There are more articles and discussions on climate risk now than in previous years. To find out how people’s perceptions of flood risk might have changed over time, we interacted the year of transactions with FRS in our regression. Figure 3 shows the price percentage change for every point increase in FRS by transaction years. In Miami, Florida, between 2011 and 2015, buyers valued the positive amenities of being close to water more than the negative impact of flood risk, hence the positive price change as FRS went up. After 2016, buyers became more aware of flood risk, and as a result, they asked for discounts as FRS increased. In Harris, Texas, the dynamic is different as people’s perceptions of flood risk are more consistent over the past 11 years than in Miami. Housing is local, and different communities weigh the risk of flooding and the positive amenities of being close to water differently.

Figure 4: Price Change for Every 1 FRS Increase by Transaction Years

Figure 4: Price Change for every 1 FRS increase by Transaction Years
Source: CoreLogic, Inc.
© 2022 CoreLogic,Inc., All rights reserved.

Collateral value is critical in loan origination and portfolio management, so it is crucial for homeowners, mortgage lenders, insurers and policymakers to understand the holistic impact of natural hazard risk — specifically climate risk — on property values. CoreLogic projected more than 1.2 feet of sea level rise at several Miami locations in 2050 under the high-emissions RCP 8.5 climate risk scenario3. According to a 2021 FEMA flood insurance study4, a 1.2-foot sea level rise would be sufficient to push 100-year still-water elevations to a 50-year level, doubling the flood frequency in Miami areas. If RCP 8.5 occurs in 2050, it would be enough to create flood risk upward shifting as described above, which our research indicates will lead to further reductions in property values.

A proactive approach to this challenge — and its effect on the housing market — will be critical in promoting a healthy housing ecosystem. In a future series of blogs, we will explore the impact of climate scenarios on property values outlined by the Intergovernmental Panel on Climate Change (IPCC).

Jay Liu, Wei Du, Rajendra Anjanappa and Manjunath Halemane contributed to this blog

1 https://www.corelogic.com/intelligence/the-impact-of-flood-risk-on-property-values-a-case-study-in-miami/

2 https://www.corelogic.com/intelligence/protecting-vulnerable-communities-two-major-opportunities-to-insure-flood/

3 RCP refers to Representative Concentration Pathways. RCP 8.5 pathway delivers a temperature increase of about 4.3 Celsius degrees by 2100.

4 FLOOD INSURANCE STUDY NUMBER 12086CV001B Version Number 2.6.3.5

© 2022 CoreLogic,Inc., All rights reserved.
  • Category: Blogs, Hazard HQ, Intelligence
  • Tags: Climate Change, Flood Risk, Hurricane Risk
ABOUT THE AUTHOR
Bin He
Bin He
Executive, Science & Analytics
View Profile

Related Posts

Tornado footprints in Southern California captured by CoreLogic's weather verification technology as viewed in CoreLogic Reactor™.
Blogs

A Rare Los Angeles Tornado and Near Hurricane-Force Winds in San Francisco

CoreLogic Weather Verification Services captured wind and tornado footprints from the severe weather system in California.

March 24, 2023
atmospheric rivers california
Core Conversations

What Was it Really Like to Live Through the California Floods? Our Team Spills

A Conversation With Kent David and Tom Larsen Since the beginning of the year, California has been drenched by atmospheric rivers. The flooding in California

March 22, 2023
Ecuador earthquake
Blogs

M6.8 Earthquake Near the Coast of Ecuador

CoreLogic estimates that insurable losses from the Ecuador earthquake will be up to $600 million.

March 21, 2023

About Corelogic

  • Newsroom
  • Leadership
  • Careers
  • Ethics & Compliance

Accounts

  • Products Sign-in

Contact

  • Sales Contact
  • Product Support

Regions

  • CoreLogic Australia
  • CoreLogic New Zealand
  • CoreLogic UK

Follow & Connect

  • Facebook
  • Instagram
  • Linkedin
  • Twitter
  • YouTube
© 2023 CoreLogic. All rights reserved.
  • Legal
  • Privacy Policy
  • CCPA
  • Cookie Preferences
  • Security
  • Sitemap
  • Accessibility
  • Legal
  • Privacy Policy
  • CCPA
  • Cookie Preferences
  • Security
  • Sitemap
  • Accessibility