Chat
Chat with Sales Hours: Monday-Friday 8:30 a.m. - 4:30 p.m. (CST)
Contact Sales
Call Sales Toll-Free 1-(866) 774-3282 Hours: Monday-Friday 7 a.m. - 5 p.m. (CST)
Product Login
Product Log-in
Product Support
Product Support
Email Sales
Contact Sales
After Hours
  • Support
  • Sign In Sign In
  • AUS NZ UK
CoreLogic - Home
  • Solutions
    view solutions by:

    Data Solutions

    • Lead Generation
    • Property Data
    • Location Intelligence

    Real Estate

    • Multiple Listing Enterprise
    • Agent & Broker

    Mortgage

    • Origination
    • Servicing
    • Appraisal
    • Commercial Property Tax

    Insurance

    • Hazard Risk
    • Catastrophe Risk Management
    • Risk Evaluation
    • Underwriting Automation
    • Weather
    • Claims Automation
    • Restoration
    • INTRCONNECT

    Mortgage Lenders

    • Origination

    Mortgage Servicers

    • Residential Property Tax
    • Default & Loss Mitigation
    • Portfolio Insight & Monitoring

    Mortgage Appraisers

    • Appraisal

    Real Estate Agents & Brokers

    • Agents & Brokers

    Real Estate MLS

    • Multiple Listing Enterprises

    Commercial Real Estate Owners

    • Commercial Property Tax

    Marketing Departments

    • Property Data

    Insurance Underwriters

    • Risk Evaluation
    • Underwriting Automation
    • Hazard Risk
    • Catastrophe Risk Management

    Insurance Risk Managers

    • Risk Evaluation
    • Hazard Risk
    • Catastrophe Risk Management

    Insurance Claims

    • Claims Automation
    • Restoration Contractors
    • Weather Verification

    Construction Contractors

    • Restoration Contractors

    General

    • Location Intelligence
    • Lead Generation
    • Data Solutions
  • Resources

    Reports

    • Climate Change
    • Construction Cost Update
    • Construction Insights
    • Home Price Insights
    • Homeowner Equity Insights
    • Loan Performance Insight
    • Mortgage Fraud
    • Property Tax Delinquency
    • Single-Family Rent Index

    Insight Blogs

    • Hazard HQ
    • Office of Chief Economist
    • Affordable Housing
    • Homebuying
    • Insurance
    • Other Articles

    More Resources

    • Events
    • Case Studies
    • White Papers
    • Podcasts
    • Quick Takes
  • Company
    • About
    • Leadership
    • Newsroom
    • Contact
    • Careers
  • Search
CoreLogic - Home
  • Solutions
  • Resources
  • Company

    • About
    • Leadership
    • Newsroom
    • Contact
    • Careers
  • Accounts

    • Products Sign-in
  • Contact

    • Sales Contact
    • Product Support
  • Regions

    • Australia
    • New Zealand
    • United Kingdom
  • Social

    • Facebook
    • Instagram
    • Linkedin
    • Twitter
    • Youtube
Solutions
VIEW BY:
  • Data Solutions

    • Lead Generation
    • Property Data
    • Location Intelligence
  • Real Estate

    • Multiple Listing Enterprise
    • Agent & Broker
  • Mortgage

    • Origination
    • Servicing
    • Appraisal
    • Commercial Property Tax
  • Insurance

    • Hazard Risk
    • Catastrophe Risk Management
    • Risk Evaluation
    • Underwriting Automation
    • Weather
    • Claims Automation
    • Restoration
    • INTRCONNECT
  • Mortgage Lenders

    • Origination
  • Mortgage Servicers

    • Residential Property Tax
    • Default & Loss Mitigation
    • Portfolio Insight & Monitoring
  • Mortgage Appraisers

    • Appraisal
  • Real Estate Agents & Brokers

    • Agents & Brokers
  • Real Estate MLS

    • Multiple Listing Enterprises
  • Commercial Real Estate Owners

    • Commercial Property Tax
  • Marketing Departments

    • Property Data
  • Insurance Underwriters

    • Risk Evaluation
    • Underwriting Automation
    • Hazard Risk
    • Catastrophe Risk Management
  • Insurance Risk Managers

    • Risk Evaluation
    • Hazard Risk
    • Catastrophe Risk Management
  • Insurance Claims

    • Claims Automation
    • Restoration Contractors
    • Weather Verification
  • Construction Contractors

    • Restoration Contractors
  • General

    • Location Intelligence
    • Lead Generation
    • Data Solutions
Resources
  • Reports

    • Climate Change
    • Construction Cost Update
    • Construction Insights
    • Home Price Insights
    • Homeowner Equity Insights
    • Loan Performance Insight
    • Mortgage Fraud
    • Property Tax Delinquency
    • Single-Family Rent Index
  • Insight Blogs

    • Hazard HQ
    • Office of Chief Economist
    • Affordable Housing
    • Homebuying
    • Insurance
    • Other Articles
  • More Resources

    • Events
    • Case Studies
    • White Papers
    • Podcasts
    • Quick Takes

Home / Intelligence / Blogs / Hazard HQ / The Winds of Change are Blowing

ABOUT THE AUTHOR
Hazard HQ Team
Hazard HQ Team
View Profile
  • October 19, 2015

The Winds of Change are Blowing

Technology Tracks Wind at the Property Level, Providing More Precise Data

Everyone knows Chicago is the Windy City, or is it? According to new data released today by CoreLogic® that measures wind activity at the metro level, it turns out Jackson, MS, a city less than 15 percent the size of Chicago, claims the spot as the windiest city in the United States. The CoreLogic Windy City Ranking provides a national ranking of the nation’s windiest cities. The ranking is generated by calculating the total force caused by all severe wind gusts of 60 mph or more for every wind event dating back to January 2006 and, in addition, accounts for the total number of wind events over those nine years. A total of 293 cities with populations of 100,000 or more was analyzed with data captured at the city center plus a 10-mile radius. The analysis provides a numerical score ranging from 1-100 for each of these cities. Despite its moniker as “The Windy City,” Chicago ranks 50th among all 293 cities.

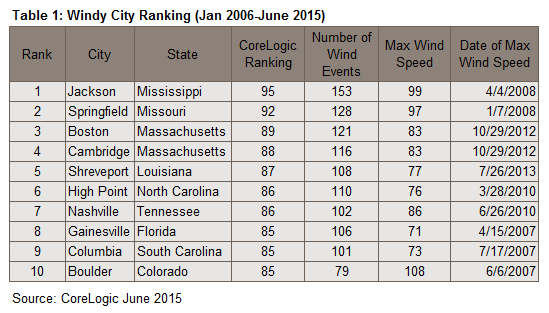
Data from January 2006 to June 2015 show that, overall, Jackson, MS ranks as the windiest city, followed by Springfield, MO, Boston, Cambridge, MA and Shreveport, LA (Table 1). Four cities surpassed wind speeds of 100 mph, including Reno (126 mph), Boulder, CO (108 mph), Westminster, CO (108 mph) and Round Rock, TX (103 mph). The data includes wind activity associated with hurricanes, thunderstorms, straight-line winds, Chinooks, Santa Ana winds, coastal lows and “derechos,” which are widespread, long-lived straight-line wind storms.

But why care about which city has the most wind events or where straight-line winds occur versus a coastal low. For those in the insurance business, it’s critically important to measure this ubiquitous, but ever-present natural hazard. And like most natural hazards, assessing risk and post-event damage is only enhanced when it can be done at the property level and with advanced modeling techniques. An increase in claims, shifts in geographic losses and some climate change-related state mandates have led many in the industry to revisit the increased financial risk posed by severe wind and hail events. Industry estimates indicate that damage from wind events accounts for approximately 20 to 30 percent of insurance claims. With such a significant percentage of insurance claims attributed to wind, it’s more important than ever to get the measurement science right.

More timely and location-specific assessment for wind activity is a much-needed breakthrough for the insurance industry. Wind is one of nature’s most difficult hazards to measure, and for the past century, the industry has depended on unreliable sources. Wind speeds and direction reported from an airport weather vane can be 20-100 miles away from where a specific wind event occurred and do not represent actual conditions and storm impact at the property level. Wind speeds can vary dramatically over very short distances because of variance in topography and land use. Three-dimensional storm models, storm-tracking models and leading-edge artificial intelligence models with radar data, on-the-ground observations and actual damage reports are all part of the new paradigm in measuring wind activity. The ability to generate wind verification data and analysis using new technology and scientific observation will lead to more efficient and effective claims, which reduces time, mitigates fraud and improves bottom-line results for claims adjusters.

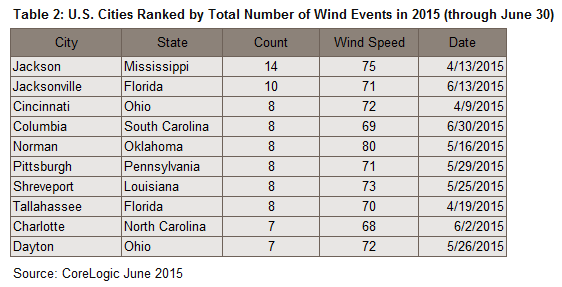
The CoreLogic Windy City Ranking uses local-level data to understand more broad geographic trends. For instance, the analysis concludes that the highest straight-line wind speeds so far this year have been recorded on the West Coast, while the most wind events have occurred east of the Rocky Mountains. In addition to its overall top spot as the windiest city over the nine-year timeframe, Jackson has also recorded the most wind events for the first six months of 2015, with 14. The top 10 cities with the greatest number of wind events in the first half of 2015 are all located east of the Rocky Mountains: Jackson, MS; Jacksonville, FL; Cincinnati, OH; Columbia, SC; Norman, OK; Pittsburgh, PA; Shreveport, LA; Tallahassee, FL; Charlotte, NC; and Dayton, OH (Table 2).

Despite Jackson’s high ranking with wind activity, typically cities in the western portion of the country are windier because high mountainous terrains such as the Sierra Nevada and Rocky Mountains have the capability to produce infrequent, but elevated wind speeds. The cities with the strongest straight-line winds tend to be adjacent to large mountain ranges prone to winter wind storms, which although infrequent, can be powerful.

As the Chinese proverb states: “When the winds of change blow, some people build walls and others build windmills.” And still others build scientific models to understand this hard-to-grasp natural hazard, which can fly a kite or cause widespread destruction.

© 2015 CoreLogic, Inc. All rights reserved.

  • Category: Blogs, Hazard HQ, Intelligence
ABOUT THE AUTHOR
Hazard HQ Team
Hazard HQ Team
View Profile

Related Posts

Tornado footprints in Southern California captured by CoreLogic's weather verification technology as viewed in CoreLogic Reactor™.
Blogs

A Rare Los Angeles Tornado and Near Hurricane-Force Winds in San Francisco

CoreLogic Weather Verification Services captured wind and tornado footprints from the severe weather system in California.

March 24, 2023
atmospheric rivers california
Core Conversations

What Was it Really Like to Live Through the California Floods? Our Team Spills

A Conversation With Kent David and Tom Larsen Since the beginning of the year, California has been drenched by atmospheric rivers. The flooding in California

March 22, 2023
Ecuador earthquake
Blogs

M6.8 Earthquake Near the Coast of Ecuador

CoreLogic estimates that insurable losses from the Ecuador earthquake will be up to $600 million.

March 21, 2023

About Corelogic

  • Newsroom
  • Leadership
  • Careers
  • Ethics & Compliance

Accounts

  • Products Sign-in

Contact

  • Sales Contact
  • Product Support

Regions

  • CoreLogic Australia
  • CoreLogic New Zealand
  • CoreLogic UK

Follow & Connect

  • Facebook
  • Instagram
  • Linkedin
  • Twitter
  • YouTube
© 2023 CoreLogic. All rights reserved.
  • Legal
  • Privacy Policy
  • CCPA
  • Cookie Preferences
  • Security
  • Sitemap
  • Accessibility
  • Legal
  • Privacy Policy
  • CCPA
  • Cookie Preferences
  • Security
  • Sitemap
  • Accessibility