Chat
Chat with Sales Hours: Monday-Friday 8:30 a.m. - 4:30 p.m. (CST)
Contact Sales
Call Sales Toll-Free 1-(866) 774-3282 Hours: Monday-Friday 7 a.m. - 5 p.m. (CST)
Product Login
Product Log-in
Product Support
Product Support
Email Sales
Contact Sales
After Hours
  • Support
  • Sign In Sign In
  • AUS NZ UK
CoreLogic - Home
  • Solutions
    view solutions by:

    Data Solutions

    • Lead Generation
    • Property Data
    • Location Intelligence

    Real Estate

    • Multiple Listing Enterprise
    • Agent & Broker

    Mortgage

    • Origination
    • Servicing
    • Appraisal
    • Commercial Property Tax

    Insurance

    • Hazard Risk
    • Catastrophe Risk Management
    • Risk Evaluation
    • Underwriting Automation
    • Weather
    • Claims Automation
    • Restoration
    • INTRCONNECT

    Mortgage Lenders

    • Origination

    Mortgage Servicers

    • Residential Property Tax
    • Default & Loss Mitigation
    • Portfolio Insight & Monitoring

    Mortgage Appraisers

    • Appraisal

    Real Estate Agents & Brokers

    • Agents & Brokers

    Real Estate MLS

    • Multiple Listing Enterprises

    Commercial Real Estate Owners

    • Commercial Property Tax

    Marketing Departments

    • Property Data

    Insurance Underwriters

    • Risk Evaluation
    • Underwriting Automation
    • Hazard Risk
    • Catastrophe Risk Management

    Insurance Risk Managers

    • Risk Evaluation
    • Hazard Risk
    • Catastrophe Risk Management

    Insurance Claims

    • Claims Automation
    • Restoration Contractors
    • Weather Verification

    Construction Contractors

    • Restoration Contractors

    General

    • Location Intelligence
    • Lead Generation
    • Data Solutions
  • Resources

    Reports

    • Climate Change
    • Construction Cost Update
    • Construction Insights
    • Home Price Insights
    • Homeowner Equity Insights
    • Loan Performance Insight
    • Mortgage Fraud
    • Property Tax Delinquency
    • Single-Family Rent Index

    Insight Blogs

    • Hazard HQ
    • Office of Chief Economist
    • Affordable Housing
    • Homebuying
    • Insurance
    • Other Articles

    More Resources

    • Events
    • Case Studies
    • White Papers
    • Podcasts
    • Quick Takes
  • Company
    • About
    • Leadership
    • Newsroom
    • Contact
    • Careers
  • Search
CoreLogic - Home
  • Solutions
  • Resources
  • Company

    • About
    • Leadership
    • Newsroom
    • Contact
    • Careers
  • Accounts

    • Products Sign-in
  • Contact

    • Sales Contact
    • Product Support
  • Regions

    • Australia
    • New Zealand
    • United Kingdom
  • Social

    • Facebook
    • Instagram
    • Linkedin
    • Twitter
    • Youtube
Solutions
VIEW BY:
  • Data Solutions

    • Lead Generation
    • Property Data
    • Location Intelligence
  • Real Estate

    • Multiple Listing Enterprise
    • Agent & Broker
  • Mortgage

    • Origination
    • Servicing
    • Appraisal
    • Commercial Property Tax
  • Insurance

    • Hazard Risk
    • Catastrophe Risk Management
    • Risk Evaluation
    • Underwriting Automation
    • Weather
    • Claims Automation
    • Restoration
    • INTRCONNECT
  • Mortgage Lenders

    • Origination
  • Mortgage Servicers

    • Residential Property Tax
    • Default & Loss Mitigation
    • Portfolio Insight & Monitoring
  • Mortgage Appraisers

    • Appraisal
  • Real Estate Agents & Brokers

    • Agents & Brokers
  • Real Estate MLS

    • Multiple Listing Enterprises
  • Commercial Real Estate Owners

    • Commercial Property Tax
  • Marketing Departments

    • Property Data
  • Insurance Underwriters

    • Risk Evaluation
    • Underwriting Automation
    • Hazard Risk
    • Catastrophe Risk Management
  • Insurance Risk Managers

    • Risk Evaluation
    • Hazard Risk
    • Catastrophe Risk Management
  • Insurance Claims

    • Claims Automation
    • Restoration Contractors
    • Weather Verification
  • Construction Contractors

    • Restoration Contractors
  • General

    • Location Intelligence
    • Lead Generation
    • Data Solutions
Resources
  • Reports

    • Climate Change
    • Construction Cost Update
    • Construction Insights
    • Home Price Insights
    • Homeowner Equity Insights
    • Loan Performance Insight
    • Mortgage Fraud
    • Property Tax Delinquency
    • Single-Family Rent Index
  • Insight Blogs

    • Hazard HQ
    • Office of Chief Economist
    • Affordable Housing
    • Homebuying
    • Insurance
    • Other Articles
  • More Resources

    • Events
    • Case Studies
    • White Papers
    • Podcasts
    • Quick Takes

Home / Intelligence / Reports / U.S. Case-Shiller Home Price Index Hits Yet Another New High

ABOUT THE AUTHOR
Selma Hepp
Selma Hepp
Chief Economist
View Profile
  • January 26, 2021

U.S. Case-Shiller Home Price Index Hits Yet Another New High

With home buying season turned on its head, home prices are up 9.49% in November

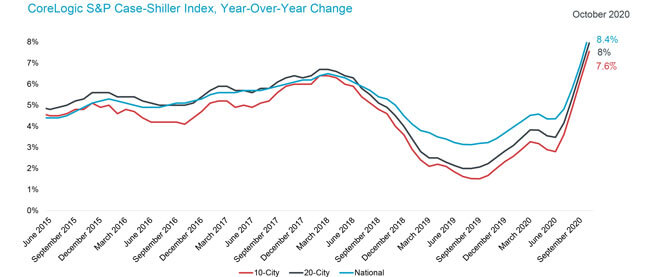
Housing continued to exceed expectations, even during the early winter months when demand tends to cool down. With existing home sales up over 20% from a year ago, S&P CoreLogic Case-Shiller Index clocked a 9.49% surge in November – a new high since February 2014.

New record lows for mortgage rates helped lure in home buyers who were also facing the reality of another spike in COVID-19 cases and prolonged shutdown restrictions. The increase in infections highlighted that a long, socially distant winter is still ahead of us and the need for additional home space will remain. At the same time, inventory of for-sale homes took the usual seasonal dip, falling to only about 1.4 million homes in October — which is when November sales were likely first signed. According to CoreLogic Buyer/Seller Market Indicator, which measures the ratio between sold price and list price, buyer competition reached a new peak nationally in October and November when the ratio climbed to 0.996 — the highest level since 2008, when the data series began. The high ratio suggests home sellers were generally getting their asking price.

The index is 26% above the peak reached during the pre-Great Recession. The month-to-month index slowed some slowing from October jump but was still up 1.07% from the month before.

The 10- and 20-city composite indexes were also up considerably, up 8.76% and 9.08% year over year, respectively. Both indices continue to surge at the fastest pace since early 2014 when home prices were experiencing a similar rush (Figure 1). Compared to a year ago, the two indexes have accelerated more than 6 percentage points, though the 10-city index interestingly had a slightly higher rate of acceleration than the 20-city index.  The 10-City Composite is now 11.2% above 2006 peak while the 20-City Composite is 15.5% higher than the previous peak also reached in 2006.

Figure 1: Home Price Growth Reaches New Highs in November 2020

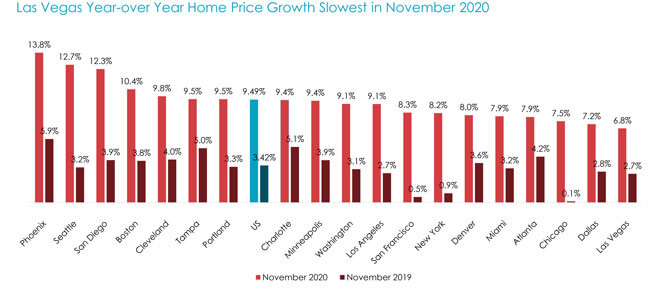
Phoenix, which continues to be the city with fastest home price growth for the 17th consecutive month, surged another 13.8% in home prices in November. Seattle remained in second place, with an annual increase of 12.7%. The city also had the largest acceleration in index growth compared to a year ago — up 9.4 percentage points. Even Chicago (up 7.5%) and New York (up 8.2%), which started off at the bottom of the pack in 2020, were outpacing some cities (see Figure 2). Las Vegas, with a 6.8% annual increase, is now showing the slowest rate of acceleration in the group.

Figure 2: Home Price Growth in Many Regions More Than Doubles

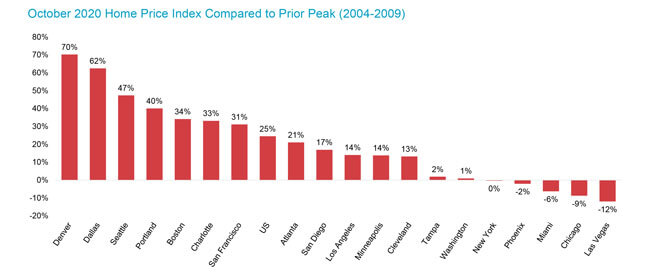
While reaching new peaks, November’s national home prices were 26% higher than the previous peak. Four cities continued to remain below their previous peak, namely Las Vegas, Chicago, Miami and Phoenix. Again, while Phoenix has been experiencing 17 straight months of the strongest increases, it has yet to reach its previous pre-Great Recession peak. Las Vegas, now experiencing some slowdown in home price acceleration, is still 11% below its previous peak (Figure 3).

Figure 3: U.S. Home Prices are 26% Above Their Prior Peak

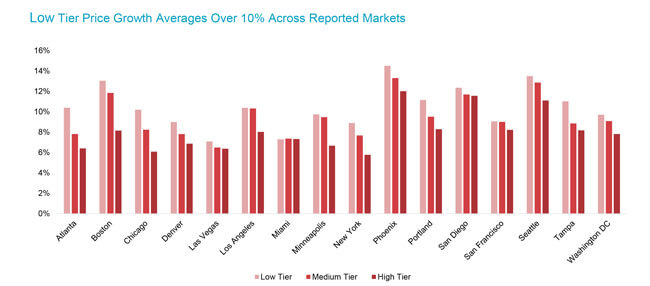
Lastly, homes in the lower one-third of the price distribution overall continue to experience the strongest acceleration, partly due to competing demand from buyers, as well as exceptionally low inventories. But, while prices in the lower one-third jumped by 11.5% in November on average, some metros — particularly Los Angeles and San Francisco — had faster acceleration in the middle-priced tier than in the low tier.   

The average growth among medium-tier priced homes was 10.3%, and highest-tier prices were up 9% on average. Compared to April 2020, high-tier prices had highest acceleration of almost 5 percentage points (Figure 4).

Figure 4: Low-Tier Home Price Growth Reaches 16% in Phoenix

While acceleration of home price growth into winter months seems to defy underlying economic conditions, particularly during challenging financial times for many households, some accelerations stem from lack of distressed-sales activity which generally defines the end of a calendar year. Distressed activity this year has been considerably reduced by the CARES Act and significant accumulation of home equity in recent years. In addition, as CoreLogic home purchase applications data suggests home buyer demand continues to outpace previous year’s levels, which, amid historically low inventory of for-sale homes, is going to fuel home price growth in the first half of 2021.

*Due to the COVID-19 crisis, S&P Dow Jones Indices and CoreLogic are unable to generate a valid November 2020 update of the Detroit S&P CoreLogic Case-Shiller indices for the November release; thus, Detroit was excluded from the analysis.

©2021 CoreLogic, Inc. , All rights reserved.

  • Category: Home Price Insights, Intelligence, Reports
  • Tags: Case Shiller Index, Home Value
ABOUT THE AUTHOR
Selma Hepp
Selma Hepp
Chief Economist
View Profile

Related Posts

Header Intelligence Protect storm HHQ hazard
Climate Change

2023 Severe Convective Storm Risk Report

As rising global temperatures continue to contribute to increasingly hazardous wildfire seasons, it is more important than ever for homeowners, insurers, and governments to understand the risk these hazards pose to their communities.

March 31, 2023
Construction worker framing a house
Construction Insight

Quarterly Construction Insights – Q1 2023

CoreLogic tracks construction cost for commercial, residential and agricultural construction of all types of goods (labor and materials) throughout the United States and Canada.

March 30, 2023
Jan23LPIPromo
Blogs

Loan Performance Insights – March 2023

U.S. mortgage delinquency and foreclosure rates continued to hold near record lows in January.

March 30, 2023

About Corelogic

  • Newsroom
  • Leadership
  • Careers
  • Ethics & Compliance

Accounts

  • Products Sign-in

Contact

  • Sales Contact
  • Product Support

Regions

  • CoreLogic Australia
  • CoreLogic New Zealand
  • CoreLogic UK

Follow & Connect

  • Facebook
  • Instagram
  • Linkedin
  • Twitter
  • YouTube
© 2023 CoreLogic. All rights reserved.
  • Legal
  • Privacy Policy
  • CCPA
  • Cookie Preferences
  • Security
  • Sitemap
  • Accessibility
  • Legal
  • Privacy Policy
  • CCPA
  • Cookie Preferences
  • Security
  • Sitemap
  • Accessibility