Chat
Chat with Sales Hours: Monday-Friday 8:30 a.m. - 4:30 p.m. (CST)
Contact Sales
Call Sales Toll-Free 1-(866) 774-3282 Hours: Monday-Friday 7 a.m. - 5 p.m. (CST)
Product Login
Product Log-in
Product Support
Product Support
Email Sales
Contact Sales
After Hours
  • Support
  • Sign In Sign In
  • AUS NZ UK
CoreLogic - Home
  • Solutions
    view solutions by:

    Data Solutions

    • Lead Generation
    • Property Data
    • Location Intelligence

    Real Estate

    • Multiple Listing Enterprise
    • Agent & Broker

    Mortgage

    • Origination
    • Servicing
    • Appraisal
    • Commercial Property Tax

    Insurance

    • Hazard Risk
    • Catastrophe Risk Management
    • Risk Evaluation
    • Underwriting Automation
    • Weather Verification
    • Claims Automation
    • Restoration
    • INTRCONNECT

    Mortgage Lenders

    • Origination

    Mortgage Servicers

    • Residential Property Tax
    • Default & Loss Mitigation
    • Portfolio Insight & Monitoring

    Mortgage Appraisers

    • Appraisal

    Real Estate Agents & Brokers

    • Agents & Brokers

    Real Estate MLS

    • Multiple Listing Enterprises

    Commercial Real Estate Owners

    • Commercial Property Tax

    Marketing Departments

    • Property Data

    Insurance Underwriters

    • Risk Evaluation
    • Underwriting Automation
    • Hazard Risk
    • Catastrophe Risk Management

    Insurance Risk Managers

    • Risk Evaluation
    • Hazard Risk
    • Catastrophe Risk Management

    Insurance Claims

    • Claims Automation
    • Restoration Contractors
    • Weather Verification

    Construction Contractors

    • Restoration Contractors

    General

    • Location Intelligence
    • Lead Generation
    • Data Solutions
  • Resources

    Reports

    • Climate Change
    • Construction Cost Update
    • Construction Insights
    • Home Price Insights
    • Homeowner Equity Insights
    • Loan Performance Insight
    • Mortgage Fraud
    • Property Tax Delinquency
    • Single-Family Rent Index

    Insight Blogs

    • Hazard HQ
    • Office of Chief Economist
    • Affordable Housing
    • Homebuying
    • Insurance
    • Other Articles

    More Resources

    • Case Studies
    • White Papers
    • Podcasts
    • Quick Takes
  • Company
    • About
    • Leadership
    • Newsroom
    • Contact
    • Careers
  • Search
CoreLogic - Home
  • Solutions
  • Resources
  • Company

    • About
    • Leadership
    • Newsroom
    • Contact
    • Careers
  • Accounts

    • Products Sign-in
  • Contact

    • Sales Contact
    • Product Support
  • Regions

    • Australia
    • New Zealand
    • United Kingdom
  • Social

    • Facebook
    • Instagram
    • Linkedin
    • Twitter
    • Youtube
Solutions
VIEW BY:
  • Data Solutions

    • Lead Generation
    • Property Data
    • Location Intelligence
  • Real Estate

    • Multiple Listing Enterprise
    • Agent & Broker
  • Mortgage

    • Origination
    • Servicing
    • Appraisal
    • Commercial Property Tax
  • Insurance

    • Hazard Risk
    • Catastrophe Risk Management
    • Risk Evaluation
    • Underwriting Automation
    • Weather Verification
    • Claims Automation
    • Restoration
    • INTRCONNECT
  • Mortgage Lenders

    • Origination
  • Mortgage Servicers

    • Residential Property Tax
    • Default & Loss Mitigation
    • Portfolio Insight & Monitoring
  • Mortgage Appraisers

    • Appraisal
  • Real Estate Agents & Brokers

    • Agents & Brokers
  • Real Estate MLS

    • Multiple Listing Enterprises
  • Commercial Real Estate Owners

    • Commercial Property Tax
  • Marketing Departments

    • Property Data
  • Insurance Underwriters

    • Risk Evaluation
    • Underwriting Automation
    • Hazard Risk
    • Catastrophe Risk Management
  • Insurance Risk Managers

    • Risk Evaluation
    • Hazard Risk
    • Catastrophe Risk Management
  • Insurance Claims

    • Claims Automation
    • Restoration Contractors
    • Weather Verification
  • Construction Contractors

    • Restoration Contractors
  • General

    • Location Intelligence
    • Lead Generation
    • Data Solutions
Resources
  • Reports

    • Climate Change
    • Construction Cost Update
    • Construction Insights
    • Home Price Insights
    • Homeowner Equity Insights
    • Loan Performance Insight
    • Mortgage Fraud
    • Property Tax Delinquency
    • Single-Family Rent Index
  • Insight Blogs

    • Hazard HQ
    • Office of Chief Economist
    • Affordable Housing
    • Homebuying
    • Insurance
    • Other Articles
  • More Resources

    • Case Studies
    • White Papers
    • Podcasts
    • Quick Takes

Home / Intelligence / U.S. S&P CoreLogic Case-Shiller Reflects Consumer Post-Vaccination Optimism, Surges 18.6%

ABOUT THE AUTHOR
Selma Hepp
Selma Hepp
Chief Economist
View Profile
  • August 31, 2021

U.S. S&P CoreLogic Case-Shiller Reflects Consumer Post-Vaccination Optimism, Surges 18.6%

Widespread demand for homes in all price ranges leads to convergence in price tiers’ growth rates

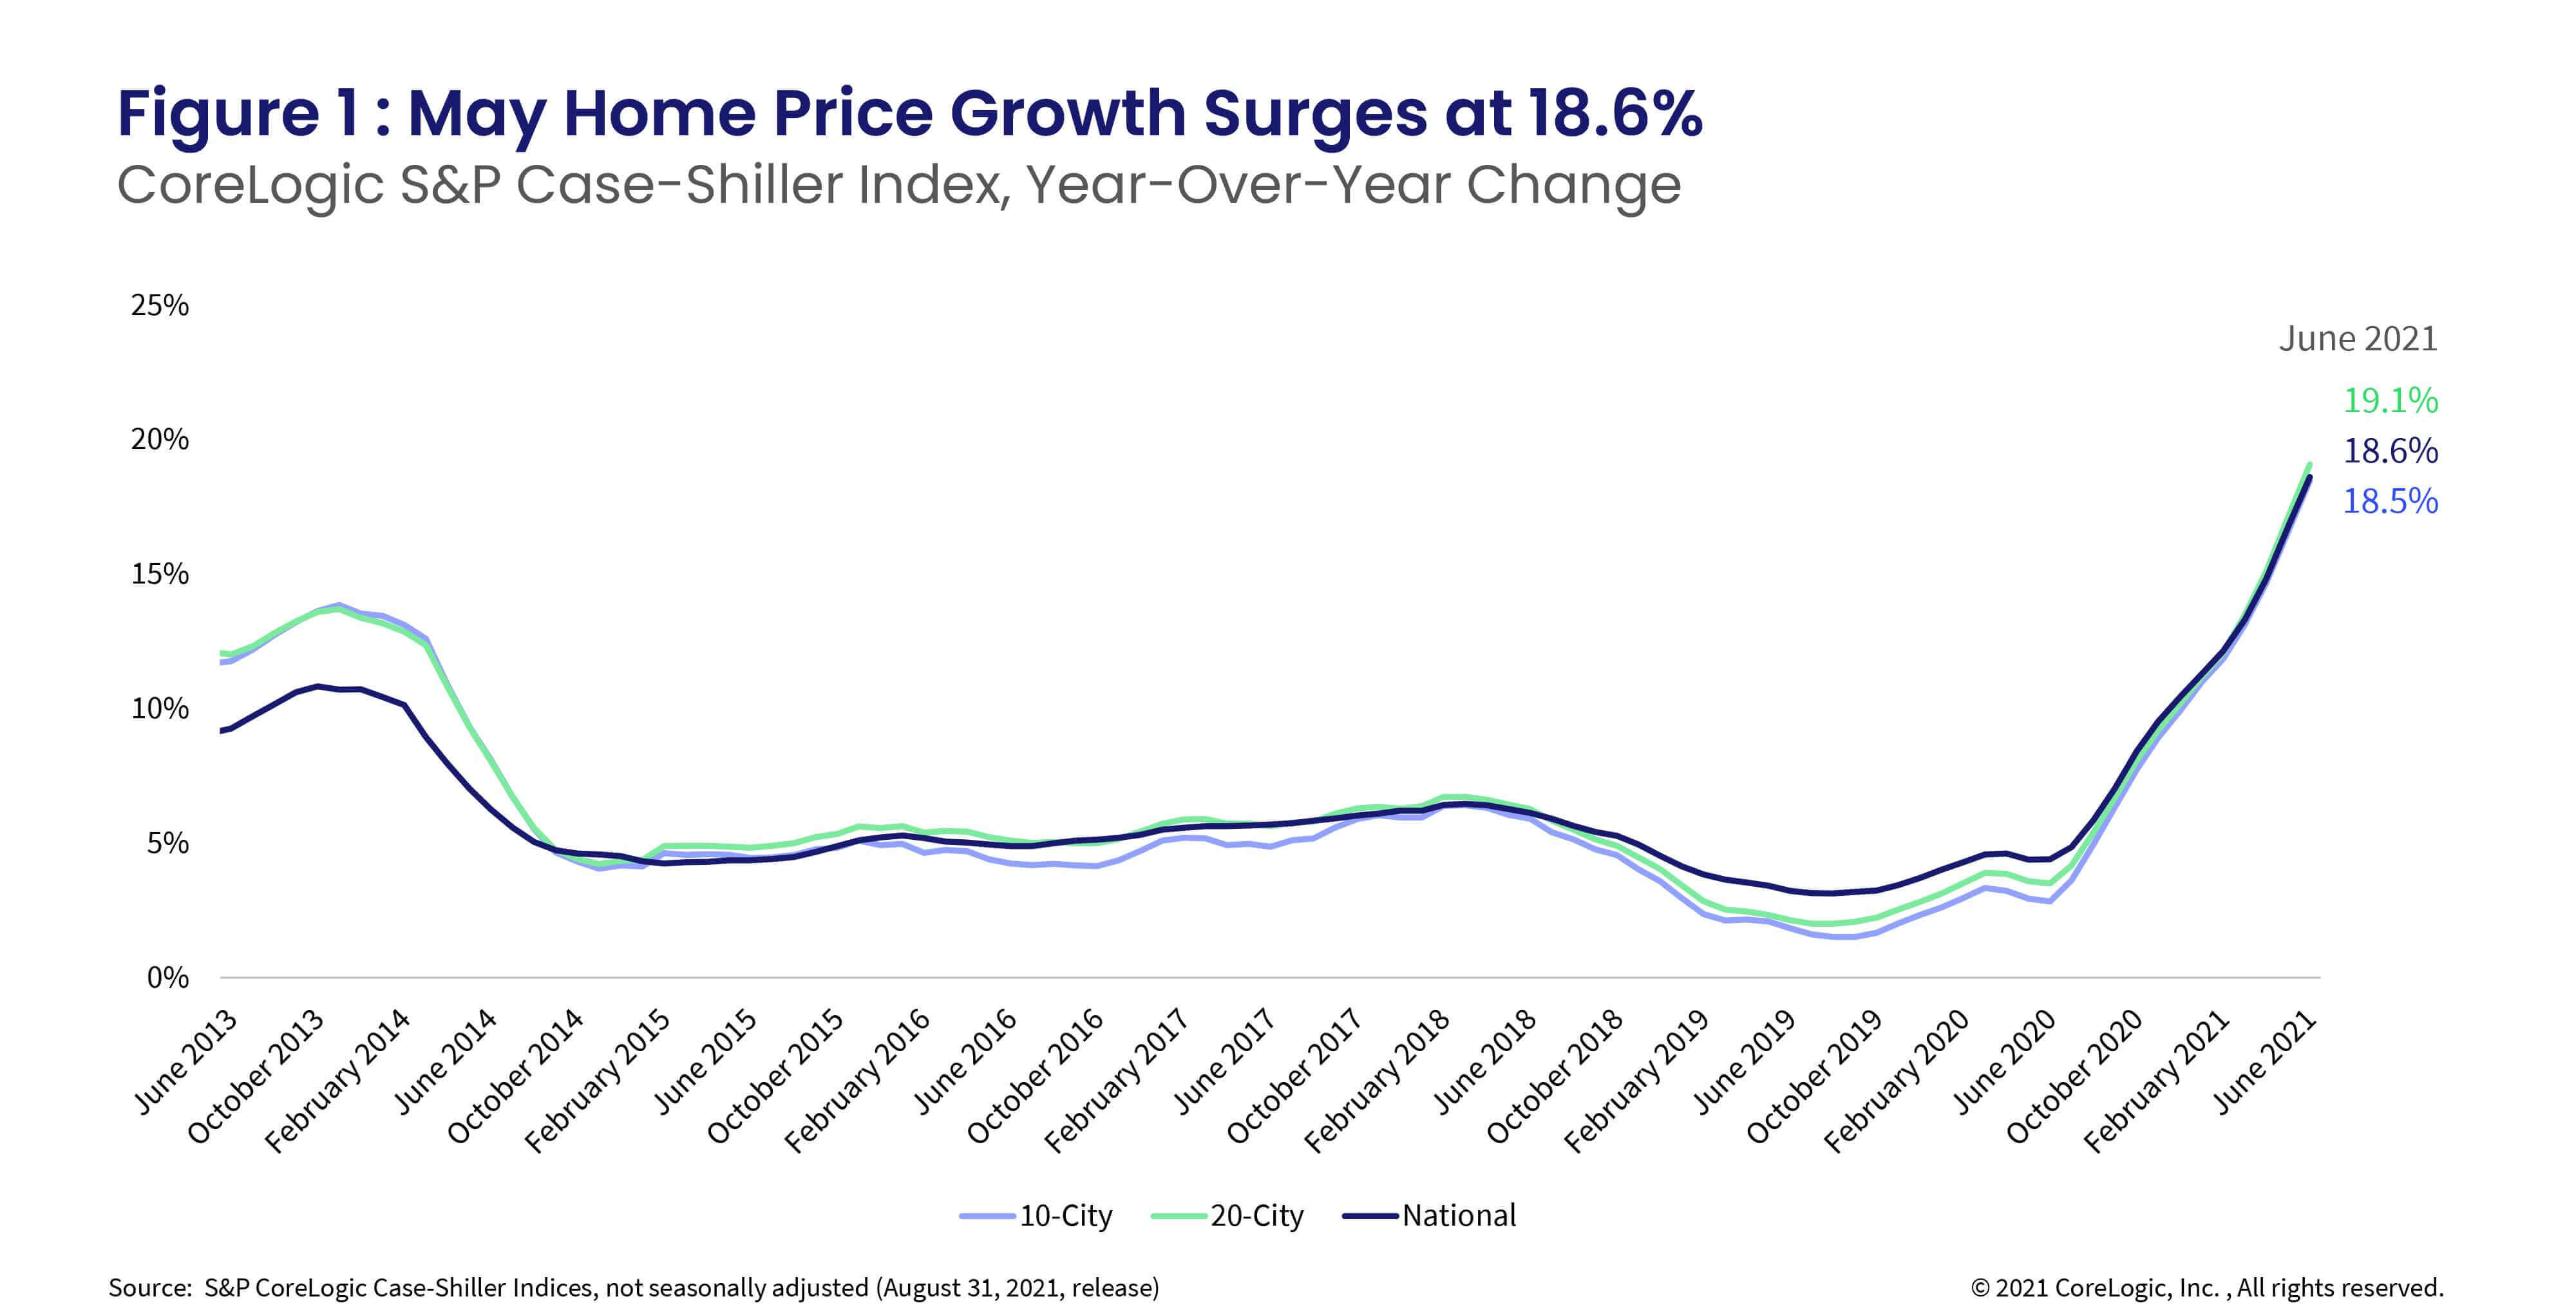
Home buyer demand pushed price growth to a new record high in June, with S&P CoreLogic national Case-Shiller Index clocking in an 18.6% year-over-year growth rate. The month-to-month index jumped 2.18%, making it another strong monthly growth, and the fastest May-to-June increase since the data series began.

Despite some improvements to the availability of for-sale homes since winter’s inventory lows and spring’s mortgage rate increases, the housing market imbalances that propelled price growth to record highs persist. While some buyers are reaching their affordability ceiling and others are fatigued from making multiple offers, many enthusiastic buyers are still competing for limited inventories. This activity is pushing bid prices above asking prices, further fueling price acceleration. Thus, even with new listings continuing to improve, home price growth is likely to remain in double digits throughout the remainder of 2021. 

The 10- and 20-city composite indexes also increased in June, up 18.5% and 19.1% year over year, respectively. The last time the 10-city index had a similar rate of growth was in 2004, while the 20-city index has never recorded such a strong home price increase (Figure 1). It is also interesting to see the national and city-composite growth rates converge— which illustrates the unique, widespread demand for homes across all U.S. metro areas.

Compared to the 2006 peak, the 10-city composite is now 24% higher, while the 20-city composite is 30% higher. But, when the two indexes are adjusted for inflation, the 10-city index is still 3% below its 2006 peak, while the 20-city index is 1% above its previous peak.  

Figure 1 : May Home Price Growth Surges at 18.6%

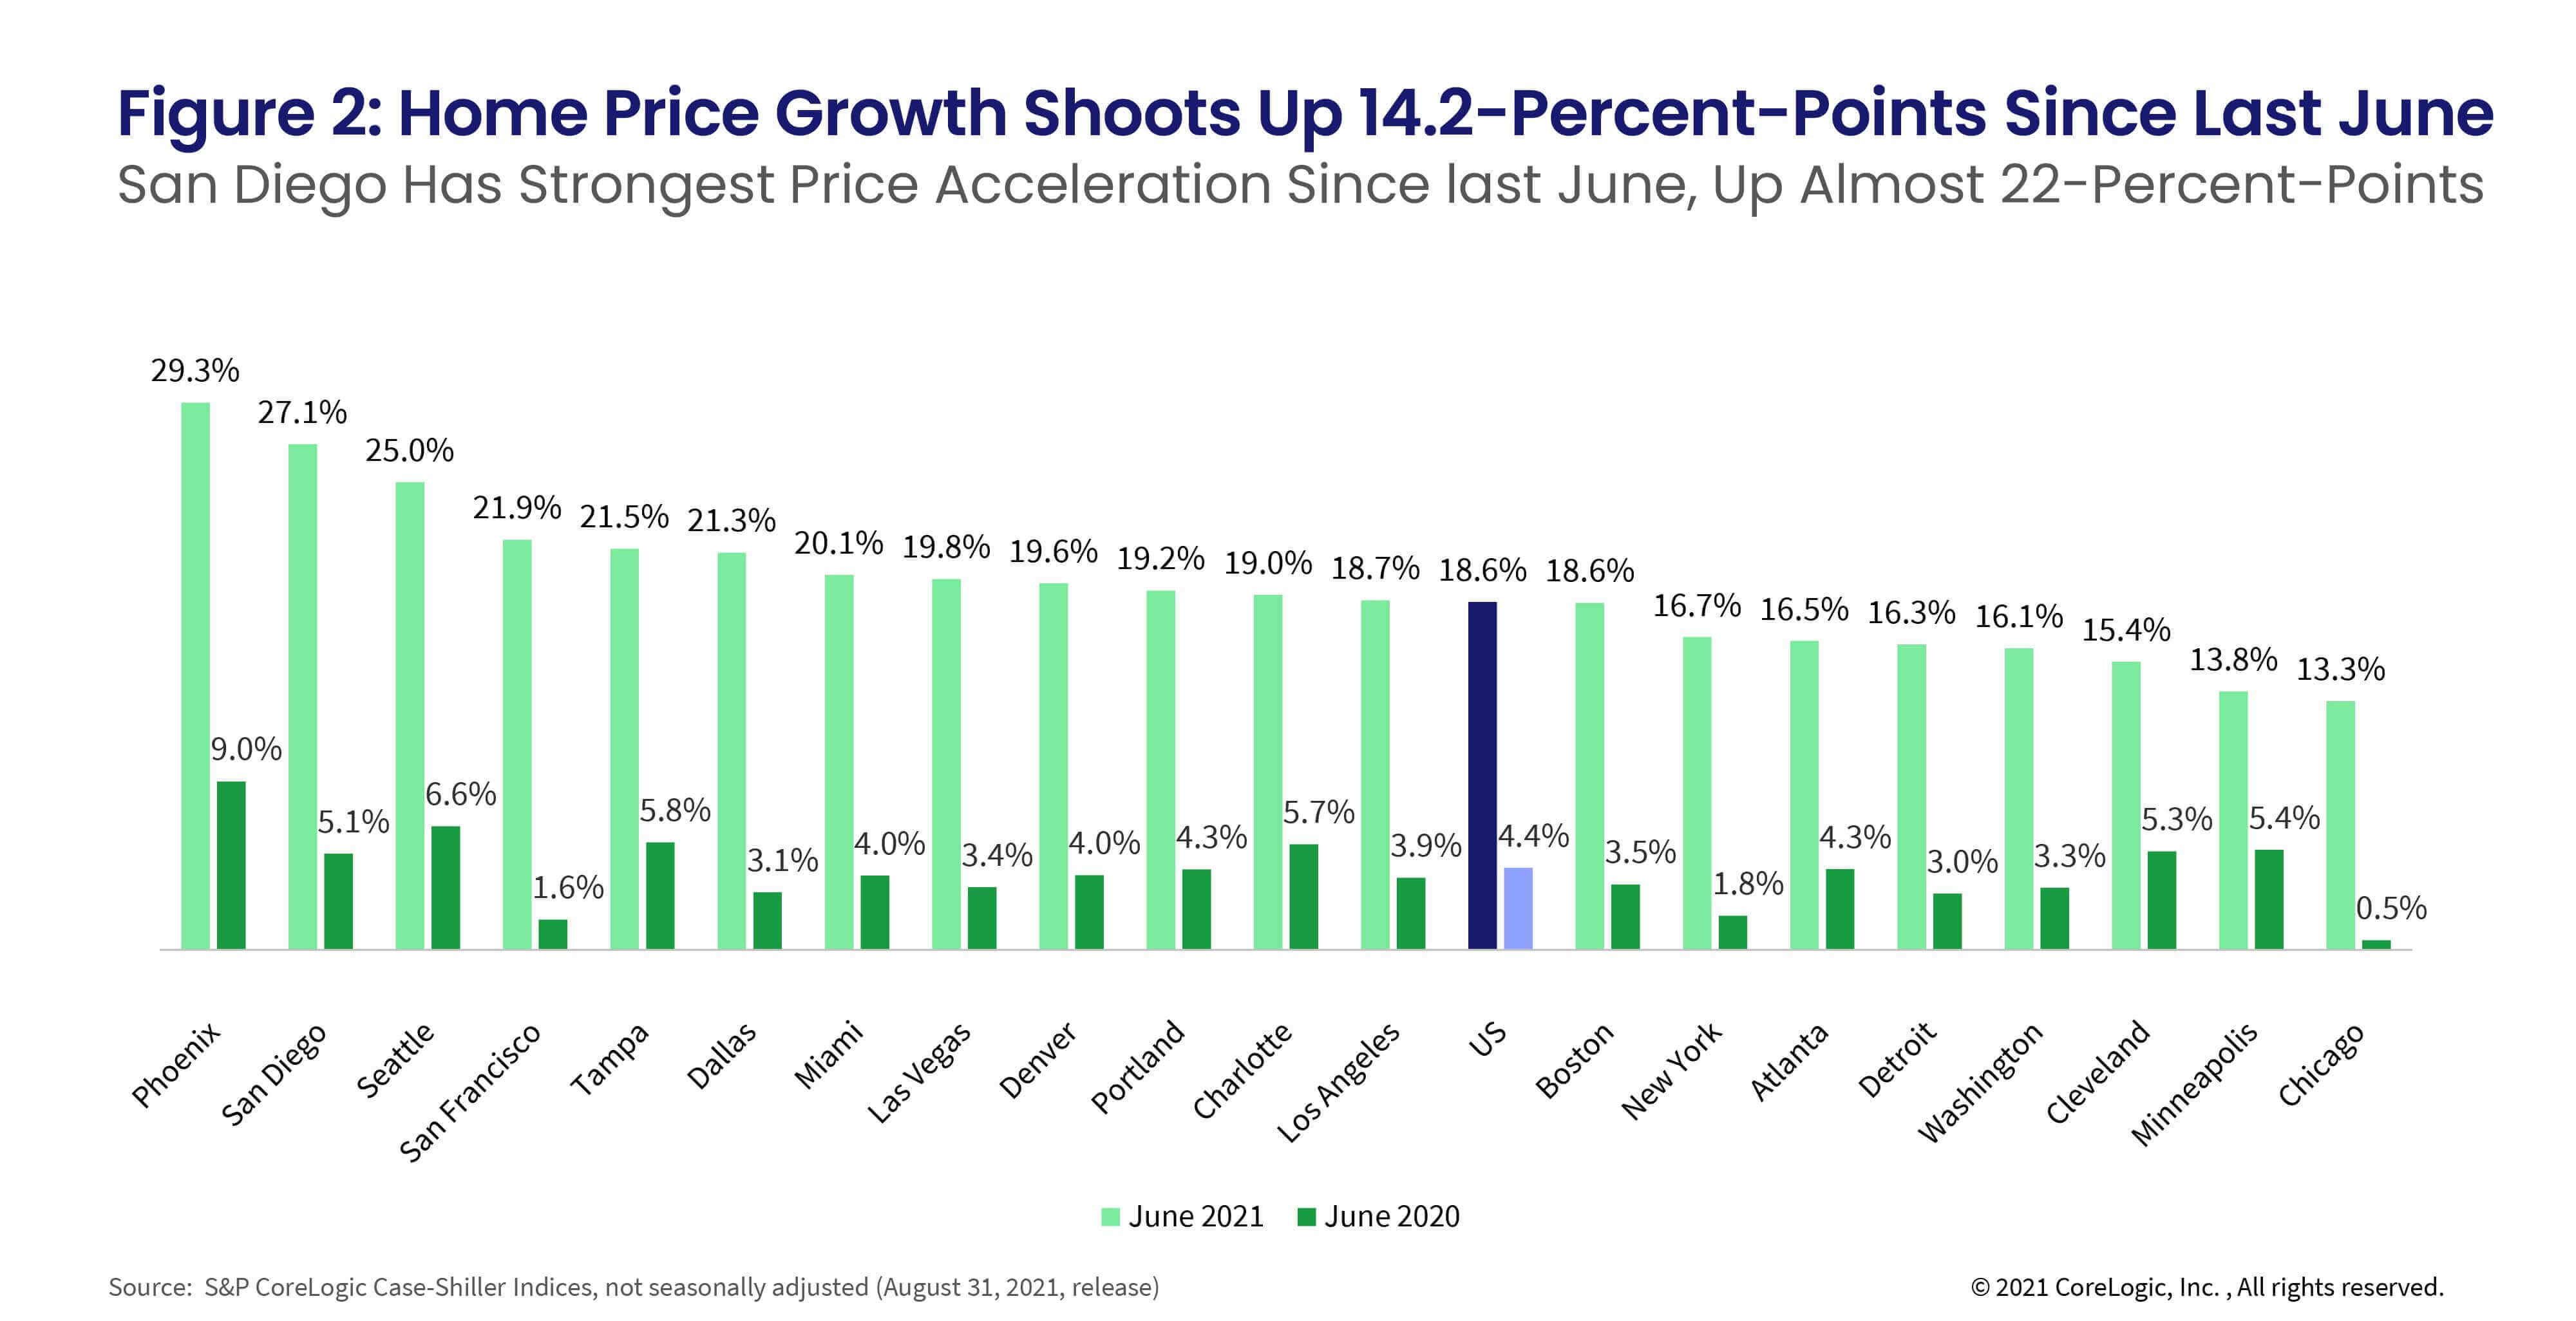
For the 24th consecutive month, Phoenix had the strongest home price growth among the 20 markets, surging 29.3% in June. This is the fastest acceleration since the spring of 2006 and 20-percentage points higher than last June’s growth. There has been almost no change in the ranking of metropolitan areas by price growth over the last year.

San Diego remained in second place for the strongest price growth, with an annual acceleration of 27.1%, and a larger jump of almost 22-percentage points from last June. Seattle, in third place, had a 25% jump in June.

Chicago and Minneapolis continued to lag, up only 13.3% and 13.8%, respectively, though both are experiencing double-digit price growth. Chicago has been ranking the lowest in price appreciation in the past four months’ releases. However, Minneapolis had the slowest acceleration in price growth compared to last year (Figure 2).

Figure 2: Home Price Growth Shoots Up 14.2-Percent-Points Since Last June

Compared to growth rate six months ago, home price appreciation sped up over 10-percentage points in San Diego, Phoenix, San Francisco, Las Vegas, Dallas and Seattle. The slowest acceleration compared to January 2021 was in Cleveland, up only 3.3-percentage points, though Cleveland was already at over 12% growth rate in January.

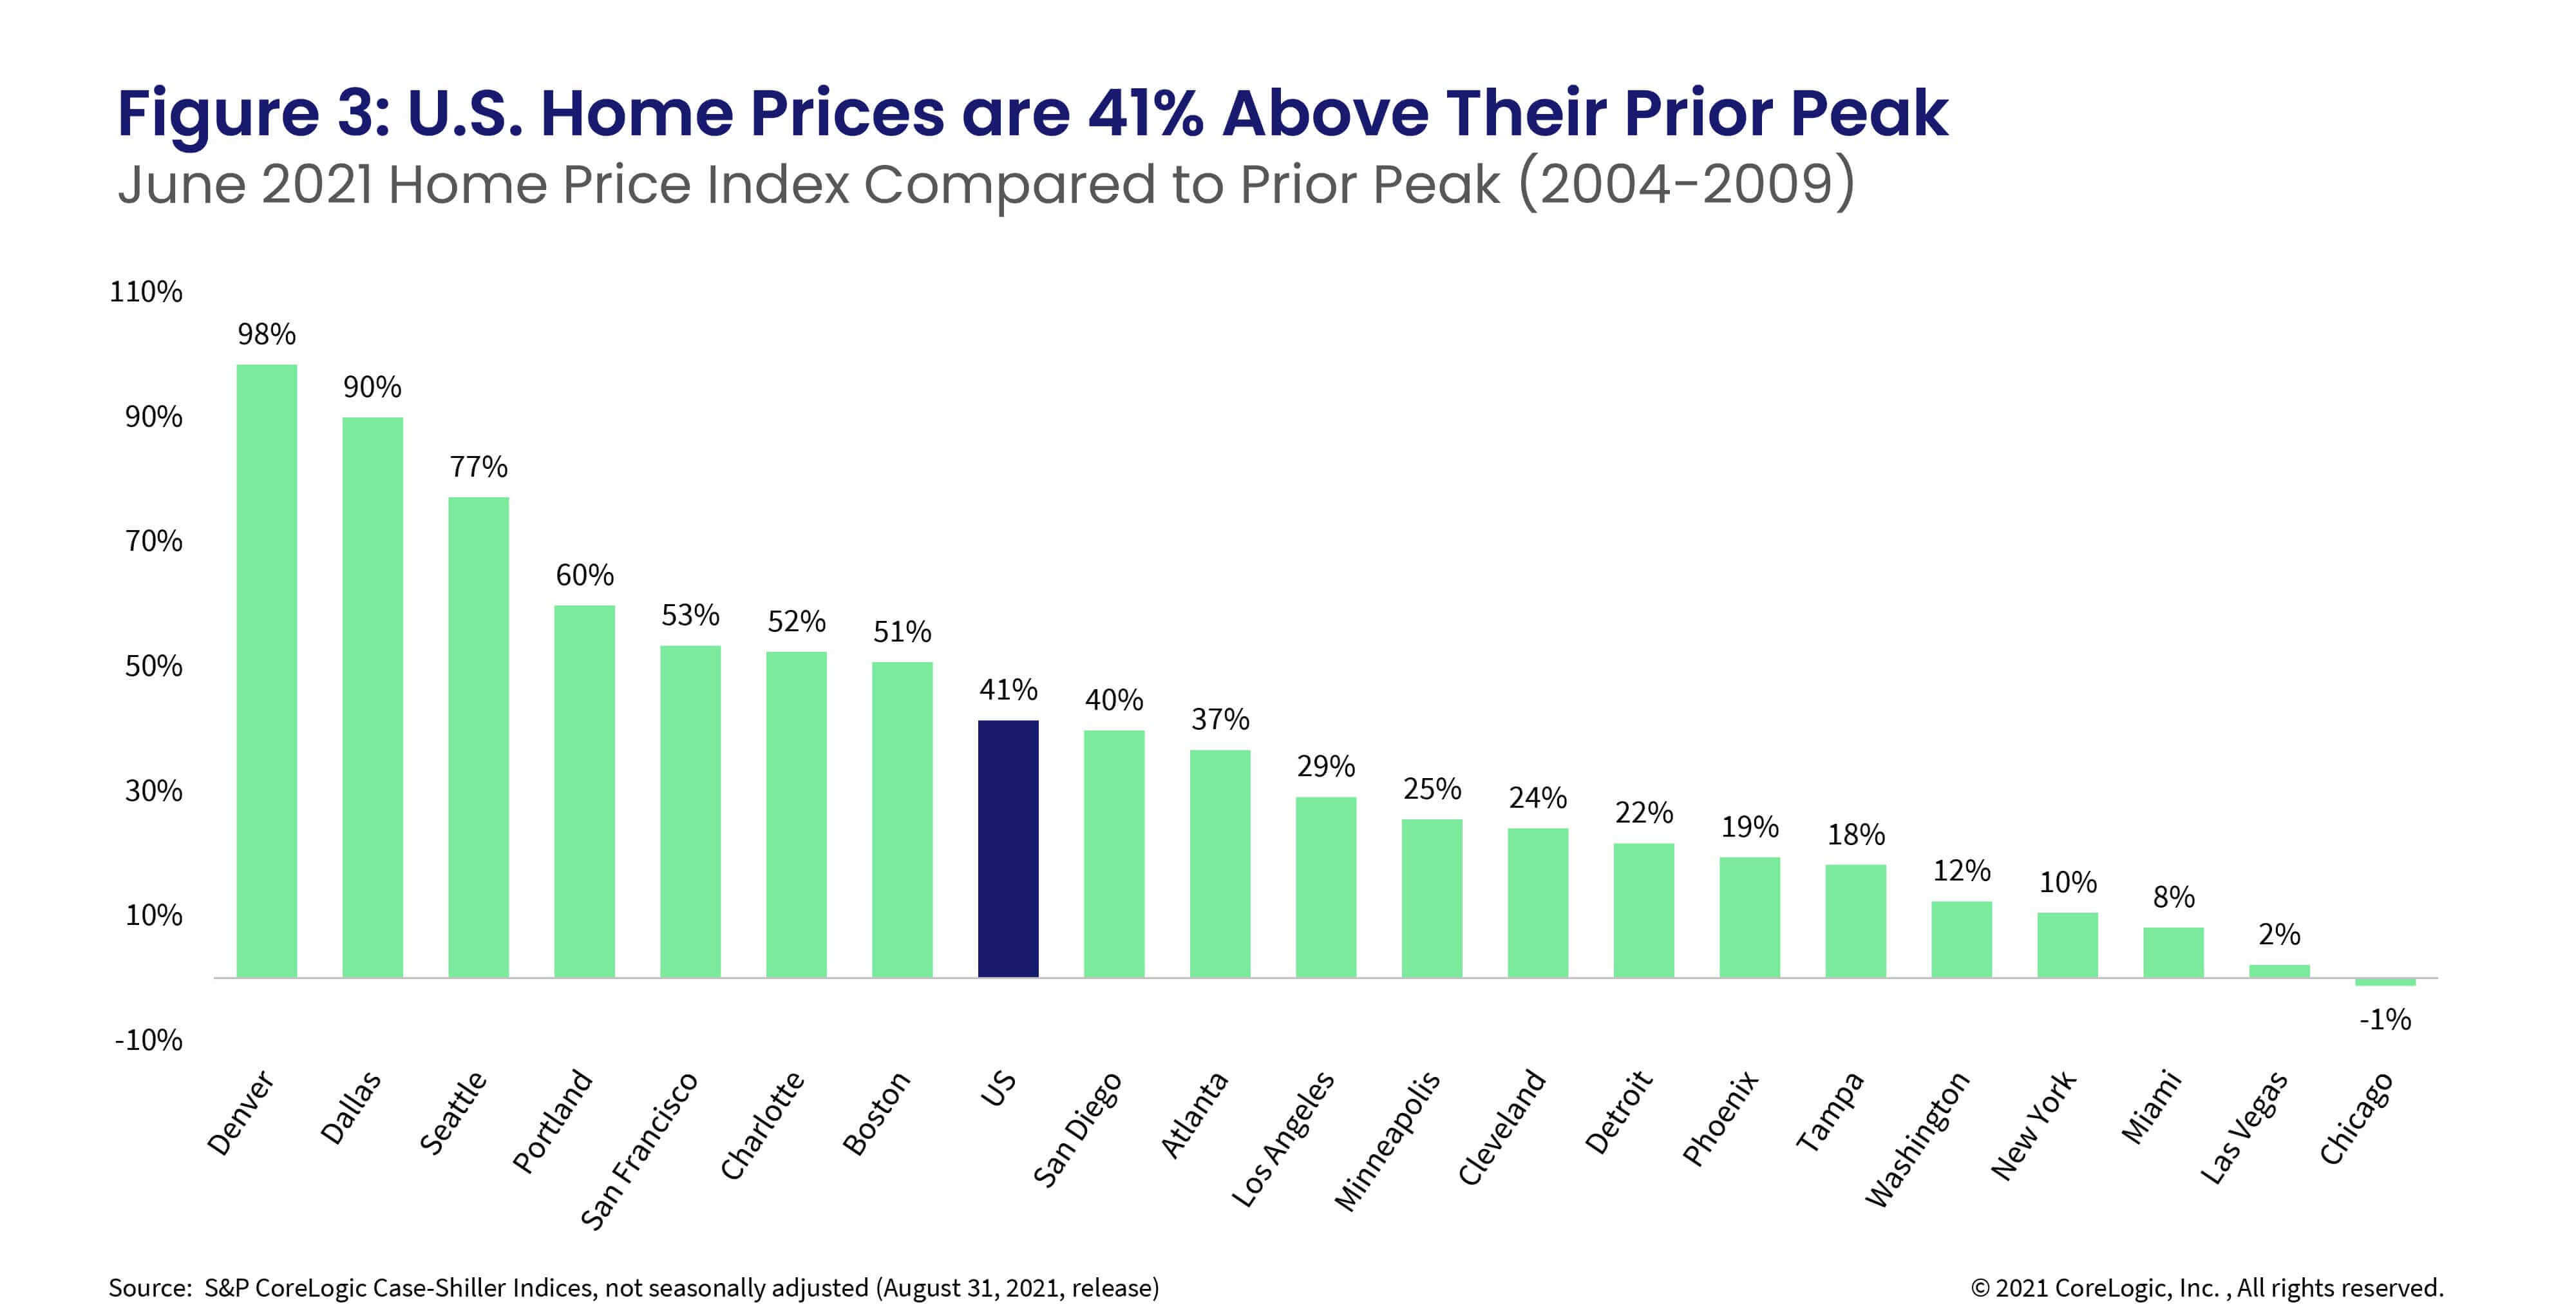
In June, national home prices were 41% higher than the previous peak. Chicago is the only metro still lagging behind the peak, while Las Vegas has finally caught up and is up 2% above the previous peak. In contrast, Denver’s prices have leapt 98% above its 2006 peak, followed by Dallas at 90% (Figure 3). Nonetheless, while nominal prices have surpassed previous levels, national home prices are only 10% above the previous peak when adjusted for inflation.

Figure 3: U.S. Home Prices are 41% Above Their Prior Peak

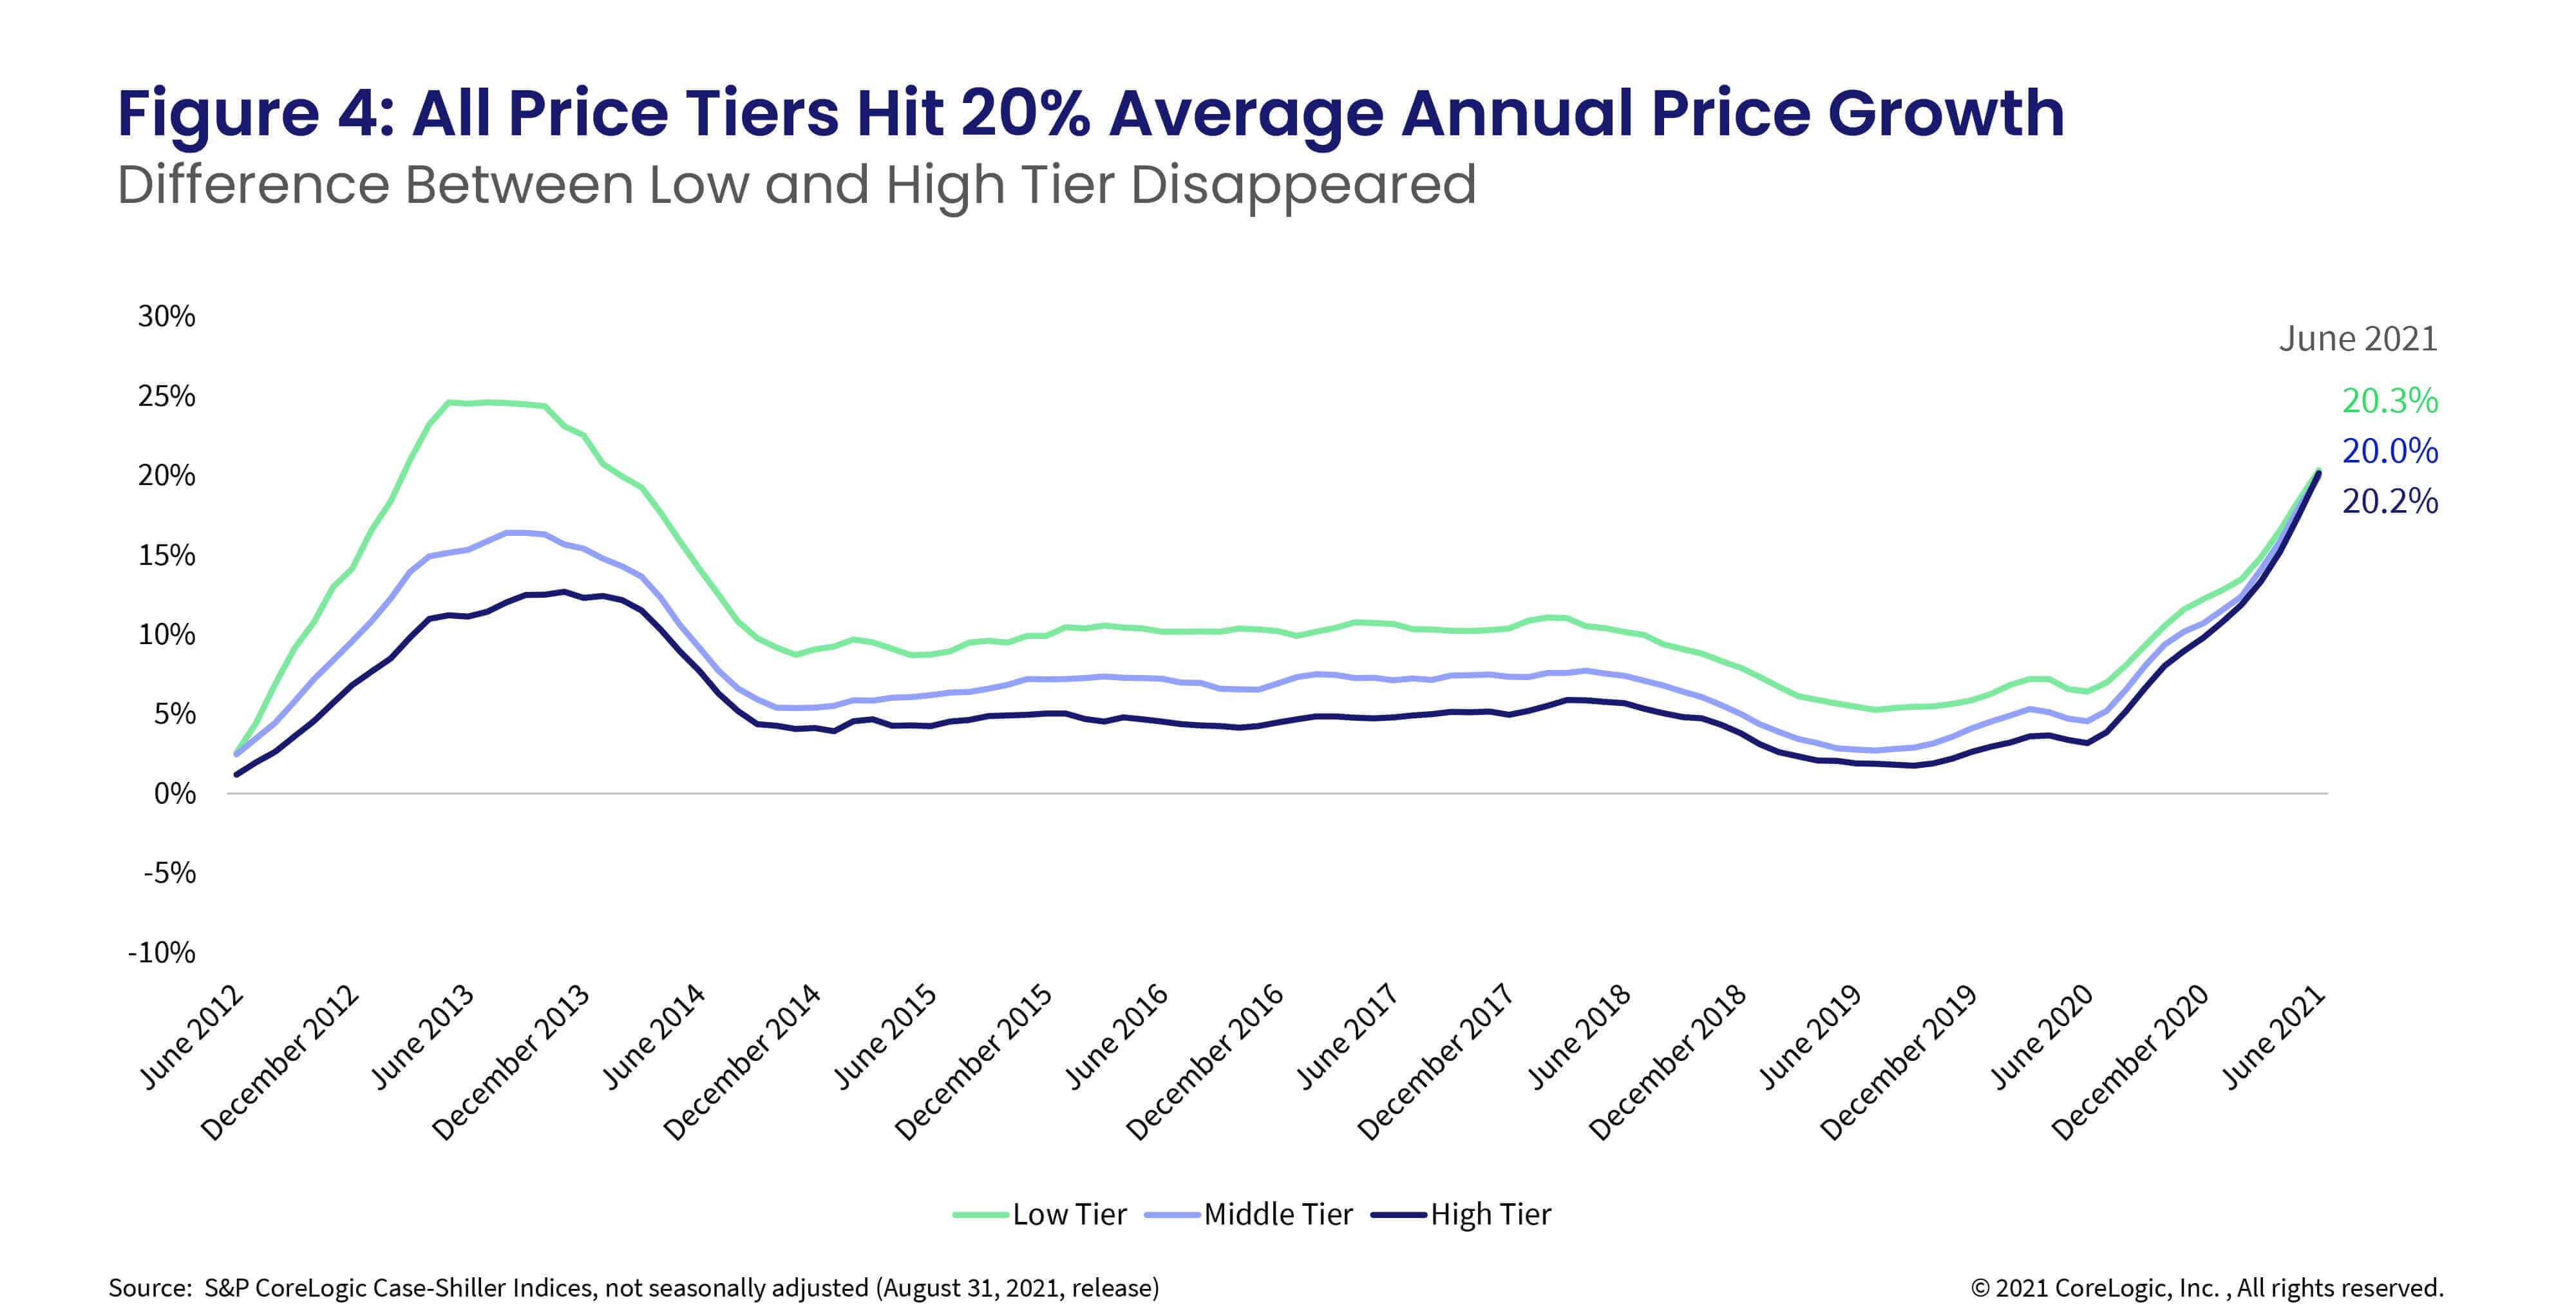
Home price growth between the low tier and high tier almost converged in June — a trend not seen previously. This convergence occurred as demand for homes in all price segments remains strong, but particularly due to heightened demand for higher-end homes since last summer.

Home prices in the lower one third of the price distribution jumped 20.3% on average in June. The fastest price growth in the low tier was in 2013, when the growth rate reached 25% as investors were snapping up foreclosed properties post-Great Recession. The average growth among medium-tier priced homes reached 20% in June, while prices in the highest tier were up 20.2% on average, making it the strongest home price growth recorded for the two tiers in the history of the series (Figure 4).

Figure 4: All Price Tiers Hit 20% Average Annual Price Growth

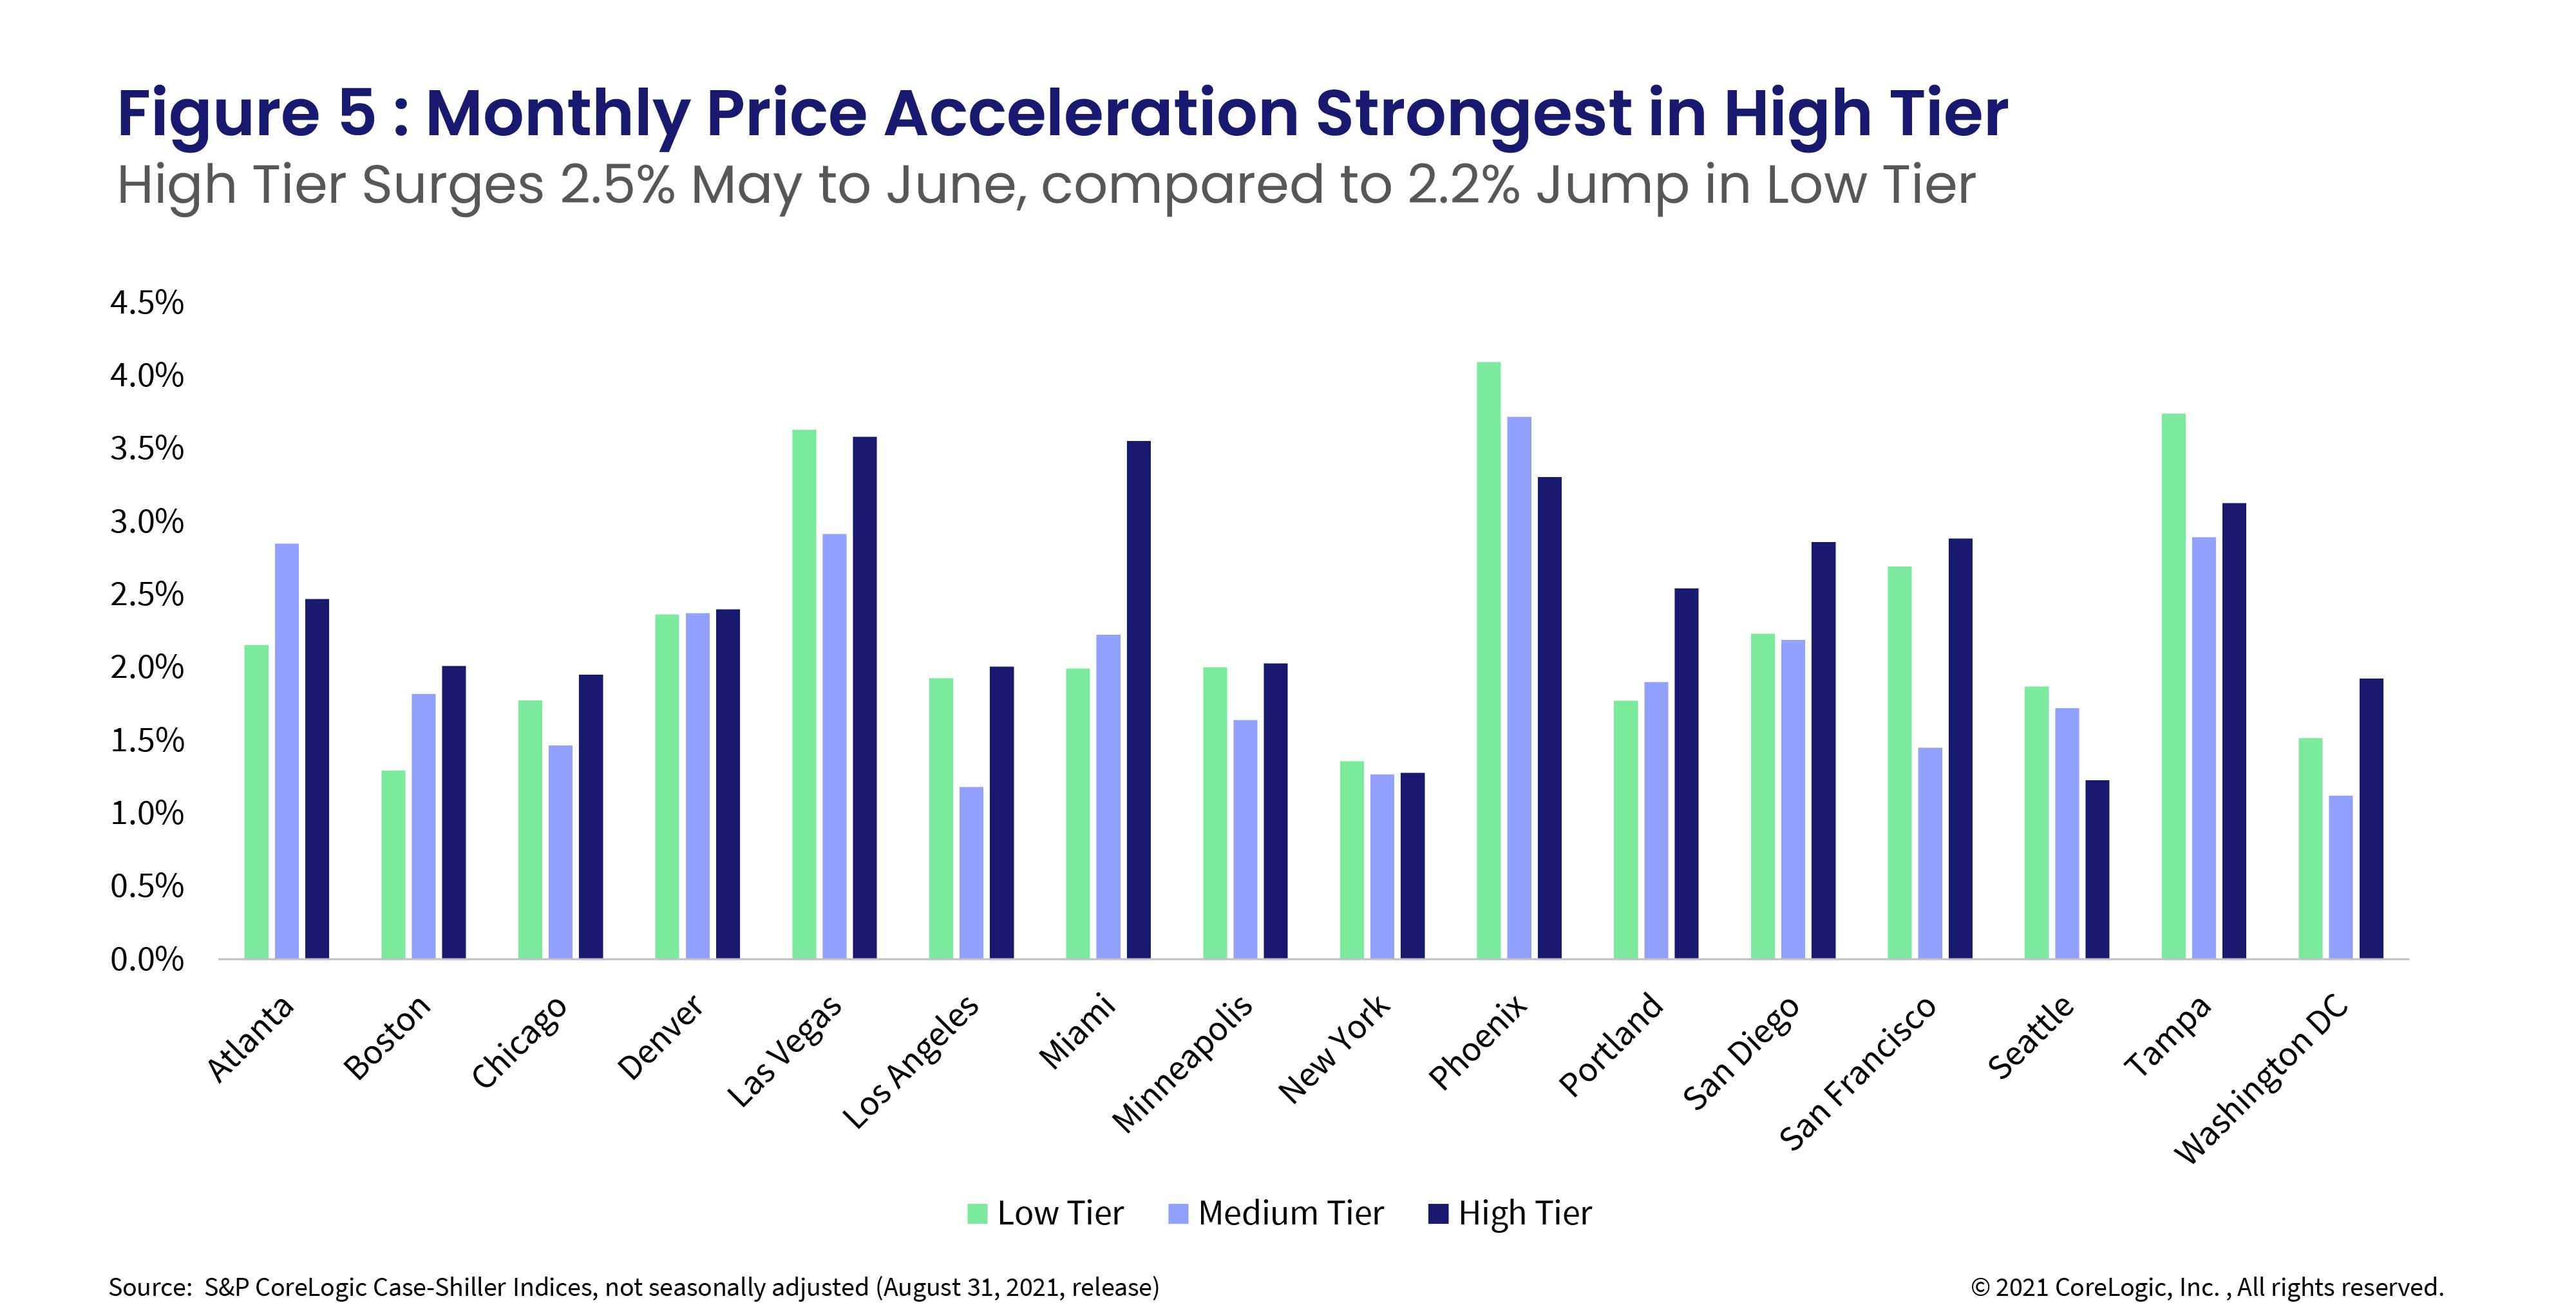
Lastly, the month-to-month changes in home price growth by price tier and location reveal buyers’ recent desirability of metro areas and purchase power. The largest home price increase in the lower one third price tier was in Phoenix, up 4.1% from May to June, followed by Tampa, Florida, at 3.7%, and Las Vegas at 3.6%. Compared to monthly growth rates recorded in March, Las Vegas, Miami and Tampa have had the strongest acceleration among all price tiers. Among low price tiers, Las Vegas and Tampa in particular had strong acceleration.

In the high tier, Las Vegas and Miami took the lead with a 3.6% increase between May and June, surpassing Phoenix which ranked 3rd at 3.3%. New York remains the weakest in the group of metros across all price tiers (Figure 5).

Figure 5 : Monthly Price Acceleration Strongest in High Tier

While the housing market feels like it has legs that never get tired, inventory and affordability constraints are still expected to put a damper on price growth. Some early data suggests the buyer frenzy experienced this spring is tapering, though many buyers remain in the market. Nevertheless, less competition and more for-sale homes suggest we may be seeing the peak of home price acceleration. Going forward, home price growth may ease off yet stay in double digits through year end.

  • Category: Home Price Insights, Intelligence, Reports
  • Tags: Case Shiller Index
ABOUT THE AUTHOR
Selma Hepp
Selma Hepp
Chief Economist
View Profile

Related Posts

Turkey Syria Earthquake
Hazard HQ

M7.5 – 7.8 Earthquake Sequence Near Turkey-Syria Border

A sequence of powerful earthquakes struck near the Turkey-Syria border, with three of the earthquakes registering magnitudes exceeding 6.5.

February 7, 2023
Dec2022HPIPromo
Blogs

U.S. Home Price Insights – February 2023

U.S. home prices continued to slow on a year-over-year basis in December 2022, moving down to 6.9%.

February 7, 2023
Jan23CSIPromo
Home Price Insights

US CoreLogic S&P Case-Shiller Index Growth Rate Cools Further in November, Up by 7.7%

Annual U.S. home price growth continued to relax in November for the seventh straight month.

January 31, 2023

About Corelogic

  • Newsroom
  • Leadership
  • Careers
  • Ethics & Compliance

Accounts

  • Products Sign-in

Contact

  • Sales Contact
  • Product Support

Regions

  • CoreLogic Australia
  • CoreLogic New Zealand
  • CoreLogic UK

Follow & Connect

  • Facebook
  • Instagram
  • Linkedin
  • Twitter
  • YouTube
© 2023 CoreLogic. All rights reserved.
  • Legal
  • Privacy Policy
  • CCPA
  • Security
  • Sitemap
  • Accessibility
  • Legal
  • Privacy Policy
  • CCPA
  • Security
  • Sitemap
  • Accessibility