


After seven months of monthly declines, home prices post a small increase in February
While lower mortgage rates helped entice some potential homebuyers off the sidelines so far in 2023, the U.S. housing market continues to face many headwinds, including pessimistic consumer sentiments, fears around recent banking turmoil, the lack of a seasonal spring home supply uptick and continued mortgage rate volatility.
In addition, given the wide variation in housing market conditions across U.S. regions, trends continue to be mixed and unclear, which further confuses buyers and sellers. One thing seems sure and is reflected in many recent homebuyer and seller surveys: Consumers consider mortgage rates too high right now and are waiting for a more opportune moment when rates are lower, with a 5.5%, 30-year, fixed-rate mortgage seemingly the catalyst that will move the needle. Nevertheless, the interaction of the usual spring demand rush and the lack of homes for sale has once again put pressure on prices, which posted a monthly increase in February following seven months of monthly declines.
In February, the CoreLogic S&P Case-Shiller Index inched out a 2% year-over-year increase, down from a 3.8% gain in January, marking the 10th straight month of decelerating annual home price gains. With the sharp decline in home price growth over past the year, February’s annual gain was the slowest since the summer of 2012 (Figure 1).
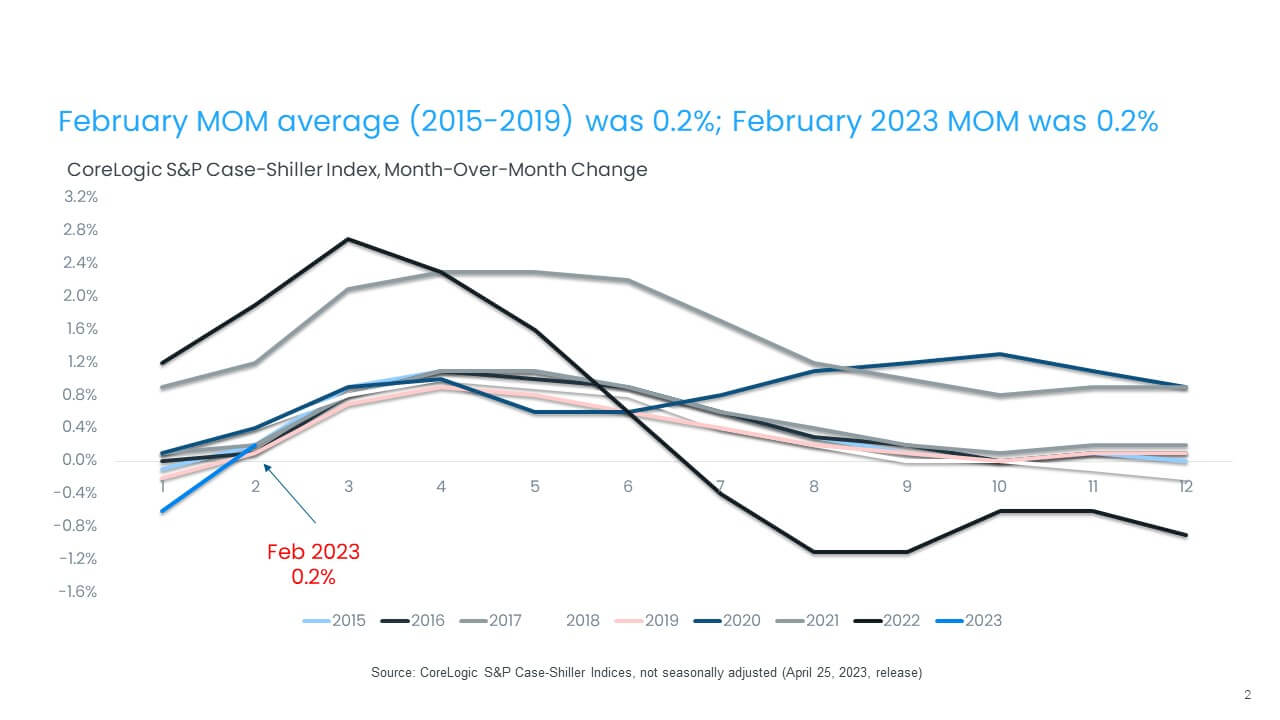
But the non-seasonally adjusted month-to-month index posted a monthly gain, up by 0.2% in February from a -0.57% decrease in January. Between 2015 and 2019, the monthly index changes from January and February have generally averaged a 0.2% (Figure 2).
Cumulatively, home prices in the national index are down by 4.9% from 2022’s high point. Some markets will see more significant price declines in 2023, though decreases are expected to remain regionalized and specific to metro areas that saw relatively more price growth during the pandemic. Seattle tops that list, with a 17% cumulative decline since the peak, while Miami, Atlanta and New York experienced the smallest declines of about 3%. Based on CoreLogic’s latest Home Price Index, home prices in 2023 should average about 2% above 2022 levels, but states such as Nevada, Washington, Montana and Utah could record low single-digit average declines.
The 10- and 20-city composite indexes followed the same decelerating trend in February — both up by less than 1% year over year. The10-city index was up by 0.5%, while the 20-city index increased by 0.4%. For both composites, these were the slowest increases since 2012. The 10-city index includes currently better performing metros, such as New York and Chicago, which have seen relatively stronger housing market performance since mid-2022, as the return to cities and offices has gotten underway.
Compared with the 2006 peak, the 10-city composite price index is now 37% higher, while the 20-city composite is up by 44%. Adjusted for inflation, which continues to remain concerningly elevated, the 10-city index is now down by 5%, while the 20-city index shows no change compared with its 2006 high point.
Figure 1: February Home Price Gains Slowest Since July 2012
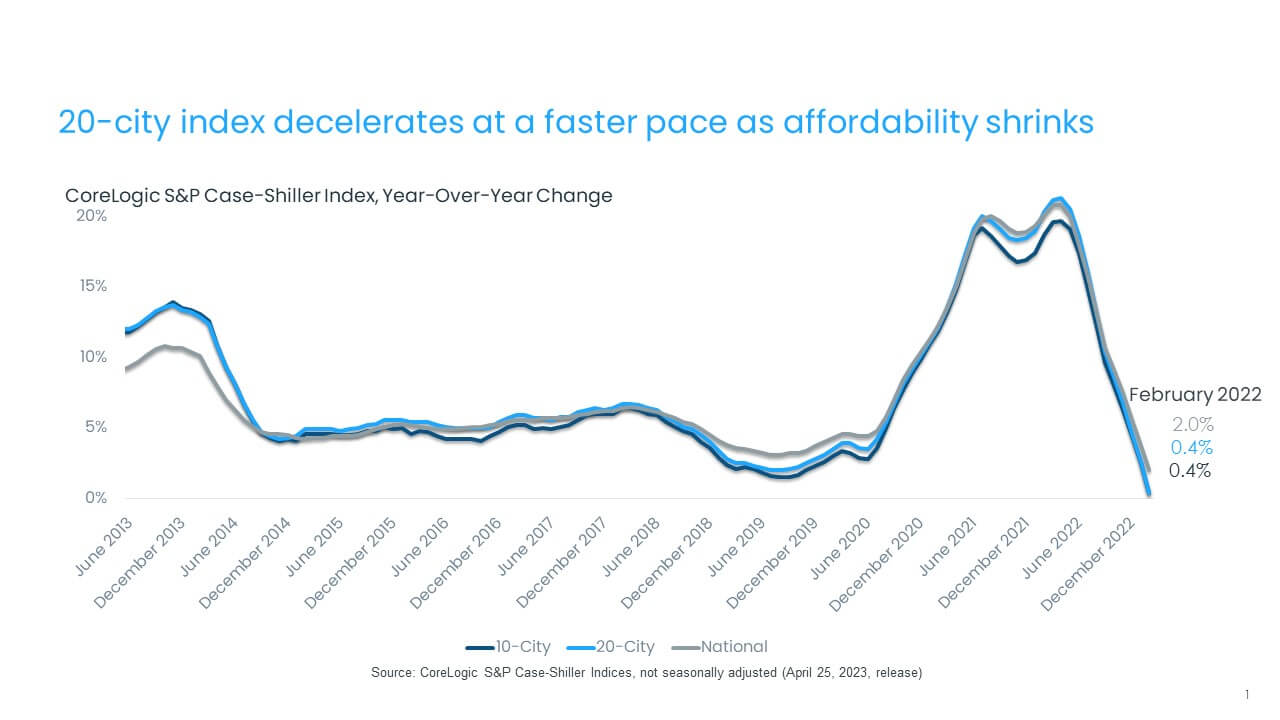
Figure 2: Month-Over-Month Prices Increases Return to Average in February
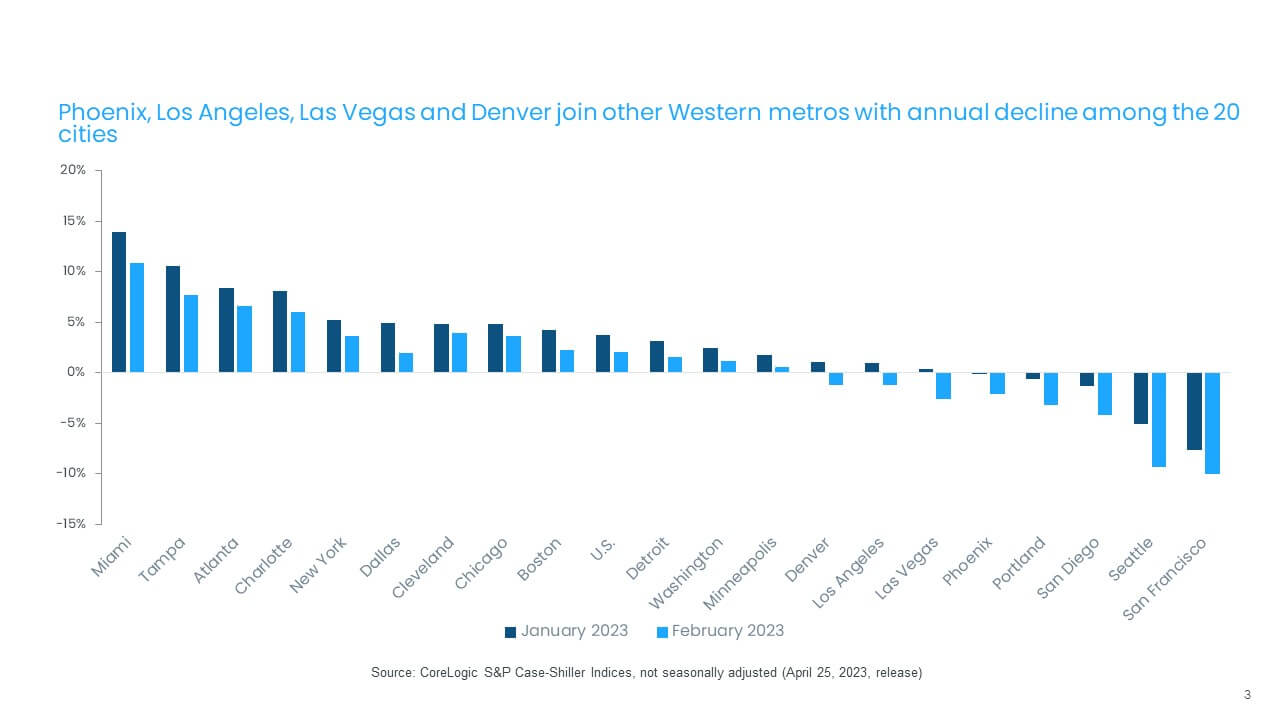
In February, all 20 metros continued to experience decelerating annual gains (Figure 3). Miami was the only metro that recorded double-digit annual home price growth among the 20 tracked markets, up by 10.8% in February but down from January’s non-seasonally adjusted rate of 13.9%. Tampa, Florida again ranked second, recording a 7.7% year-over-year gain in February, down from 10.5% in January.
Atlanta posted the third-highest increase, at 6.6%, while Charlotte, North Carolina, posted a 6% gain. San Francisco and Seattle both continued to post annual declines, down by a respective 10% and 9.3% in February. They were joined by San Diego; Portland, Oregon; Las Vegas; Phoenix; Los Angeles and Denver, where declines ranged from 1% to 4%.
Compared to previous month, Seattle posted the largest price decline, down by 4.2 percentage points, followed by Miami, Las Vegas and Dallas, all down by 3 percentage points since January. Washington, Cleveland, Minneapolis and Boston saw the smallest slowdown compared with January.
Figure 3: Deceleration in Year-Over-Year Home Price Growth Seen in All 20 Metros
Slowing growth across all price tiers similarly persisted through the end of the year. The low tier was up by 1.9% in February, while middle-tier growth remained flat and the high tier posted a small decline, down by 0.2%. The high tier showed the largest deceleration in annual gains compared with the spring 2022 peak, down by 24.3 percentage points. This is a similar trend observed in CoreLogic’s Single-Family Rent Index and may reflect the relative greater mobility of higher-income households during the pandemic, which has since waned.
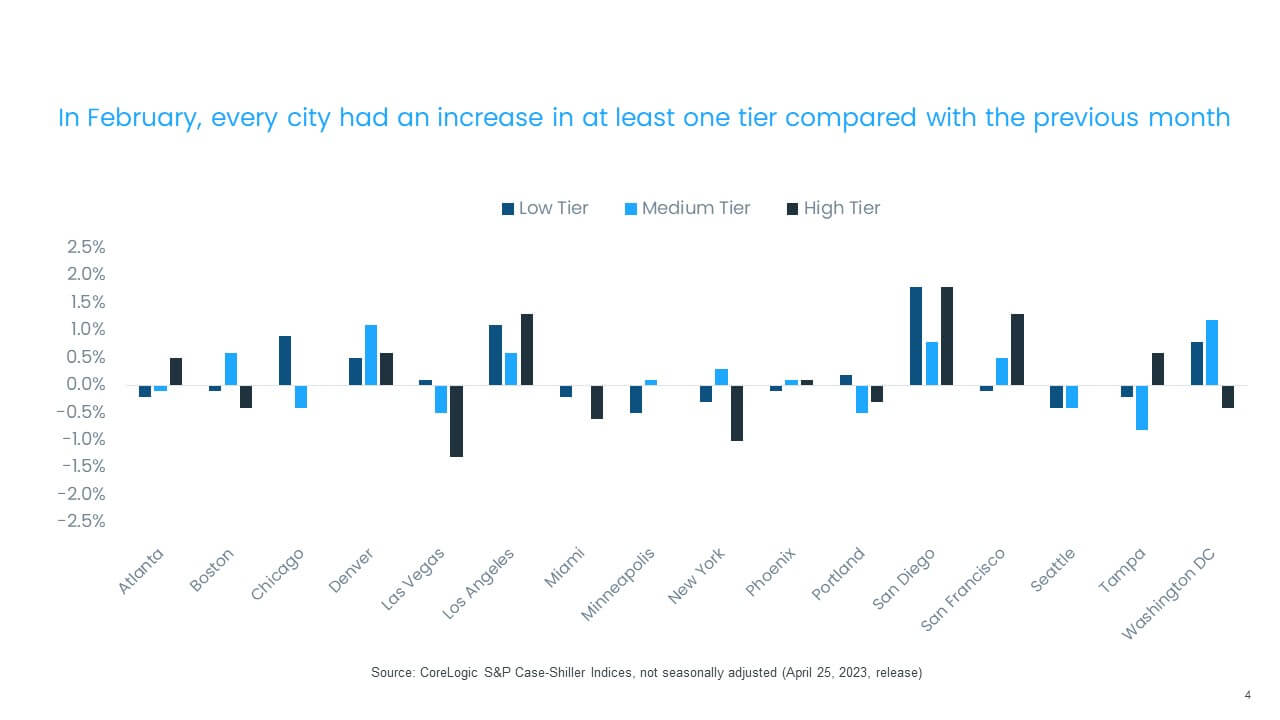
The month-over-month comparison of appreciation by price tier and location also reveals relative changes in demand across the country. In January, most areas posted declines across price tiers, but February’s monthly changes by tier were very mixed, both across regions and price tiers. The largest monthly gains across all price tiers were in San Diego, Los Angeles and Denver. By contrast, New York, Las Vegas and Seattle posted monthly declines across price tiers. In general, it’s hard to draw concrete conclusions given February’s varied changes.
The average monthly price declines among low-tier and medium-tier homes were up by 0.2%, though that number is not seasonally adjusted. High-tier prices were also up, but only by 0.1% month over month on average (Figure 4).
Figure 4: Monthly Price Declines Averages 0.2% for Low and Medium Tiers and 0.1% for High Tiers
Finally, while February home prices in all markets were down compared with their respective peak months in 2022, the rates of decline slowed because of monthly gains seen in many metros. Seattle and San Francisco continued to post the largest drops — down by 17% and 16%, respectively — though the two switched places compared with January. In addition to Seattle, only Dallas, Las Vegas, Minneapolis and New York saw further declines compared with their previous peaks, while San Francisco and San Diego improved (Figure 5).
Figure 5: February Prices Are Down 4.9% From Earlier 2022 Peak
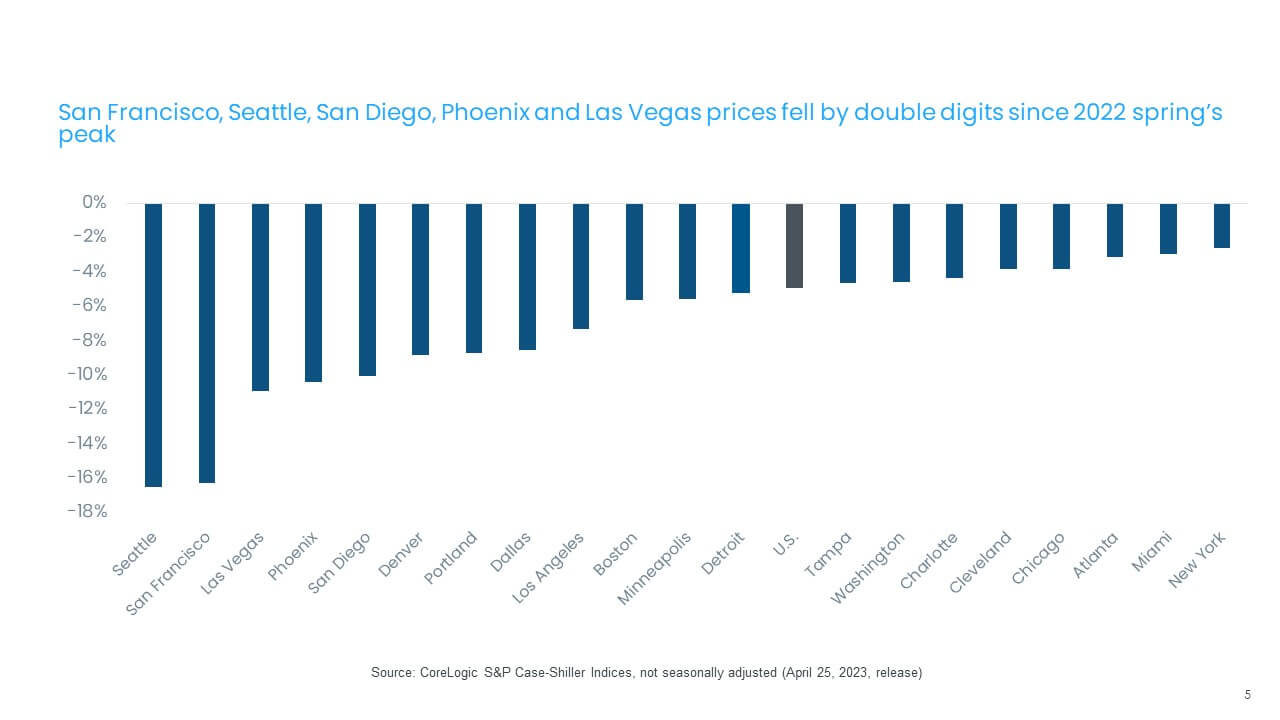
Looking ahead, as Figure 5 clearly suggests, there are many mixed signals about housing market trends and the outlook going forward. Many West Coast markets that saw home sales activity halt in the second part of 2022 are clearly seeing buyers return and competition intensifying. On the other hand, pandemic boomtowns, such as Las Vegas, which saw rapid price growth in the early days of COVID-19, continue to struggle as affordability declines. The trajectory of the typically busy spring homebuying season will depend on mortgage rates and consumer sentiment about market conditions.


