Chat
Chat with Sales Hours: Monday-Friday 8:30 a.m. - 4:30 p.m. (CST)
Contact Sales
Call Sales Toll-Free 1-(866) 774-3282 Hours: Monday-Friday 7 a.m. - 5 p.m. (CST)
Product Login
Product Log-in
Product Support
Product Support
Email Sales
Contact Sales
After Hours
  • Support
  • Sign In Sign In
  • AUS NZ UK
CoreLogic - Home
  • Solutions
    view solutions by:

    Data Solutions

    • Lead Generation
    • Property Data
    • Location Intelligence

    Real Estate

    • Multiple Listing Enterprise
    • Agent & Broker

    Mortgage

    • Origination
    • Servicing
    • Appraisal
    • Commercial Property Tax

    Insurance

    • Hazard Risk
    • Catastrophe Risk Management
    • Risk Evaluation
    • Underwriting Automation
    • Weather
    • Claims Automation
    • Restoration
    • INTRCONNECT

    Mortgage Lenders

    • Origination

    Mortgage Servicers

    • Residential Property Tax
    • Default & Loss Mitigation
    • Portfolio Insight & Monitoring

    Mortgage Appraisers

    • Appraisal

    Real Estate Agents & Brokers

    • Agents & Brokers

    Real Estate MLS

    • Multiple Listing Enterprises

    Commercial Real Estate Owners

    • Commercial Property Tax

    Marketing Departments

    • Property Data

    Insurance Underwriters

    • Risk Evaluation
    • Underwriting Automation
    • Hazard Risk
    • Catastrophe Risk Management

    Insurance Risk Managers

    • Risk Evaluation
    • Hazard Risk
    • Catastrophe Risk Management

    Insurance Claims

    • Claims Automation
    • Restoration Contractors
    • Weather Verification

    Construction Contractors

    • Restoration Contractors

    General

    • Location Intelligence
    • Lead Generation
    • Data Solutions
  • Resources

    Reports

    • Climate Change
    • Construction Cost Update
    • Construction Insights
    • Home Price Insights
    • Homeowner Equity Insights
    • Loan Performance Insight
    • Mortgage Fraud
    • Property Tax Delinquency
    • Single-Family Rent Index

    Insight Blogs

    • Hazard HQ
    • Office of Chief Economist
    • Affordable Housing
    • Homebuying
    • Insurance
    • Other Articles

    More Resources

    • Events
    • Case Studies
    • White Papers
    • Podcasts
    • Quick Takes
  • Company
    • About
    • Leadership
    • Newsroom
    • Contact
    • Careers
  • Search
CoreLogic - Home
  • Solutions
  • Resources
  • Company

    • About
    • Leadership
    • Newsroom
    • Contact
    • Careers
  • Accounts

    • Products Sign-in
  • Contact

    • Sales Contact
    • Product Support
  • Regions

    • Australia
    • New Zealand
    • United Kingdom
  • Social

    • Facebook
    • Instagram
    • Linkedin
    • Twitter
    • Youtube
Solutions
VIEW BY:
  • Data Solutions

    • Lead Generation
    • Property Data
    • Location Intelligence
  • Real Estate

    • Multiple Listing Enterprise
    • Agent & Broker
  • Mortgage

    • Origination
    • Servicing
    • Appraisal
    • Commercial Property Tax
  • Insurance

    • Hazard Risk
    • Catastrophe Risk Management
    • Risk Evaluation
    • Underwriting Automation
    • Weather
    • Claims Automation
    • Restoration
    • INTRCONNECT
  • Mortgage Lenders

    • Origination
  • Mortgage Servicers

    • Residential Property Tax
    • Default & Loss Mitigation
    • Portfolio Insight & Monitoring
  • Mortgage Appraisers

    • Appraisal
  • Real Estate Agents & Brokers

    • Agents & Brokers
  • Real Estate MLS

    • Multiple Listing Enterprises
  • Commercial Real Estate Owners

    • Commercial Property Tax
  • Marketing Departments

    • Property Data
  • Insurance Underwriters

    • Risk Evaluation
    • Underwriting Automation
    • Hazard Risk
    • Catastrophe Risk Management
  • Insurance Risk Managers

    • Risk Evaluation
    • Hazard Risk
    • Catastrophe Risk Management
  • Insurance Claims

    • Claims Automation
    • Restoration Contractors
    • Weather Verification
  • Construction Contractors

    • Restoration Contractors
  • General

    • Location Intelligence
    • Lead Generation
    • Data Solutions
Resources
  • Reports

    • Climate Change
    • Construction Cost Update
    • Construction Insights
    • Home Price Insights
    • Homeowner Equity Insights
    • Loan Performance Insight
    • Mortgage Fraud
    • Property Tax Delinquency
    • Single-Family Rent Index
  • Insight Blogs

    • Hazard HQ
    • Office of Chief Economist
    • Affordable Housing
    • Homebuying
    • Insurance
    • Other Articles
  • More Resources

    • Events
    • Case Studies
    • White Papers
    • Podcasts
    • Quick Takes

Home / Intelligence / US CoreLogic S&P Case-Shiller Index Marches to a Slower Beat, Up 19.7% Annually in May, Marking the Second Month of Deceleration

ABOUT THE AUTHOR
Selma Hepp
Selma Hepp
Chief Economist
View Profile
  • July 26, 2022

US CoreLogic S&P Case-Shiller Index Marches to a Slower Beat, Up 19.7% Annually in May, Marking the Second Month of Deceleration

Annual home price growth remains above 30% in Tampa, Florida; Miami and Dallas

Signs of slowing homebuyer demand are spreading wider across markets and are reflected in slowing price appreciation. In May, the CoreLogic S&P Case-Shiller Index posted a 19.7% increase, down from a 20.6% gain in April, confirming a tipping point after strong reacceleration in home price growth in the early months of 2022. Still, due to the price acceleration momentum of recent months, May’s year-over-year increase was the strongest since the beginning of the data series (Figure 1).

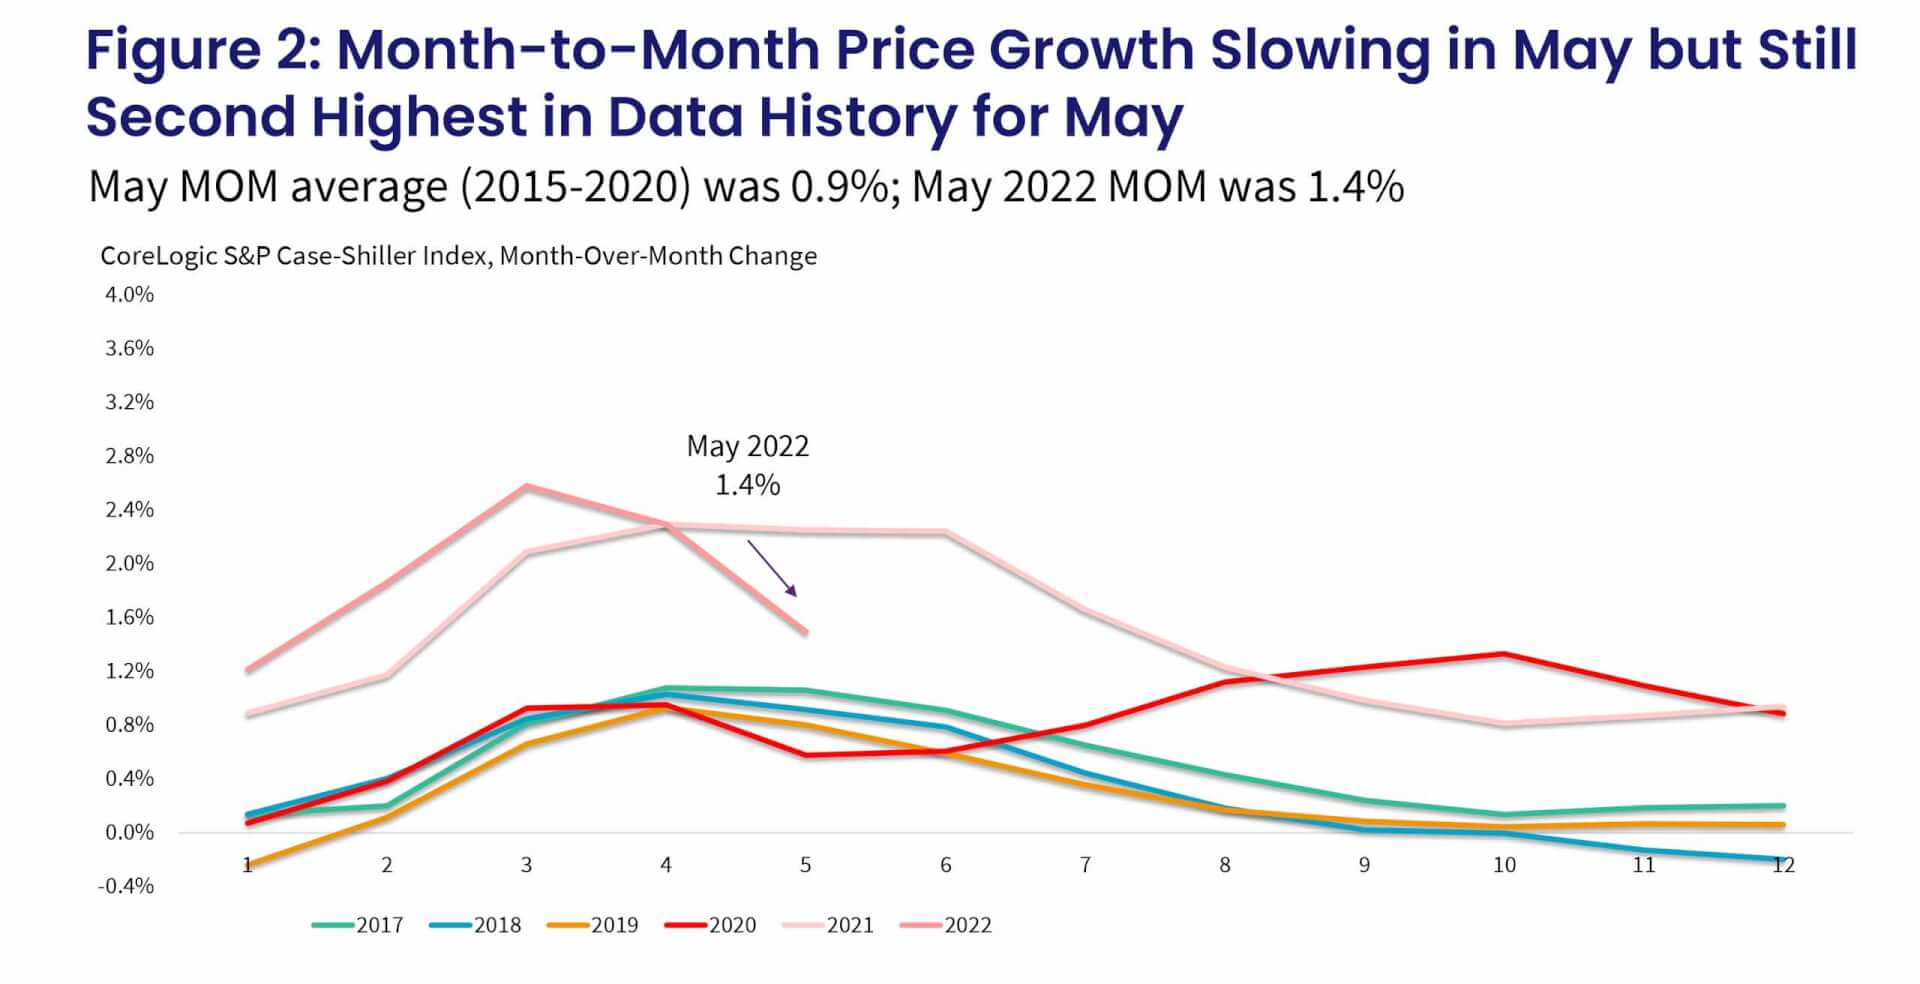
Further indication of slowing price growth is seen in the deceleration of the non-seasonally adjusted month-to-month index, which slowed to 1.5% in May from a 2.6% increase in March and a 2.3% gain in April. May’s increase was the second strongest in the data series following a 2.3% gain last May. Between 2015 and 2020, the monthly index changes from April to May averaged about 0.9% (Figure 2).

While higher mortgage rates and concerns about a looming recession are taking a toll on buyer demand, overall sales activity through the end of May still held relatively steady compared with 2021. June appeared to be a tipping point, with a more significant pullback in buyer interest, which will be reflected in next month’s data. Hallmarks of a slowdown tend to be focused on highly unaffordable markets, as well as those that led with speedy price acceleration over the last two years, such as California’s coastal markets and Phoenix – the top home-price-growth market for 30-plus consecutive months according to the CoreLogic S&P Case-Shiller Index. And even though the once-sweltering market is decelerating, it’s hardly balanced. Still, after two record-breaking years, the housing market remains difficult for buyers, who still face competition and are paying premiums for attractive properties.

The 10- and 20-city composite indexes also showed signs of losing speed, up by 19% and 20.5% year over year, respectively, compared with 19.6% and 21.2% in April. The overall tendency for more price increases in smaller markets continues to drive the 20-city index growth higher, as buyers flock to smaller and more affordable areas, particularly those in the Southeast and Florida.

© 2022 CoreLogic,Inc., All rights reserved.

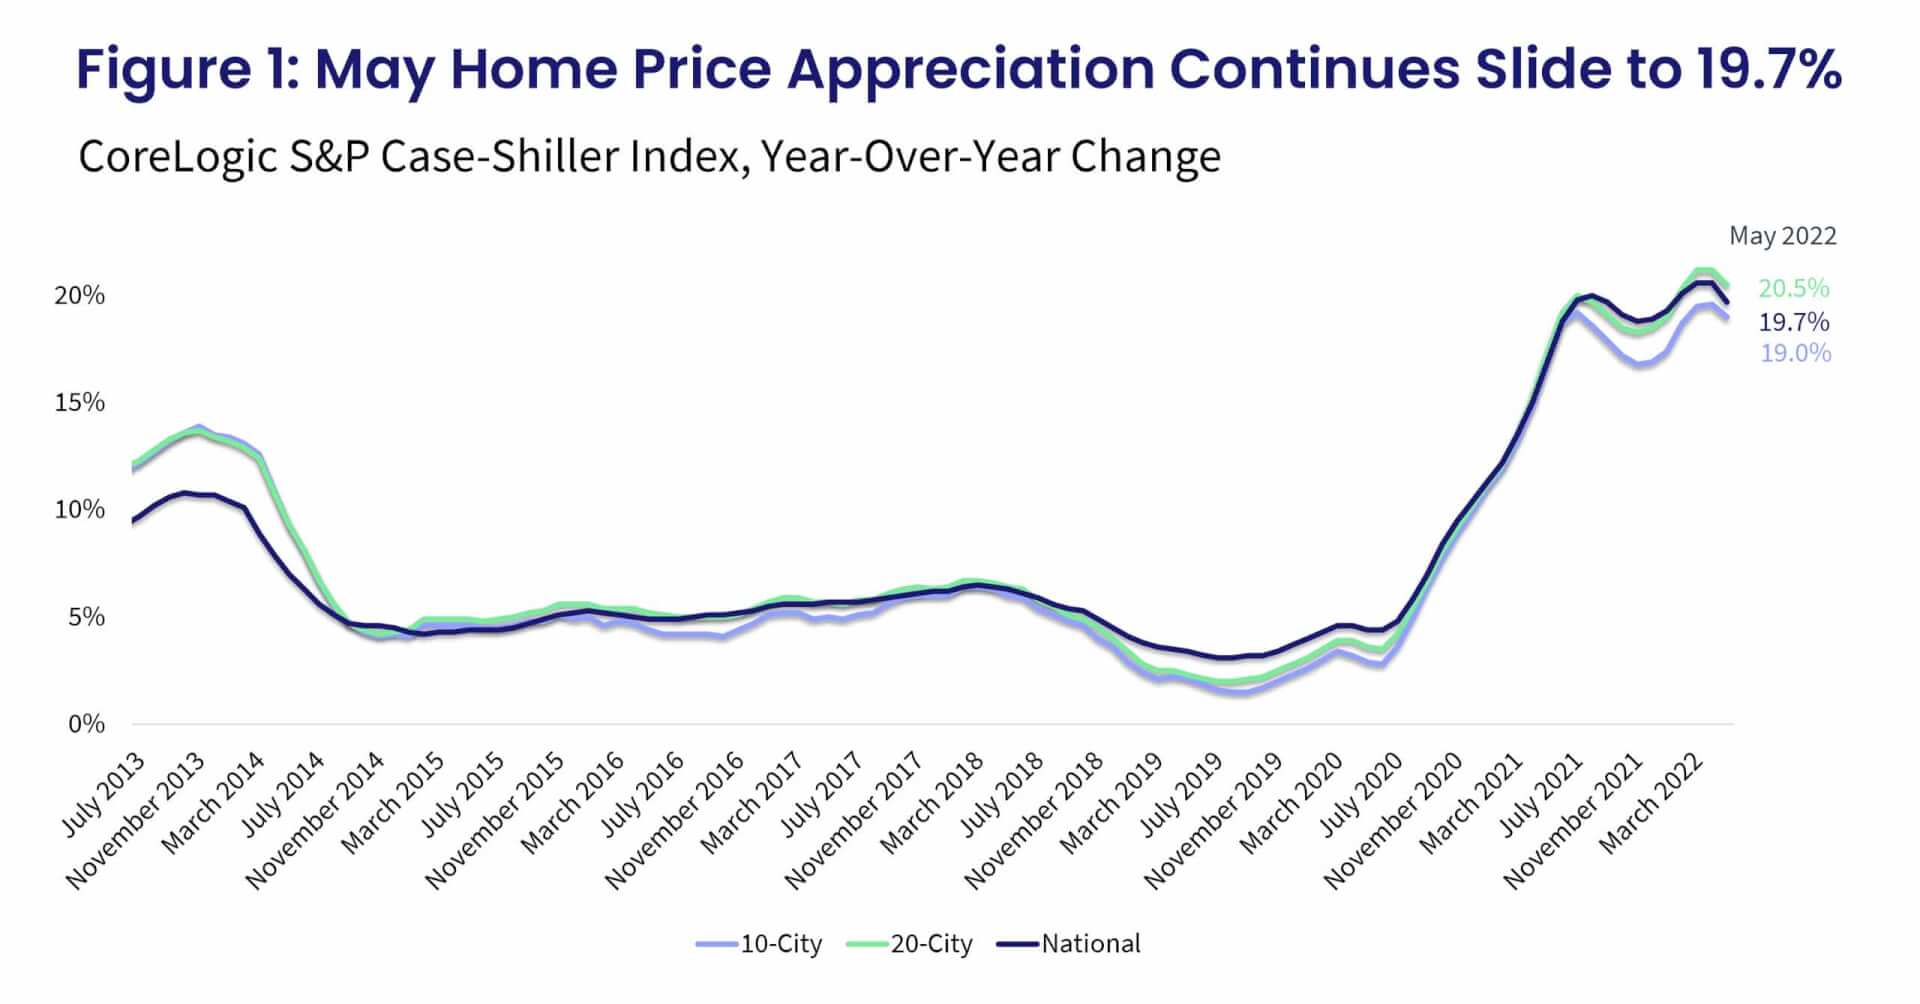
Compared with the 2006 peak, the 10-city composite is now 45% higher, while the 20-city composite is up by 54%. Adjusted for inflation, which continues to remain stubbornly high, the 10-city index is now up by 3%, while the 20-city index is up by 9% compared with the 2006 peak.

© 2022 CoreLogic,Inc., All rights reserved.

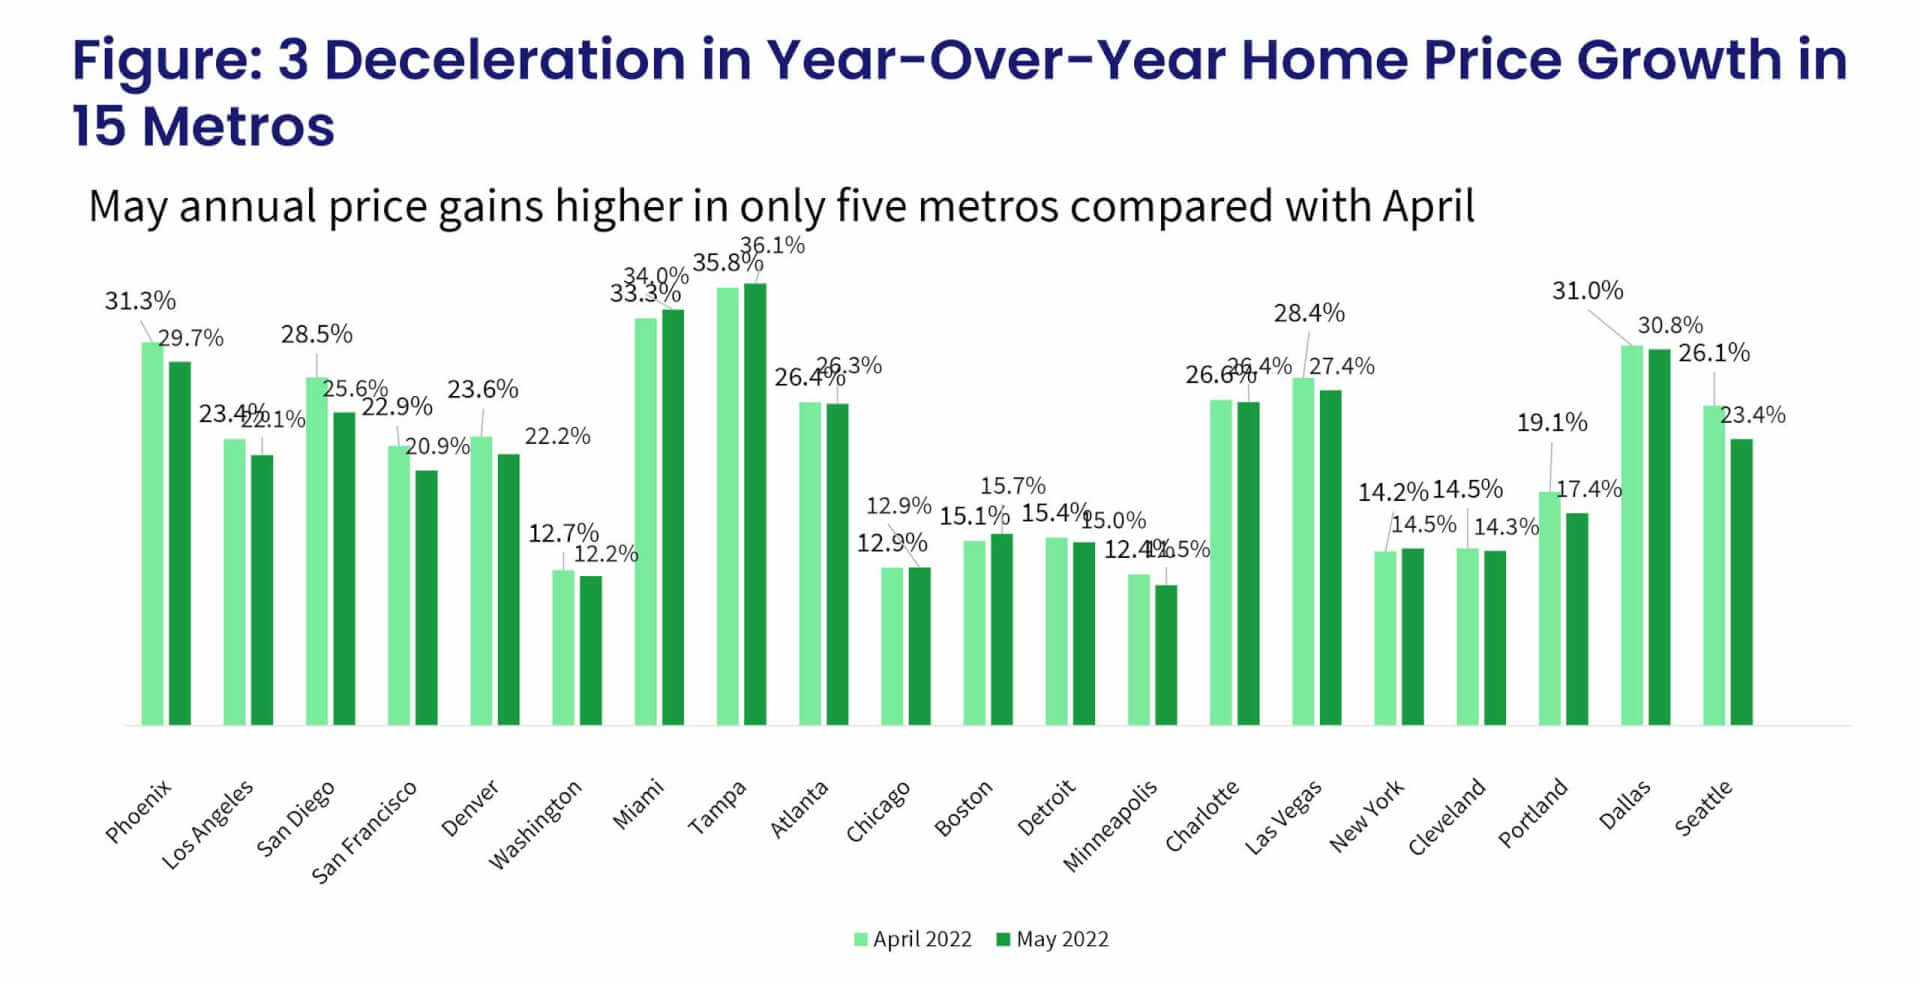
For the third month, Tampa posted the strongest annual home price growth among the 20 tracked markets, surging by 36.1% in May, up from April’s non-seasonally adjusted rate of 35.8%.

Miami ranked second, recording a 34% year-over-year gain in May, up from 33.3% the month before. Dallas now ranks third, with a 30.8% increase in May, while Phoenix fell to the fourth position with a 29.7% jump. And while Phoenix’s rate of growth slowed from March and April, it didn’t post the largest slowdown in annual gains as it did in March.

Seattle, San Diego and San Francisco posted the largest slowdowns in annual gains compared with April. On the other hand, Miami and Boston again showed the strongest acceleration in annual gains.

Minneapolis and Washington continued to post the slowest increases in annual gains, a respective 11.5% and 12.2%. Despite having the slowest rate of annual price increases, these areas have still experienced double-digit growth rates for 18 consecutive months.

Fifteen out of 20 metro areas experienced a deceleration in annual gains, up from 11 in April. (Figure 3).

© 2022 CoreLogic,Inc., All rights reserved.

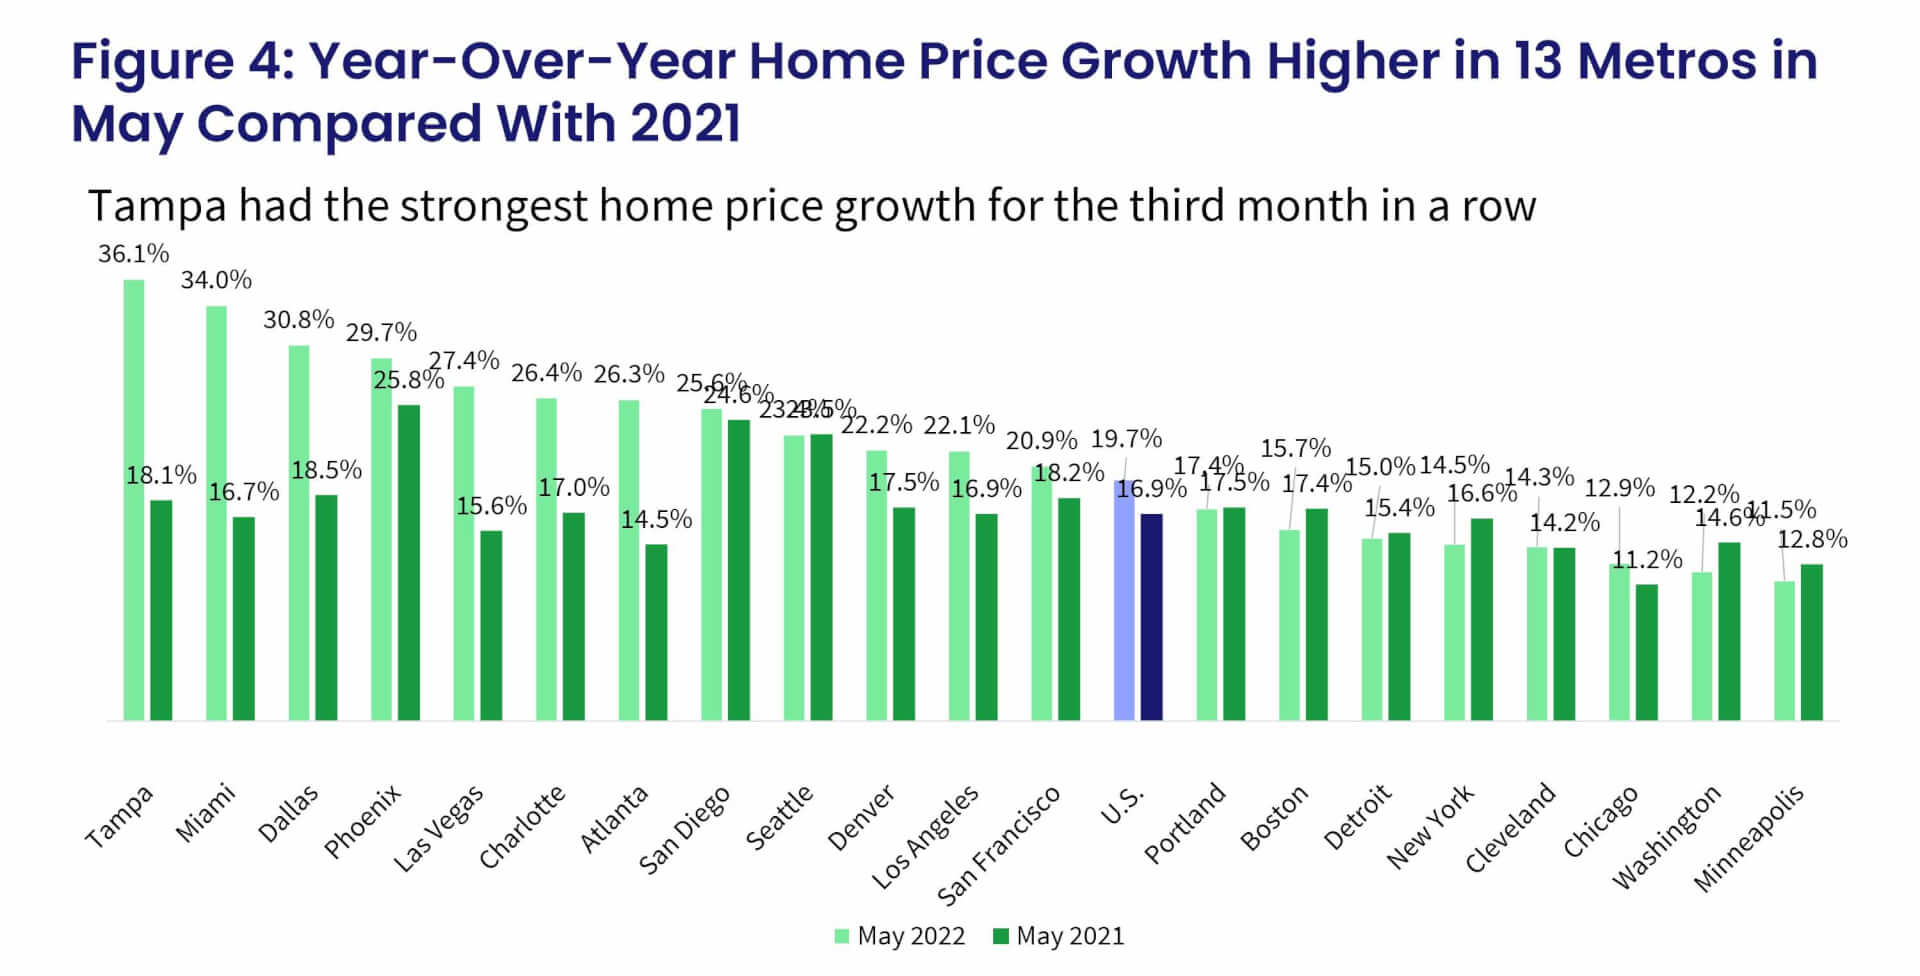
Compared with annual gains recorded last May, 13 metros continued to see stronger increases. Washington posted the largest slowdown, down by 2.4 percentage points, followed by New York (down by 2.1 percentage points) and Boston (down by 1.7 percentage points).

On the other hand, Tampa and Miami were up by as much as 17 to 18 percentage points in just one year (Figure 4).

© 2022 CoreLogic,Inc., All rights reserved.

Furthermore, all three price tiers also showed slower annual gains. The low-price tier was up by 20.9% in May, while the middle tier slowed to 20.6% and the high tier was up by 23%. The low tier posted the slowest deceleration in annual gains. Acceleration in growth in the low tier compared with higher tiers reversed trends seen in previous months and could reflect a rush of buyers in the early months of the year prior to the mortgage rate surge. The budgets of low-tier buyers are more sensitive to changes in mortgage rates and the resulting affordability constraints. Also, the presence of investors, which has been elevated in the last year, could be putting pressure on low-tier price growth.

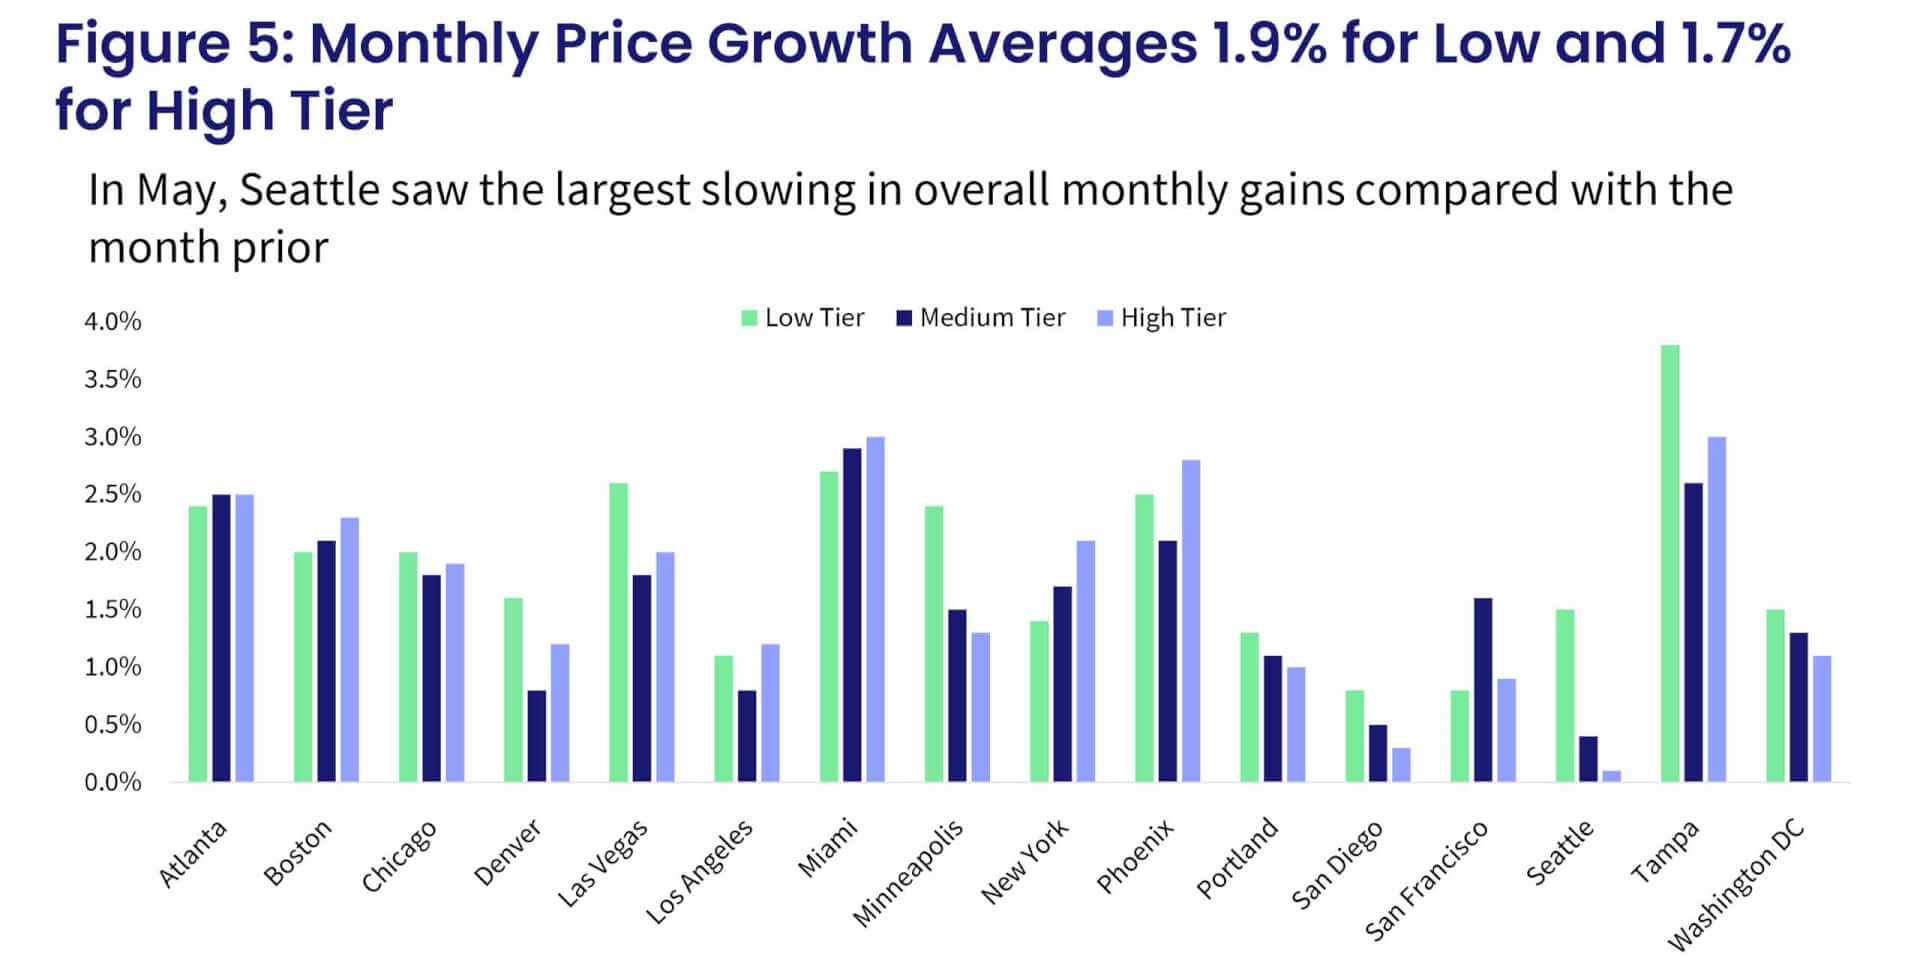
The month-over-month comparison of appreciation by price tier and location also reveals relative changes in demand across the country. From April to May, the pricier West Coast metros – particularly Seattle, San Diego, San Francisco and Portland, Oregon – showed smaller monthly increases compared with other metros. For the seventh consecutive month, all metros had at least some gains across the price tiers, although some of the growth can be attributed to seasonality since monthly increases are generally positive between April and May.

The largest monthly gains were in the South, including Miami and Tampa, which were both up notably in May. Seattle, by contrast, showed the strongest slowing in monthly gains, particularly in the high tier.

The average monthly gains among low-tier homes were up by 1.9% May, though again that number is not seasonally adjusted. The high-tier monthly gains averaged 1.7% in May. The middle-tier monthly price increases averaged 1.6% (Figure 5).

Housing markets have moved away from the overheated early spring conditions, as demand has dampened in light of higher mortgage costs and fears of a looming recession have deteriorated consumer confidence. Most of the weakening demand appears to be in costly West Coast markets that have seen considerable price growth over the last two years, while more affordable, warmer regions remain on buyers’ radars. Also, based on many other market indicators, buyers still face plenty of competition – particularly for attractive properties – including multiple offers and final sales prices higher than asking prices. Thus, while the market is moving away from sellers, a balanced market remains far off. Pressure on home price growth will persist and is forecast to remain in the mid-teen percentage points through the end of the year.

© 2022 CoreLogic,Inc., All rights reserved.
  • Category: Home Price Insights, Intelligence, Reports
  • Tags: Case Shiller Index
ABOUT THE AUTHOR
Selma Hepp
Selma Hepp
Chief Economist
View Profile

Related Posts

mississippi tornadoes
Blogs

March 24 EF-4 Tornado in Mississippi

CoreLogic estimates over 4,100 homes were within the path of the tornado that hit Mississippi on March 24, 2023.

March 29, 2023
California Atmospheric Rivers
Core Conversations

What Was it Really Like to Live Through the California Floods? Our Team Spills | Part 2

In Part 2, host Maiclaire Bolton Smith talks about the atmospheric rivers and the snow that has made headlines and headway in altering California’s natural hazard landscape.

March 29, 2023
CSI_Promo_Mar2023
Blogs

US CoreLogic S&P Case-Shiller Index Gain Slows to Pre-Pandemic Low, Up by 3.8% Year Over Year in January

The index continued to decline year over year in January, again posting a single-digit gain.

March 28, 2023

About Corelogic

  • Newsroom
  • Leadership
  • Careers
  • Ethics & Compliance

Accounts

  • Products Sign-in

Contact

  • Sales Contact
  • Product Support

Regions

  • CoreLogic Australia
  • CoreLogic New Zealand
  • CoreLogic UK

Follow & Connect

  • Facebook
  • Instagram
  • Linkedin
  • Twitter
  • YouTube
© 2023 CoreLogic. All rights reserved.
  • Legal
  • Privacy Policy
  • CCPA
  • Cookie Preferences
  • Security
  • Sitemap
  • Accessibility
  • Legal
  • Privacy Policy
  • CCPA
  • Cookie Preferences
  • Security
  • Sitemap
  • Accessibility