Chat
Chat with Sales Hours: Monday-Friday 8:30 a.m. - 4:30 p.m. (CST)
Contact Sales
Call Sales Toll-Free 1-(866) 774-3282 Hours: Monday-Friday 7 a.m. - 5 p.m. (CST)
Product Login
Product Log-in
Product Support
Product Support
Email Sales
Contact Sales
After Hours
  • Support
  • Sign In Sign In
  • AUS NZ UK
CoreLogic - Home
  • Solutions
    view solutions by:

    Data Solutions

    • Lead Generation
    • Property Data
    • Location Intelligence

    Real Estate

    • Multiple Listing Enterprise
    • Agent & Broker

    Mortgage

    • Origination
    • Servicing
    • Appraisal
    • Commercial Property Tax

    Insurance

    • Hazard Risk
    • Catastrophe Risk Management
    • Risk Evaluation
    • Underwriting Automation
    • Weather
    • Claims Automation
    • Restoration
    • INTRCONNECT

    Mortgage Lenders

    • Origination

    Mortgage Servicers

    • Residential Property Tax
    • Default & Loss Mitigation
    • Portfolio Insight & Monitoring

    Mortgage Appraisers

    • Appraisal

    Real Estate Agents & Brokers

    • Agents & Brokers

    Real Estate MLS

    • Multiple Listing Enterprises

    Commercial Real Estate Owners

    • Commercial Property Tax

    Marketing Departments

    • Property Data

    Insurance Underwriters

    • Risk Evaluation
    • Underwriting Automation
    • Hazard Risk
    • Catastrophe Risk Management

    Insurance Risk Managers

    • Risk Evaluation
    • Hazard Risk
    • Catastrophe Risk Management

    Insurance Claims

    • Claims Automation
    • Restoration Contractors
    • Weather Verification

    Construction Contractors

    • Restoration Contractors

    General

    • Location Intelligence
    • Lead Generation
    • Data Solutions
  • Resources

    Reports

    • Climate Change
    • Construction Cost Update
    • Construction Insights
    • Home Price Insights
    • Homeowner Equity Insights
    • Loan Performance Insight
    • Mortgage Fraud
    • Property Tax Delinquency
    • Single-Family Rent Index

    Insight Blogs

    • Hazard HQ
    • Office of Chief Economist
    • Affordable Housing
    • Homebuying
    • Insurance
    • Other Articles

    More Resources

    • Events
    • Case Studies
    • White Papers
    • Podcasts
    • Quick Takes
  • Company
    • About
    • Leadership
    • Newsroom
    • Contact
    • Careers
  • Search
CoreLogic - Home
  • Solutions
  • Resources
  • Company

    • About
    • Leadership
    • Newsroom
    • Contact
    • Careers
  • Accounts

    • Products Sign-in
  • Contact

    • Sales Contact
    • Product Support
  • Regions

    • Australia
    • New Zealand
    • United Kingdom
  • Social

    • Facebook
    • Instagram
    • Linkedin
    • Twitter
    • Youtube
Solutions
VIEW BY:
  • Data Solutions

    • Lead Generation
    • Property Data
    • Location Intelligence
  • Real Estate

    • Multiple Listing Enterprise
    • Agent & Broker
  • Mortgage

    • Origination
    • Servicing
    • Appraisal
    • Commercial Property Tax
  • Insurance

    • Hazard Risk
    • Catastrophe Risk Management
    • Risk Evaluation
    • Underwriting Automation
    • Weather
    • Claims Automation
    • Restoration
    • INTRCONNECT
  • Mortgage Lenders

    • Origination
  • Mortgage Servicers

    • Residential Property Tax
    • Default & Loss Mitigation
    • Portfolio Insight & Monitoring
  • Mortgage Appraisers

    • Appraisal
  • Real Estate Agents & Brokers

    • Agents & Brokers
  • Real Estate MLS

    • Multiple Listing Enterprises
  • Commercial Real Estate Owners

    • Commercial Property Tax
  • Marketing Departments

    • Property Data
  • Insurance Underwriters

    • Risk Evaluation
    • Underwriting Automation
    • Hazard Risk
    • Catastrophe Risk Management
  • Insurance Risk Managers

    • Risk Evaluation
    • Hazard Risk
    • Catastrophe Risk Management
  • Insurance Claims

    • Claims Automation
    • Restoration Contractors
    • Weather Verification
  • Construction Contractors

    • Restoration Contractors
  • General

    • Location Intelligence
    • Lead Generation
    • Data Solutions
Resources
  • Reports

    • Climate Change
    • Construction Cost Update
    • Construction Insights
    • Home Price Insights
    • Homeowner Equity Insights
    • Loan Performance Insight
    • Mortgage Fraud
    • Property Tax Delinquency
    • Single-Family Rent Index
  • Insight Blogs

    • Hazard HQ
    • Office of Chief Economist
    • Affordable Housing
    • Homebuying
    • Insurance
    • Other Articles
  • More Resources

    • Events
    • Case Studies
    • White Papers
    • Podcasts
    • Quick Takes

Home / Intelligence / Buyer Competition Reached 12-Year High at the End of 2020

ABOUT THE AUTHOR
Selma Hepp
Selma Hepp
Chief Economist
View Profile
  • March 25, 2021

Buyer Competition Reached 12-Year High at the End of 2020


  • Sellers most likely to get their full asking price at the end of 2020, overturning the traditional seasonal slowdown
  • Buyer competition intensified in resort communities and areas with slower housing market prior to the pandemic
  • Buyer competition likely to remain strong going into traditional spring homebuying season

The housing market, like many segments of the economy, had a unique year in 2020. Pandemic-induced demand – for homes with more living space and located in lower density neighborhoods — coupled with historically favorable mortgage rates and declining for-sale inventories led to the most competitive market seen since at least 2008. Buyers competing for fewer properties on the market were generally willing to offer relatively more than they have been in recent years, leading to the ratio of closing price to listing price reaching the highest level since at least 2008.

Sellers Continue to Receive More Than Asking Price

Market competition herein relies on the Buyer/Seller Market Indicator from CoreLogic ListingTrends. This indicator measures the ratio of median sold price and the median list price. The higher the ratio, the closer the selling price is to the listing price.

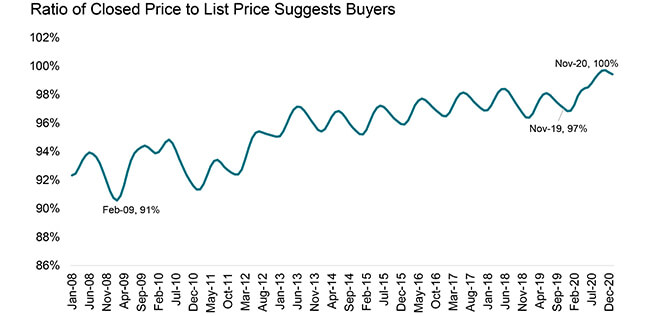
Figure 1 illustrates the national Buyer/Seller Market Indicator trend going back to the beginning of data series in 2008. The Indicator follows a distinct seasonal pattern with the annual peak in summer months (May thru June) and troughs in December or January. After some volatility during the Great Recession when the housing market was flooded with distressed sales, the Indicator maintained a steady upward drift from 2013 to 2020. But in the second half of 2020 when the ratio generally takes a seasonal dip, it jumped further to reach 100% by December 2020.

In other words, sellers who sold their homes generally obtained their full asking price, highlighting the competitive nature of the housing market over the last year. The high ratio also signifies that a higher share of homes are selling over the asking price compared to a year prior – in November, when the Buyer/Seller Market Indicator peaked, 36% of homes sold over the asking price, up from 19% in 2019.

Figure 1: Buyer/Seller Market Indicator Reached New Highs at the end of 2020

Competition among buyers intensified in nearly all metropolitan areas across the country at the end of 2020. Three exceptions were the San Francisco, California, Eugene, Oregon, and Reno, Nevada metros[1]. In San Francisco, where the index declined by 2 percent points in the fourth quarter compared to last year, buyers had been consistently paying at or over the asking price since 2013 when the local housing market initially intensified following the absorption of post Great Recession distressed inventory. Recent slowing of price competition is consistent with local demand moving away from the most expensive and relatively denser part of the Bay Area.

Vacation Towns Are on the Rise

On the other hand, the housing markets which saw the largest increase in Buyer/Seller Market Indicator between the fourth quarter of 2019 and 2020 are listed in Figure 2[2]. Interestingly, many of these metros are generally less densely populated metros adjacent to some of the largest metros, particularly in North East, but also vacations towns with either water or mountain access. One such example is Vineland-Bridgeton, NJ; it is located outside Philadelphia and on Delaware Bay, and market competition jumped from 94% to 99%. In addition, the CoreLogic Home Price Index clocked one of the largest jumps across all U.S. metros of 23% in December.Figure 2: Top 20 markets with largest increase in Buyer/Seller Market Indicator

Metro AreaBuyer/Seller IndicatorYOY HPI Change
Avg Nov 2020 – Jan 2021YOY change in percentage pointsDec 2020
East Stroudsburg PA100%6.4%22%
Sierra Vista-Douglas AZ99%5.5%11%
Vineland-Bridgeton NJ99%4.8%23%
Flagstaff AZ99%4.2%18%
Rocky Mount NC99%4.2%11%
Chico CA99%4.1%10%
New Haven-Milford CT99%4.1%11%
Barnstable Town MA99%4.0%14%
Monroe MI99%4.0%7%
Camden NJ100%3.9%12%
Trenton NJ99%3.9%7%
Salisbury MD-DE100%3.9%10%
Bridgeport-Stamford-Norwalk CT98%3.9%9%
Cleveland-Elyria OH99%3.9%12%
Canton-Massillon OH99%3.9%14%
Kingston NY98%3.7%3%
Detroit-Dearborn-Livonia MI98%3.7%9%
Stockton-Lodi CA102%3.7%11%
Youngstown-Warren-Boardman OH-PA97%3.7%9%
Lake County-Kenosha County IL-WI97%3.4%7%

Source: CoreLogic ListingTrends, 2/25/21 release© 2021 CoreLogic,Inc., All rights reserved.

In addition, among the top 20 markets with the largest increase in Buyer/Seller Market Indicator are 5 markets located in Ohio and Michigan, including Cleveland and Detroit, where the increase in market competition may reflect relatively weaker competition prior to COVID-19 which may have intensified as housing markets across the country leaped into higher gear after the onset of the pandemic.

Going forward, buyer competition is expected to remain strong as we approach the traditional spring home buying season and the inventory of homes listed for sale remains at historic lows. Successful administration of mass vaccinations may help bring more inventory later in the year but with currently inventory-starved markets, the additional homes may not bring enough respite. The recent upswing in mortgage rates may push some potential home buyers out of the market, though with such low inventories of homes for sale the impact on the Buyer/Seller Market Indicator will likely be minimal.

For more information on the housing market and buyer trends, visit corelogic.com/insights.

©2021 CoreLogic, Inc.,  All rights reserved. 

[1] San Francisco metropolitan division includes San Francisco and San Mateo counties

[2] The analysis includes 233 metropolitan areas and metropolitan divisions

  • Category: Blogs, Intelligence, Office of the Chief Economist
  • Tags: Housing Market, Market Trends
ABOUT THE AUTHOR
Selma Hepp
Selma Hepp
Chief Economist
View Profile

Want to learn more about CoreLogic Housing Trends?

We’ve got more answers to the questions you have.

See Solutions

Related Posts

Tornado footprints in Southern California captured by CoreLogic's weather verification technology as viewed in CoreLogic Reactor™.
Blogs

A Rare Los Angeles Tornado and Near Hurricane-Force Winds in San Francisco

CoreLogic Weather Verification Services captured wind and tornado footprints from the severe weather system in California.

March 24, 2023
atmospheric rivers california
Core Conversations

What Was it Really Like to Live Through the California Floods? Our Team Spills

A Conversation With Kent David and Tom Larsen Since the beginning of the year, California has been drenched by atmospheric rivers. The flooding in California

March 22, 2023
Ecuador earthquake
Blogs

M6.8 Earthquake Near the Coast of Ecuador

CoreLogic estimates that insurable losses from the Ecuador earthquake will be up to $600 million.

March 21, 2023

About Corelogic

  • Newsroom
  • Leadership
  • Careers
  • Ethics & Compliance

Accounts

  • Products Sign-in

Contact

  • Sales Contact
  • Product Support

Regions

  • CoreLogic Australia
  • CoreLogic New Zealand
  • CoreLogic UK

Follow & Connect

  • Facebook
  • Instagram
  • Linkedin
  • Twitter
  • YouTube
© 2023 CoreLogic. All rights reserved.
  • Legal
  • Privacy Policy
  • CCPA
  • Cookie Preferences
  • Security
  • Sitemap
  • Accessibility
  • Legal
  • Privacy Policy
  • CCPA
  • Cookie Preferences
  • Security
  • Sitemap
  • Accessibility